Analysis of Investment Portfolio Performance Report - Finance Module

Verified

Added on  2020/02/19

|9
|456
|31
Report
AI Summary
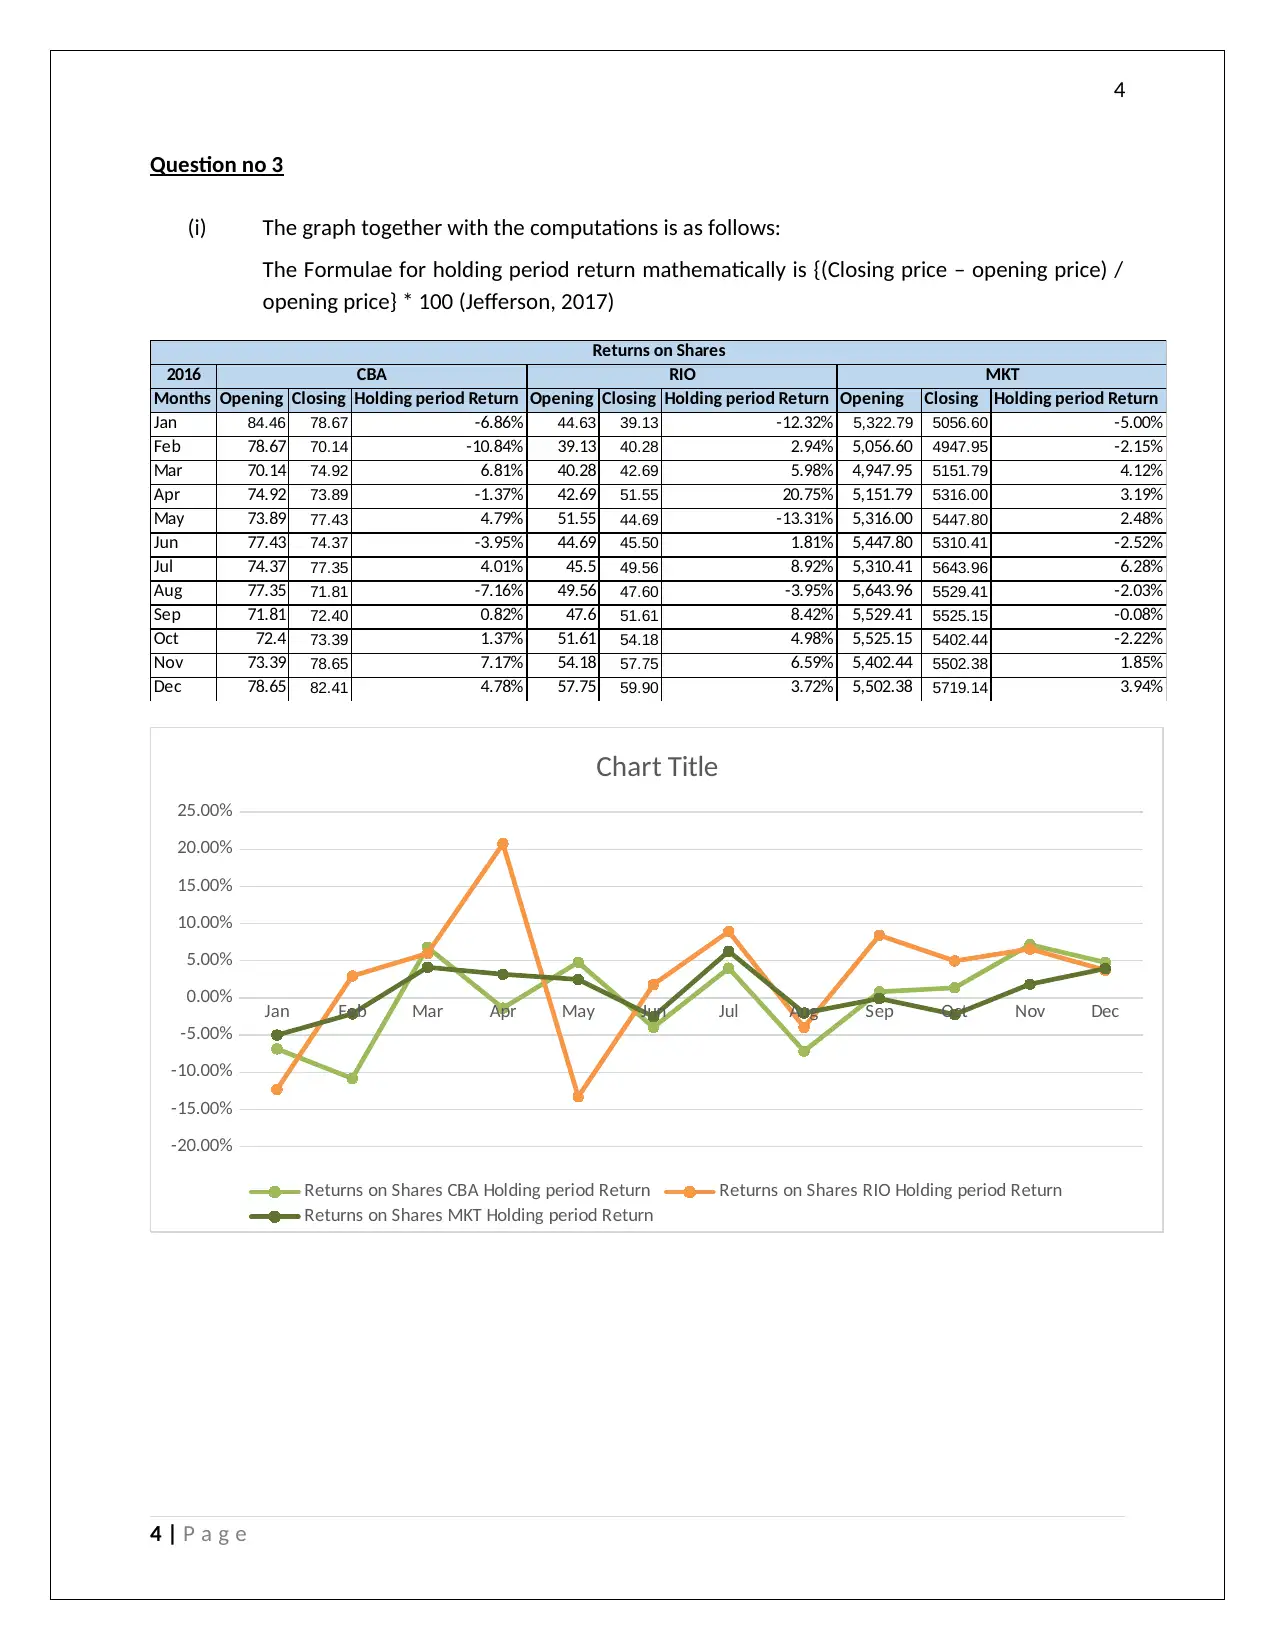
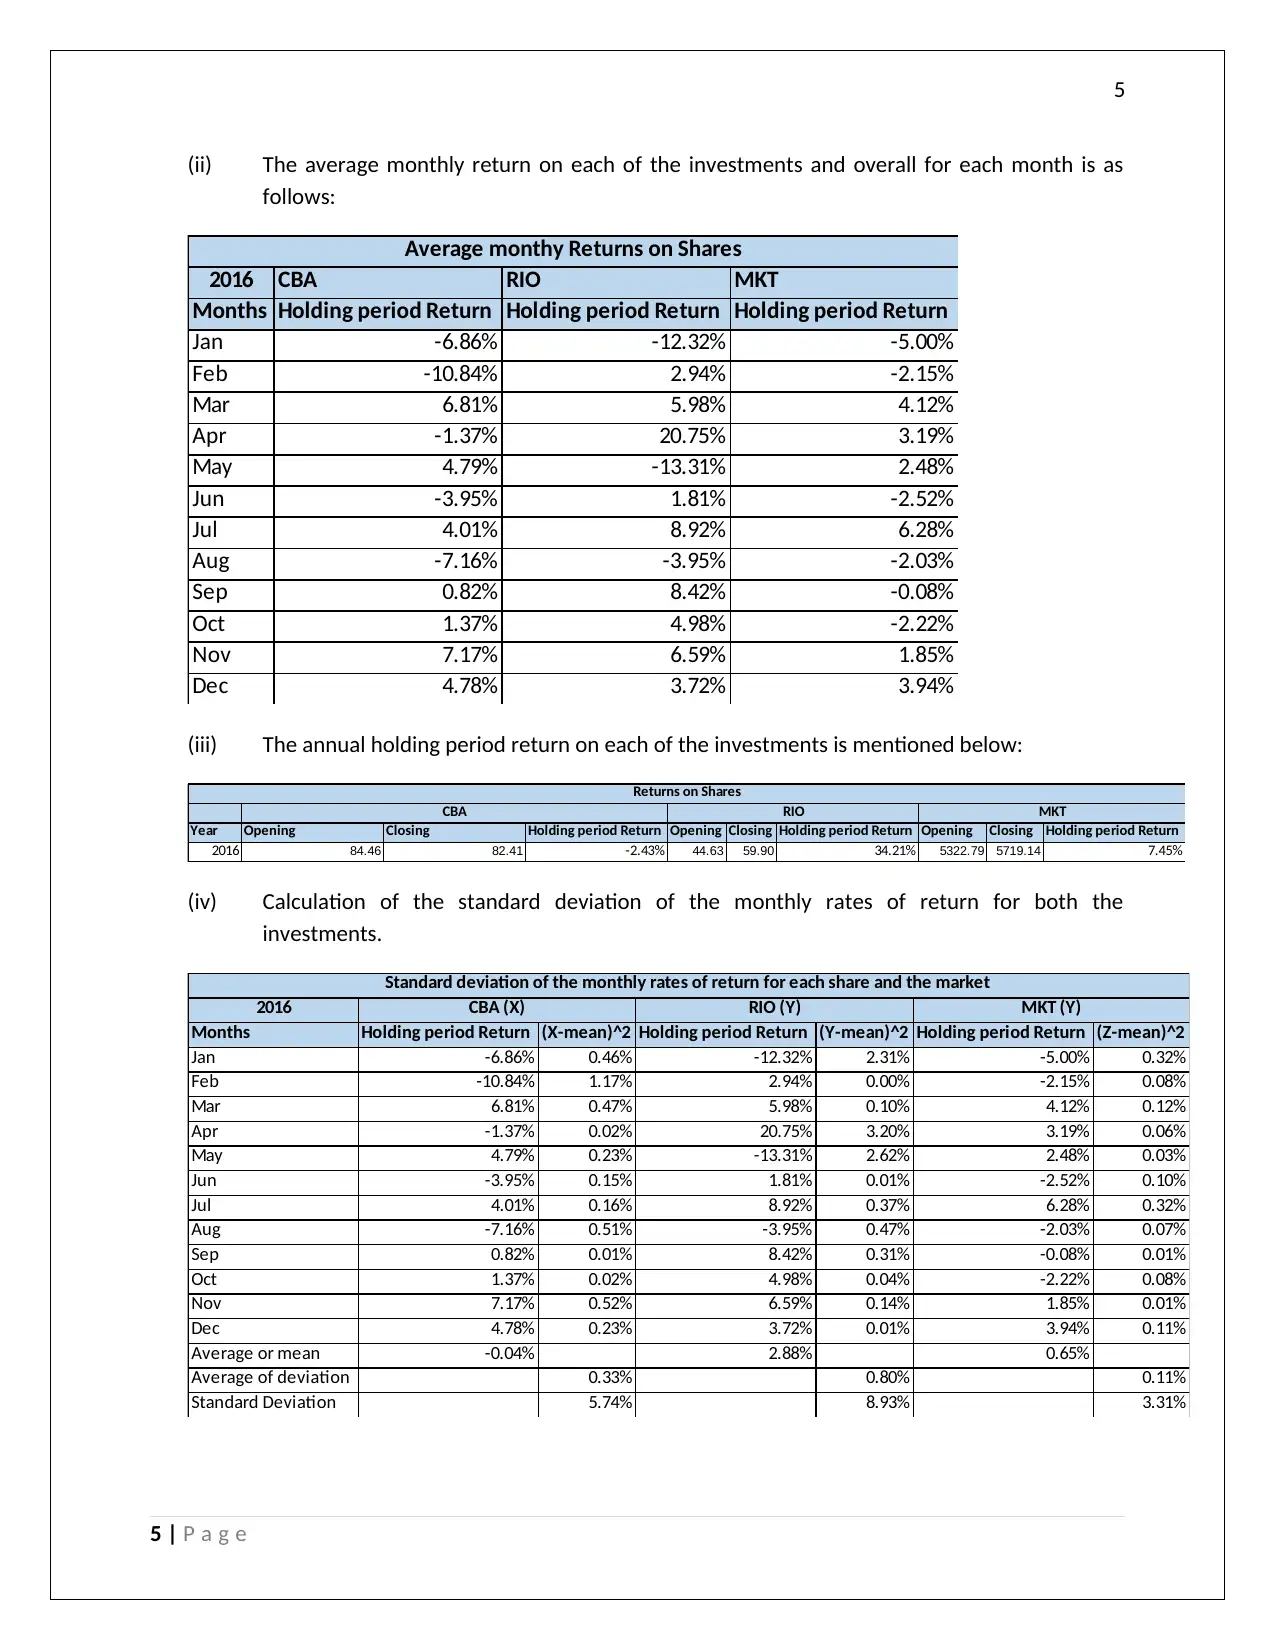
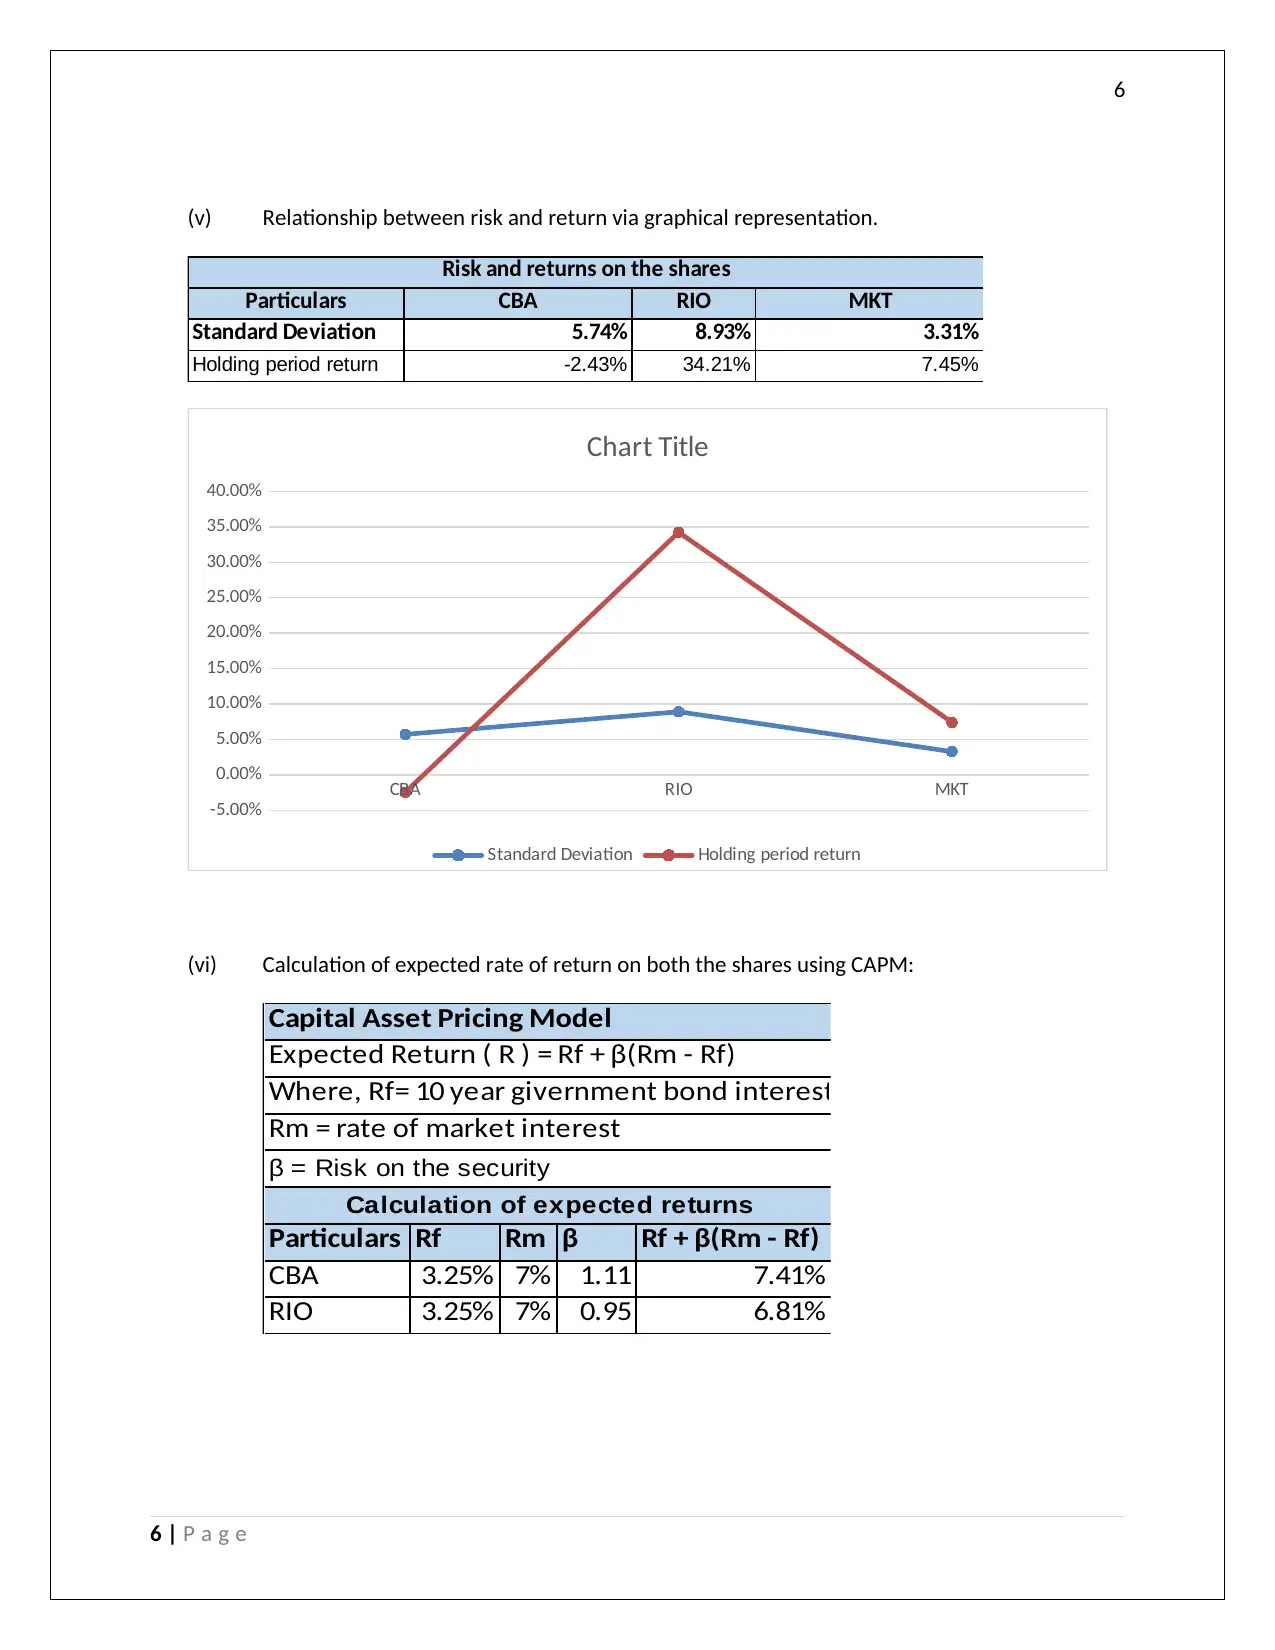
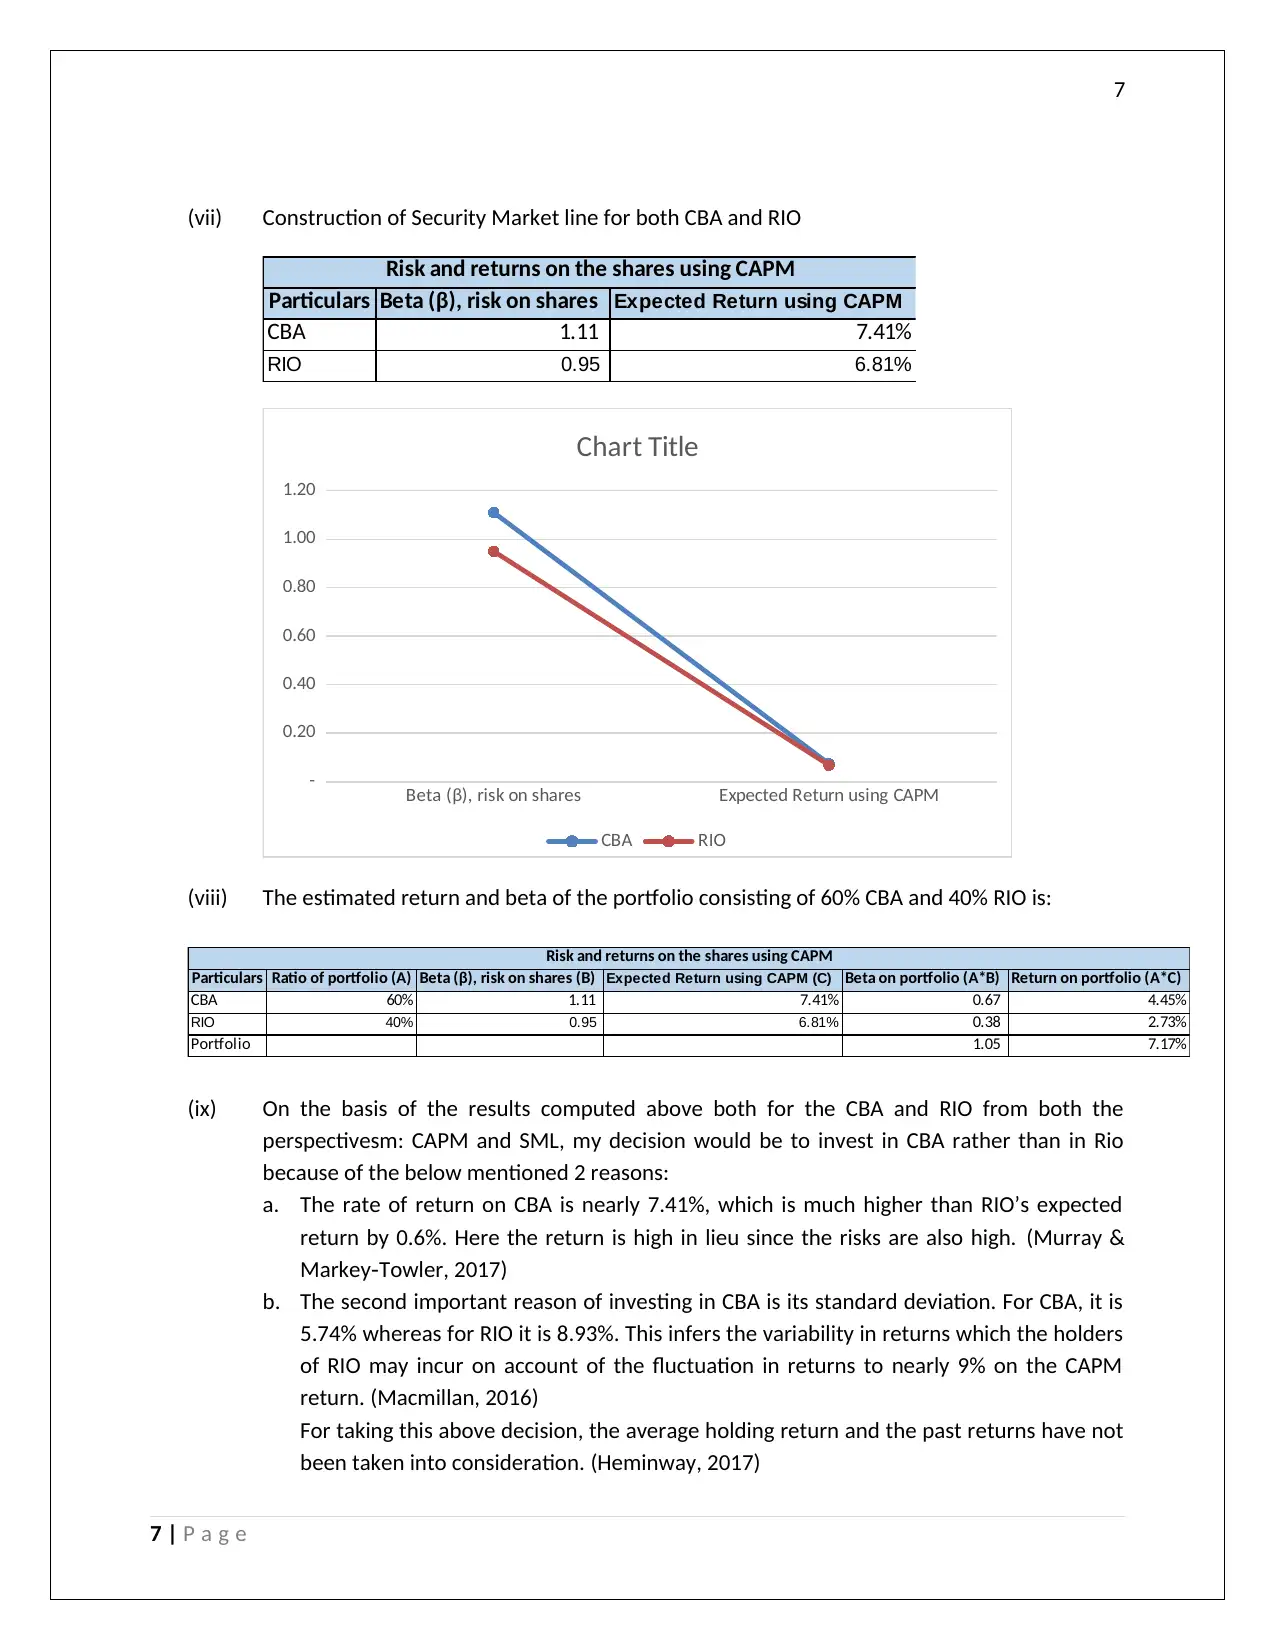
This report presents a detailed analysis of an investment portfolio, focusing on financial metrics and investment strategies. It includes the calculation of holding period returns, standard deviations, and the application of the Capital Asset Pricing Model (CAPM) and Security Market Line (SML) to assess risk and return. The report compares two investment options, CBA and RIO, and provides a rationale for investment decisions based on the computed returns and risks. The analysis considers the average monthly returns, annual holding period returns, and the variability of returns. The report references relevant academic sources to support its findings and conclusions. It is a valuable resource for students studying finance, providing practical insights into investment analysis and portfolio management.
Document Page
By student name
Professor
University
Date: 31 August 2017.
tabler-icon-diamond-filled.svg

Paraphrase This Document

Need a fresh take? Get an instant paraphrase of this document with our AI Paraphraser
Document Page
1
Contents
Question no 1…………………………………………………………………...2
Question no 3…………………………………………………………….....….4
Refrences.....……………………………………………………………….......8
1 | P a g e
Document Page
2
Assessment 2
Question 1
Particulars Amount in $
Amount invested at the end of each half year 800
Interest on the same for half year (800*10%*0.5) 40
Amount earned after each half year (800+40) 840
Total amount to be accumulated 10,000
Number of full payment (10000/840) 11.90
11 approx .
Last payment (10000-(11*840)) 760
Particulars Amount in $
Amount won in the lottery 200000
Amount taken away in cash 20000
Total amount invested (200000-20000) 180,000
Rate of interest on investment 10%
Interest (180000*10%*4) 72,000
Total amount after four years (180000+72000) 252,000
Total amount in each payment (252000/180) 1,400
Therefore size of each payment $1400
Particulars Amount in $
Amount deposited in the 1st year 4,000
Rate of compound interest (4000*5%) 200
Amount accumulated after 1 year (4000+200) 4,200
Amount after 2nd year (4200+(4200*(1+5/100))) 8,610
Proceeding like above in December 2017
she will have 59,669
Question a
Question b
Question c
2 | P a g e
Document Page
3
Particulars Amount in $
Amount recd. by Mary Tune at the end of each year 20000
No. of years for which she will receive the amount 10
Applicable rate of interest 6%
Interest on the principle portion (20000*6%) 1200
Amount at the end of each year (20000+1200) 21,200
Amount after ten years (21200*10) 212,000
Amount given to sell her future rights 150,000
This amount after investing for ten years
(150000+(150000*6%*10)) 240,000
As the amount given is more, so she should sell her future rights.
Particulars Amount in $
Let X be the cost of annuity
No. of years of annuity 10
Increase in the annuity amount each year 10%
Amount of annuity after 10 years 2x
Interest on annuity each year 12%
Amount on $1000 at 12 % rate (1000+(1000*12%)) 1,120
Amount after 10 years (1120*10) 11,200
Total cost of annuity after 10 years
2x 11,200
x 5,600
Question d
Question e
3 | P a g e
tabler-icon-diamond-filled.svg

Paraphrase This Document

Need a fresh take? Get an instant paraphrase of this document with our AI Paraphraser
Document Page
4
Question no 3
(i) The graph together with the computations is as follows:
The Formulae for holding period return mathematically is {(Closing price – opening price) /
opening price} * 100 (Jefferson, 2017)
2016
Months Opening Closing Holding period Return Opening Closing Holding period Return Opening Closing Holding period Return
Jan 84.46 78.67 -6.86% 44.63 39.13 -12.32% 5,322.79 5056.60 -5.00%
Feb 78.67 70.14 -10.84% 39.13 40.28 2.94% 5,056.60 4947.95 -2.15%
Mar 70.14 74.92 6.81% 40.28 42.69 5.98% 4,947.95 5151.79 4.12%
Apr 74.92 73.89 -1.37% 42.69 51.55 20.75% 5,151.79 5316.00 3.19%
May 73.89 77.43 4.79% 51.55 44.69 -13.31% 5,316.00 5447.80 2.48%
Jun 77.43 74.37 -3.95% 44.69 45.50 1.81% 5,447.80 5310.41 -2.52%
Jul 74.37 77.35 4.01% 45.5 49.56 8.92% 5,310.41 5643.96 6.28%
Aug 77.35 71.81 -7.16% 49.56 47.60 -3.95% 5,643.96 5529.41 -2.03%
Sep 71.81 72.40 0.82% 47.6 51.61 8.42% 5,529.41 5525.15 -0.08%
Oct 72.4 73.39 1.37% 51.61 54.18 4.98% 5,525.15 5402.44 -2.22%
Nov 73.39 78.65 7.17% 54.18 57.75 6.59% 5,402.44 5502.38 1.85%
Dec 78.65 82.41 4.78% 57.75 59.90 3.72% 5,502.38 5719.14 3.94%
Returns on Shares
CBA RIO MKT
Jan Feb Mar Apr May Jun Jul Aug Sep Oct Nov Dec
-20.00%
-15.00%
-10.00%
-5.00%
0.00%
5.00%
10.00%
15.00%
20.00%
25.00%
Chart Title
Returns on Shares CBA Holding period Return Returns on Shares RIO Holding period Return
Returns on Shares MKT Holding period Return
4 | P a g e
Document Page
5
(ii) The average monthly return on each of the investments and overall for each month is as
follows:
2016 CBA RIO MKT
Months Holding period Return Holding period Return Holding period Return
Jan -6.86% -12.32% -5.00%
Feb -10.84% 2.94% -2.15%
Mar 6.81% 5.98% 4.12%
Apr -1.37% 20.75% 3.19%
May 4.79% -13.31% 2.48%
Jun -3.95% 1.81% -2.52%
Jul 4.01% 8.92% 6.28%
Aug -7.16% -3.95% -2.03%
Sep 0.82% 8.42% -0.08%
Oct 1.37% 4.98% -2.22%
Nov 7.17% 6.59% 1.85%
Dec 4.78% 3.72% 3.94%
Average monthy Returns on Shares
(iii) The annual holding period return on each of the investments is mentioned below:
Year Opening Closing Holding period Return Opening Closing Holding period Return Opening Closing Holding period Return
2016 84.46 82.41 -2.43% 44.63 59.90 34.21% 5322.79 5719.14 7.45%
Returns on Shares
CBA RIO MKT
(iv) Calculation of the standard deviation of the monthly rates of return for both the
investments.
2016
Months Holding period Return (X-mean)^2 Holding period Return (Y-mean)^2 Holding period Return (Z-mean)^2
Jan -6.86% 0.46% -12.32% 2.31% -5.00% 0.32%
Feb -10.84% 1.17% 2.94% 0.00% -2.15% 0.08%
Mar 6.81% 0.47% 5.98% 0.10% 4.12% 0.12%
Apr -1.37% 0.02% 20.75% 3.20% 3.19% 0.06%
May 4.79% 0.23% -13.31% 2.62% 2.48% 0.03%
Jun -3.95% 0.15% 1.81% 0.01% -2.52% 0.10%
Jul 4.01% 0.16% 8.92% 0.37% 6.28% 0.32%
Aug -7.16% 0.51% -3.95% 0.47% -2.03% 0.07%
Sep 0.82% 0.01% 8.42% 0.31% -0.08% 0.01%
Oct 1.37% 0.02% 4.98% 0.04% -2.22% 0.08%
Nov 7.17% 0.52% 6.59% 0.14% 1.85% 0.01%
Dec 4.78% 0.23% 3.72% 0.01% 3.94% 0.11%
Average or mean -0.04% 2.88% 0.65%
Average of deviation 0.33% 0.80% 0.11%
Standard Deviation 5.74% 8.93% 3.31%
CBA (X) RIO (Y) MKT (Y)
Standard deviation of the monthly rates of return for each share and the market
5 | P a g e
Document Page
6
(v) Relationship between risk and return via graphical representation.
Particulars CBA RIO MKT
Standard Deviation 5.74% 8.93% 3.31%
Holding period return -2.43% 34.21% 7.45%
Risk and returns on the shares
CBA RIO MKT
-5.00%
0.00%
5.00%
10.00%
15.00%
20.00%
25.00%
30.00%
35.00%
40.00%
Chart Title
Standard Deviation Holding period return
(vi) Calculation of expected rate of return on both the shares using CAPM:
Particulars Rf Rm β Rf + β(Rm - Rf)
CBA 3.25% 7% 1.11 7.41%
RIO 3.25% 7% 0.95 6.81%
Calculation of expected returns
Capital Asset Pricing Model
Expected Return ( R ) = Rf + β(Rm - Rf)
Where, Rf= 10 year givernment bond interest rate
Rm = rate of market interest
β = Risk on the security
6 | P a g e
tabler-icon-diamond-filled.svg

Paraphrase This Document

Need a fresh take? Get an instant paraphrase of this document with our AI Paraphraser
Document Page
7
(vii) Construction of Security Market line for both CBA and RIO
Particulars Beta (β), risk on shares Expected Return using CAPM
CBA 1.11 7.41%
RIO 0.95 6.81%
Risk and returns on the shares using CAPM
Beta (β), risk on shares Expected Return using CAPM
-
0.20
0.40
0.60
0.80
1.00
1.20
Chart Title
CBA RIO
(viii) The estimated return and beta of the portfolio consisting of 60% CBA and 40% RIO is:
Particulars Ratio of portfolio (A) Beta (β), risk on shares (B) Expected Return using CAPM (C) Beta on portfolio (A*B) Return on portfolio (A*C)
CBA 60% 1.11 7.41% 0.67 4.45%
RIO 40% 0.95 6.81% 0.38 2.73%
Portfolio 1.05 7.17%
Risk and returns on the shares using CAPM
(ix) On the basis of the results computed above both for the CBA and RIO from both the
perspectivesm: CAPM and SML, my decision would be to invest in CBA rather than in Rio
because of the below mentioned 2 reasons:
a. The rate of return on CBA is nearly 7.41%, which is much higher than RIO’s expected
return by 0.6%. Here the return is high in lieu since the risks are also high. (Murray &
Markey Towler, 2017)
b. The second important reason of investing in CBA is its standard deviation. For CBA, it is
5.74% whereas for RIO it is 8.93%. This infers the variability in returns which the holders
of RIO may incur on account of the fluctuation in returns to nearly 9% on the CAPM
return. (Macmillan, 2016)
For taking this above decision, the average holding return and the past returns have not
been taken into consideration. (Heminway, 2017)
7 | P a g e
Document Page
8
References
Heminway, J. (2017). Shareholder Wealth Maximization as a Function of Statutes, Decisional Law, and
Organic Documents. SSRN, 1-35.
Jefferson, M. (2017). Energy, Complexity and Wealth Maximization, R. Ayres. Springer, Switzerland .
Technological Forecasting and Social Change, 353-354.
Macmillan, P. (2016). Thomas Klikauer: Hegel’s Moral Corporation. Journal of Business Ethics, 302.
Murray, C., & Markey Towler, B. (2017). A Theory of Return-Seeking Firms. SSRN, 1-14.
8 | P a g e
chevron_up_icon
1 out of 9
circle_padding
hide_on_mobile
zoom_out_icon
[object Object]