Investment Management Report: Risk, Return, and Portfolio Optimization

Verified

Added on Ā 2023/01/06

|16
|2637
|29
Report
AI Summary
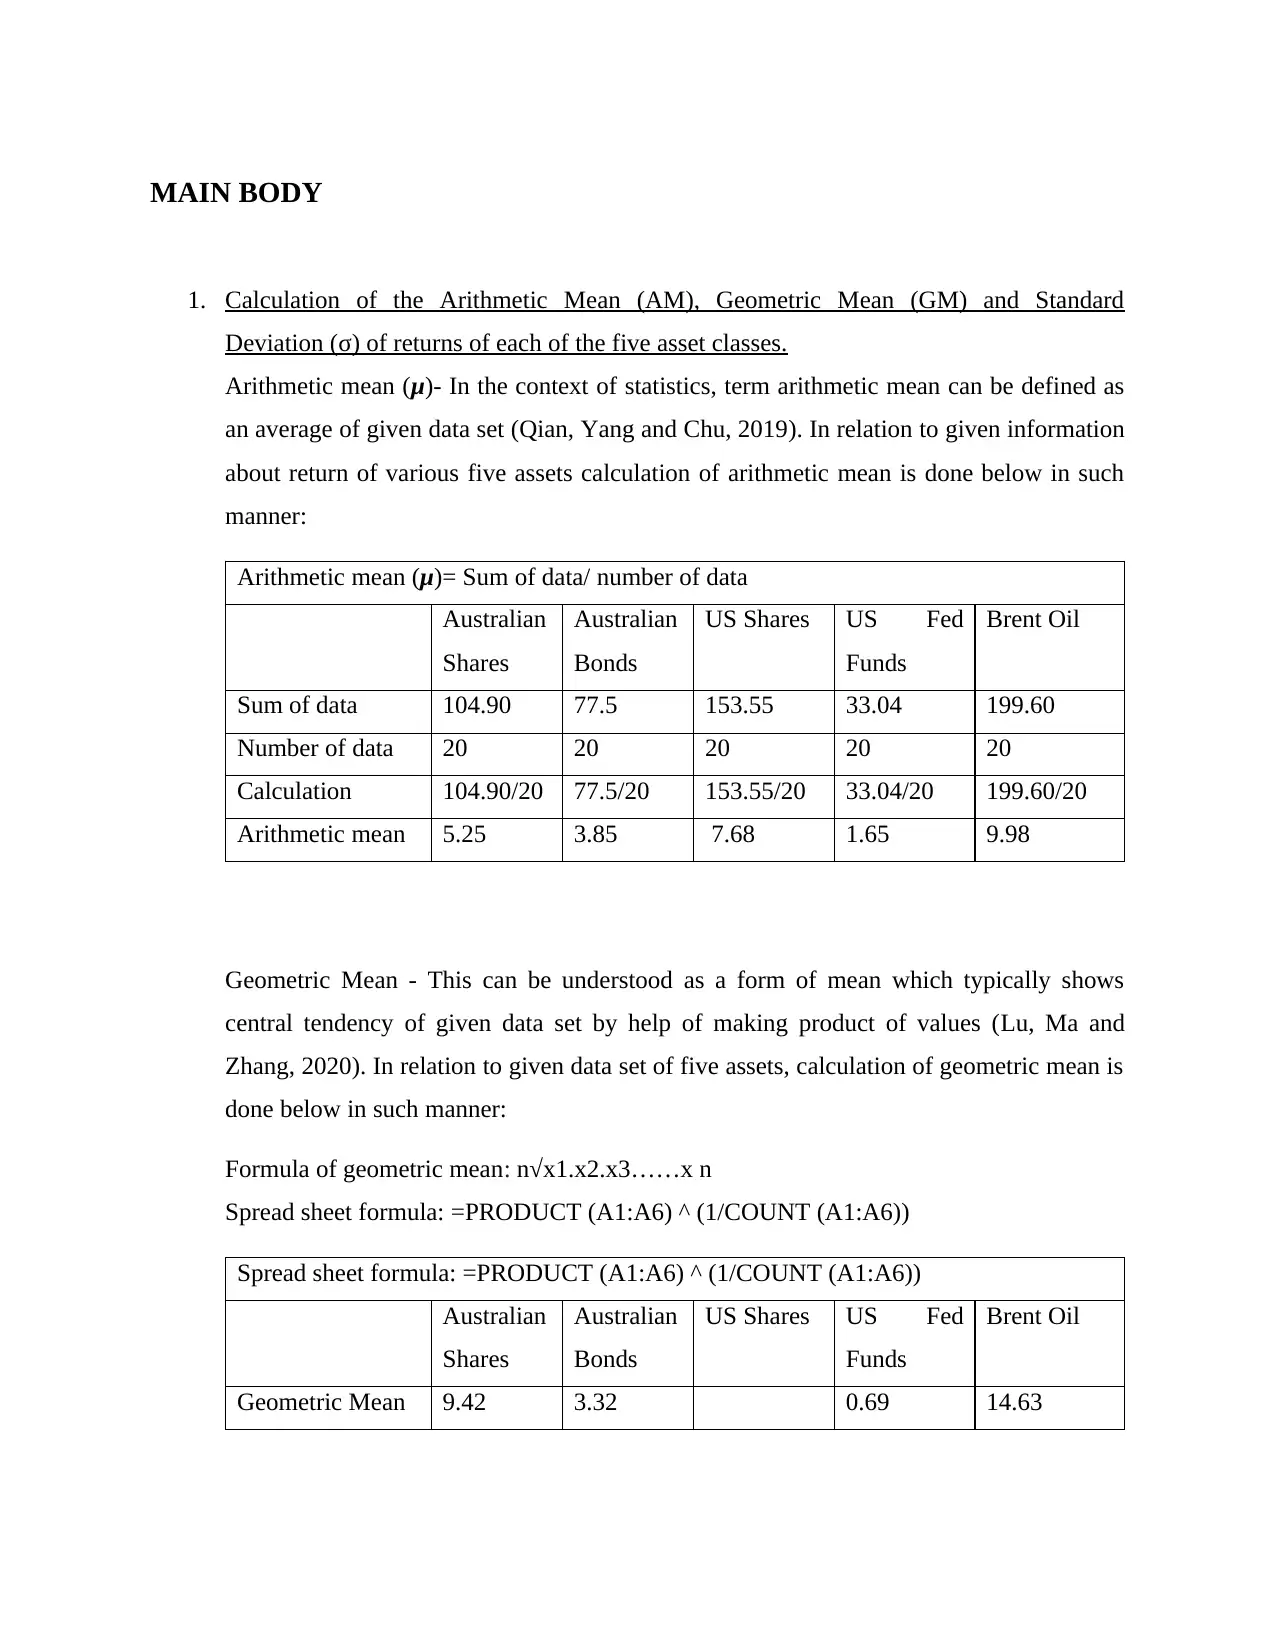
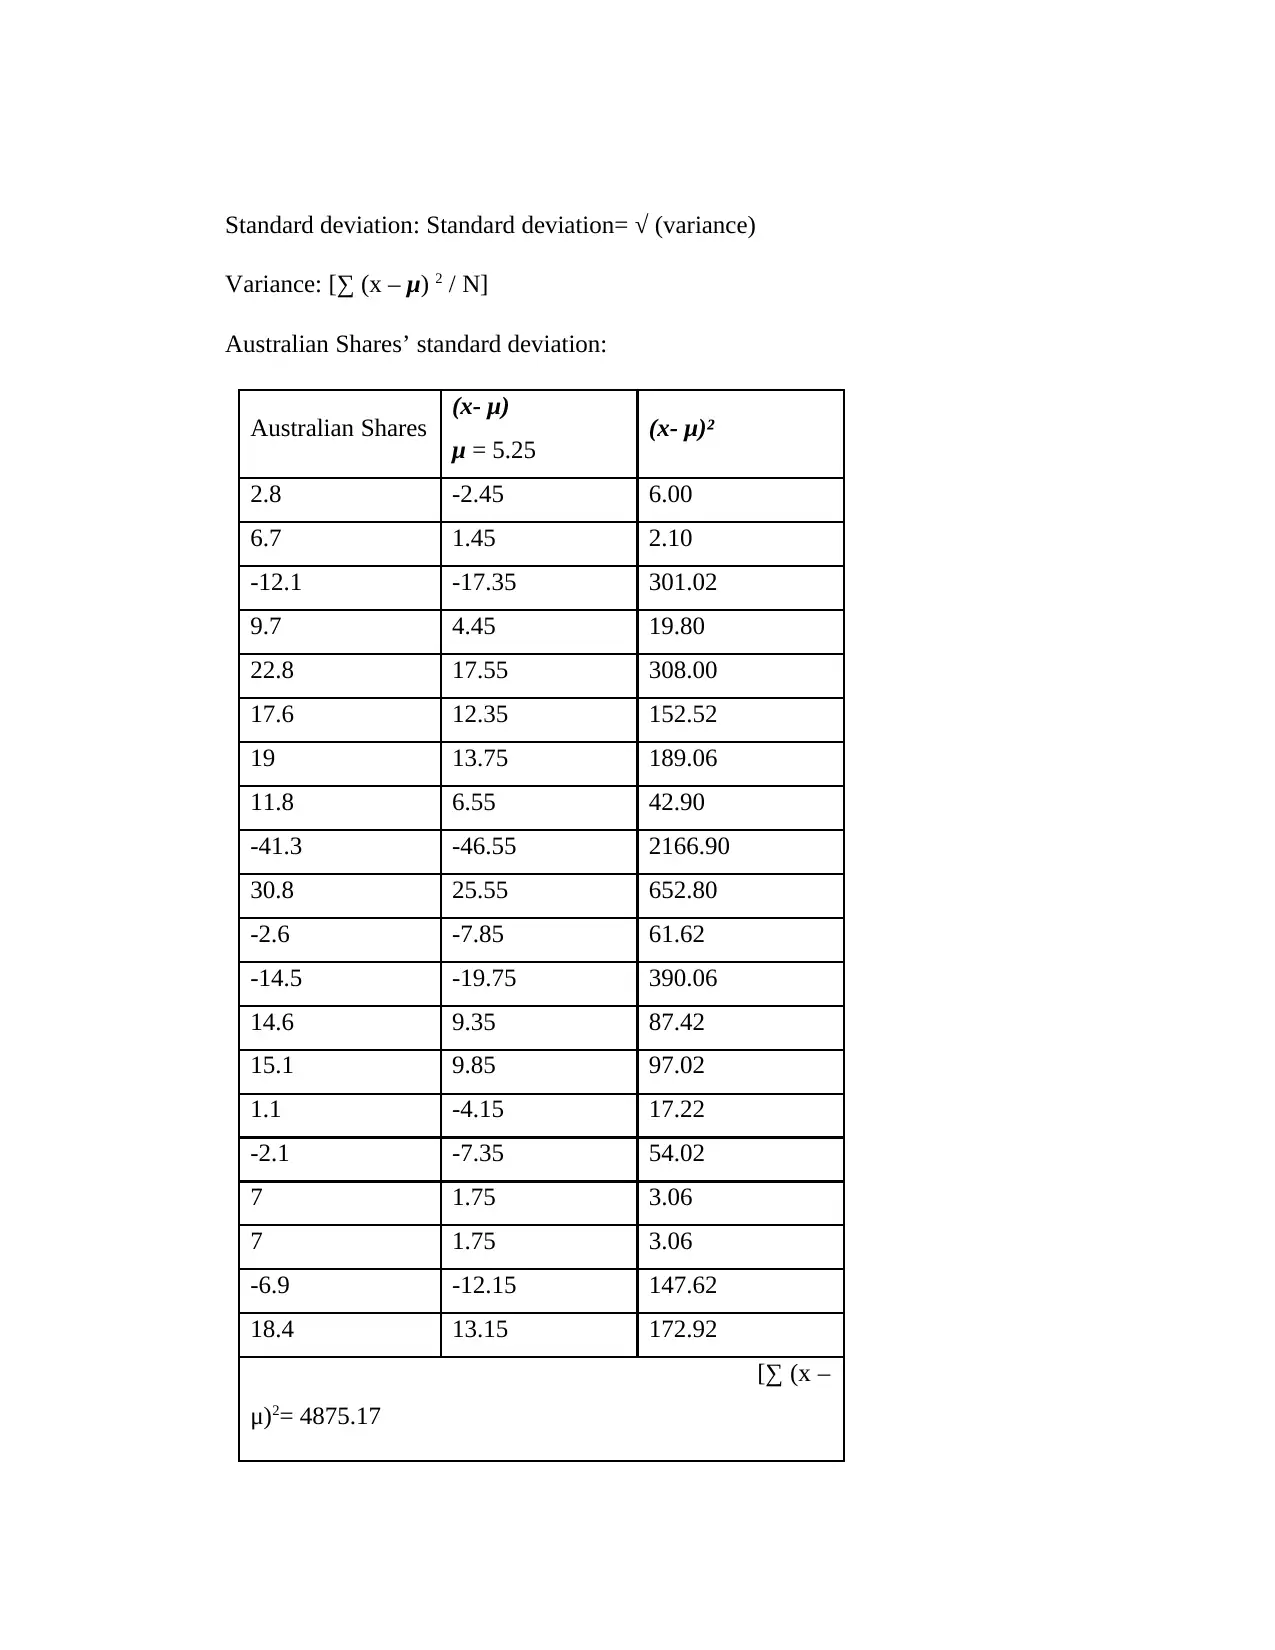
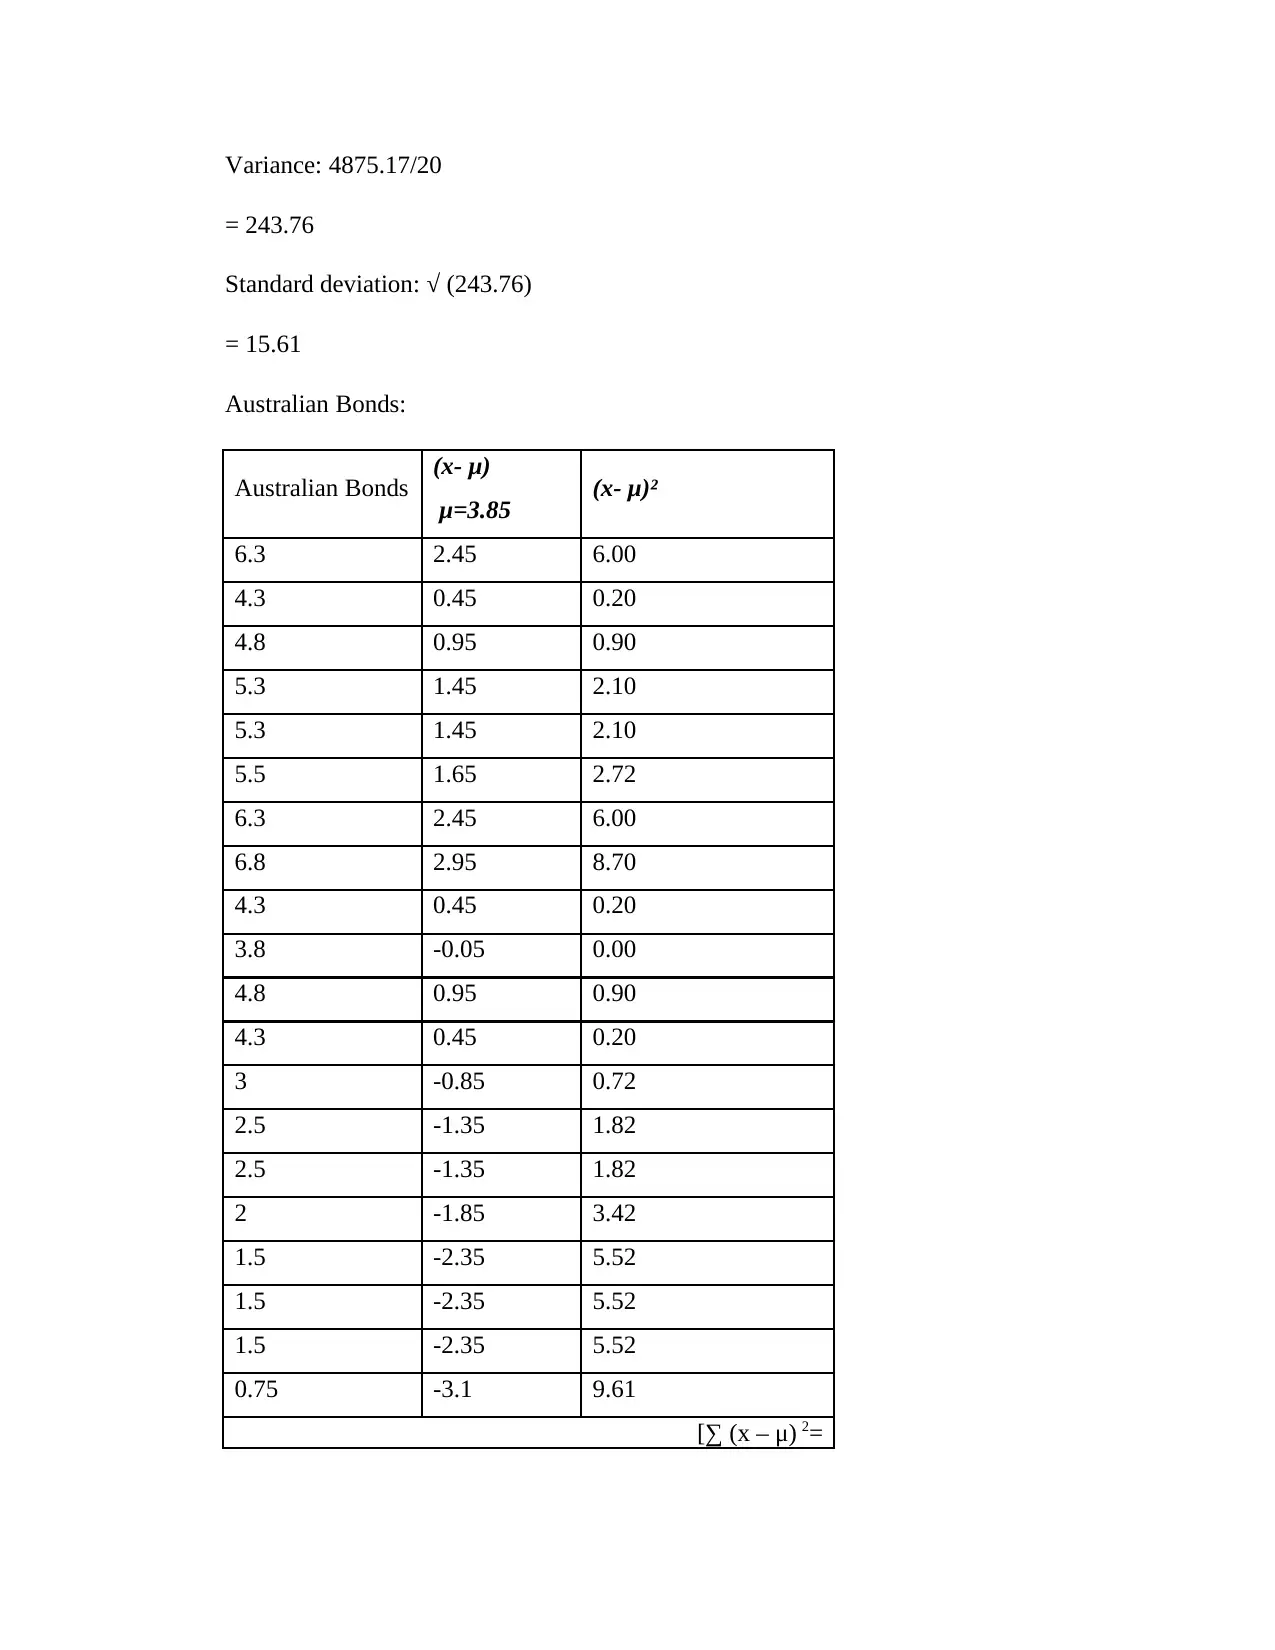
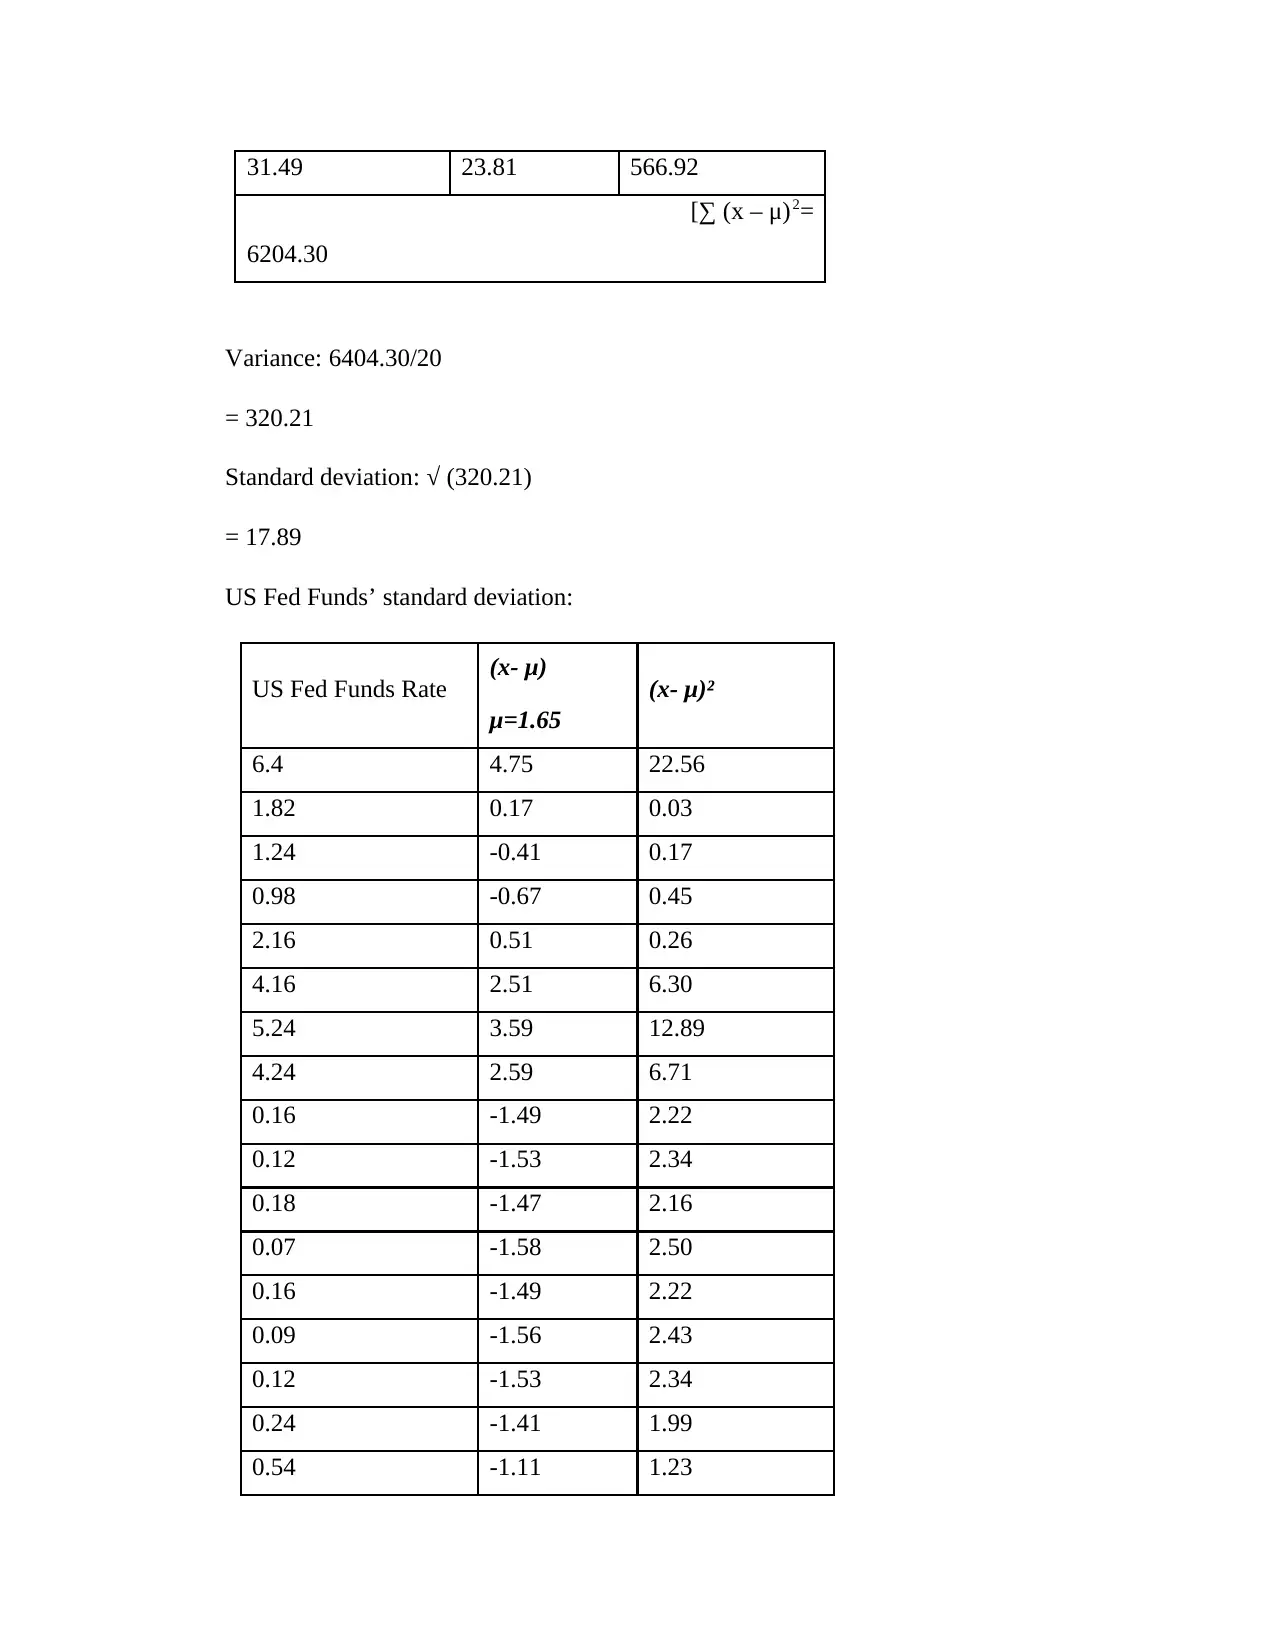
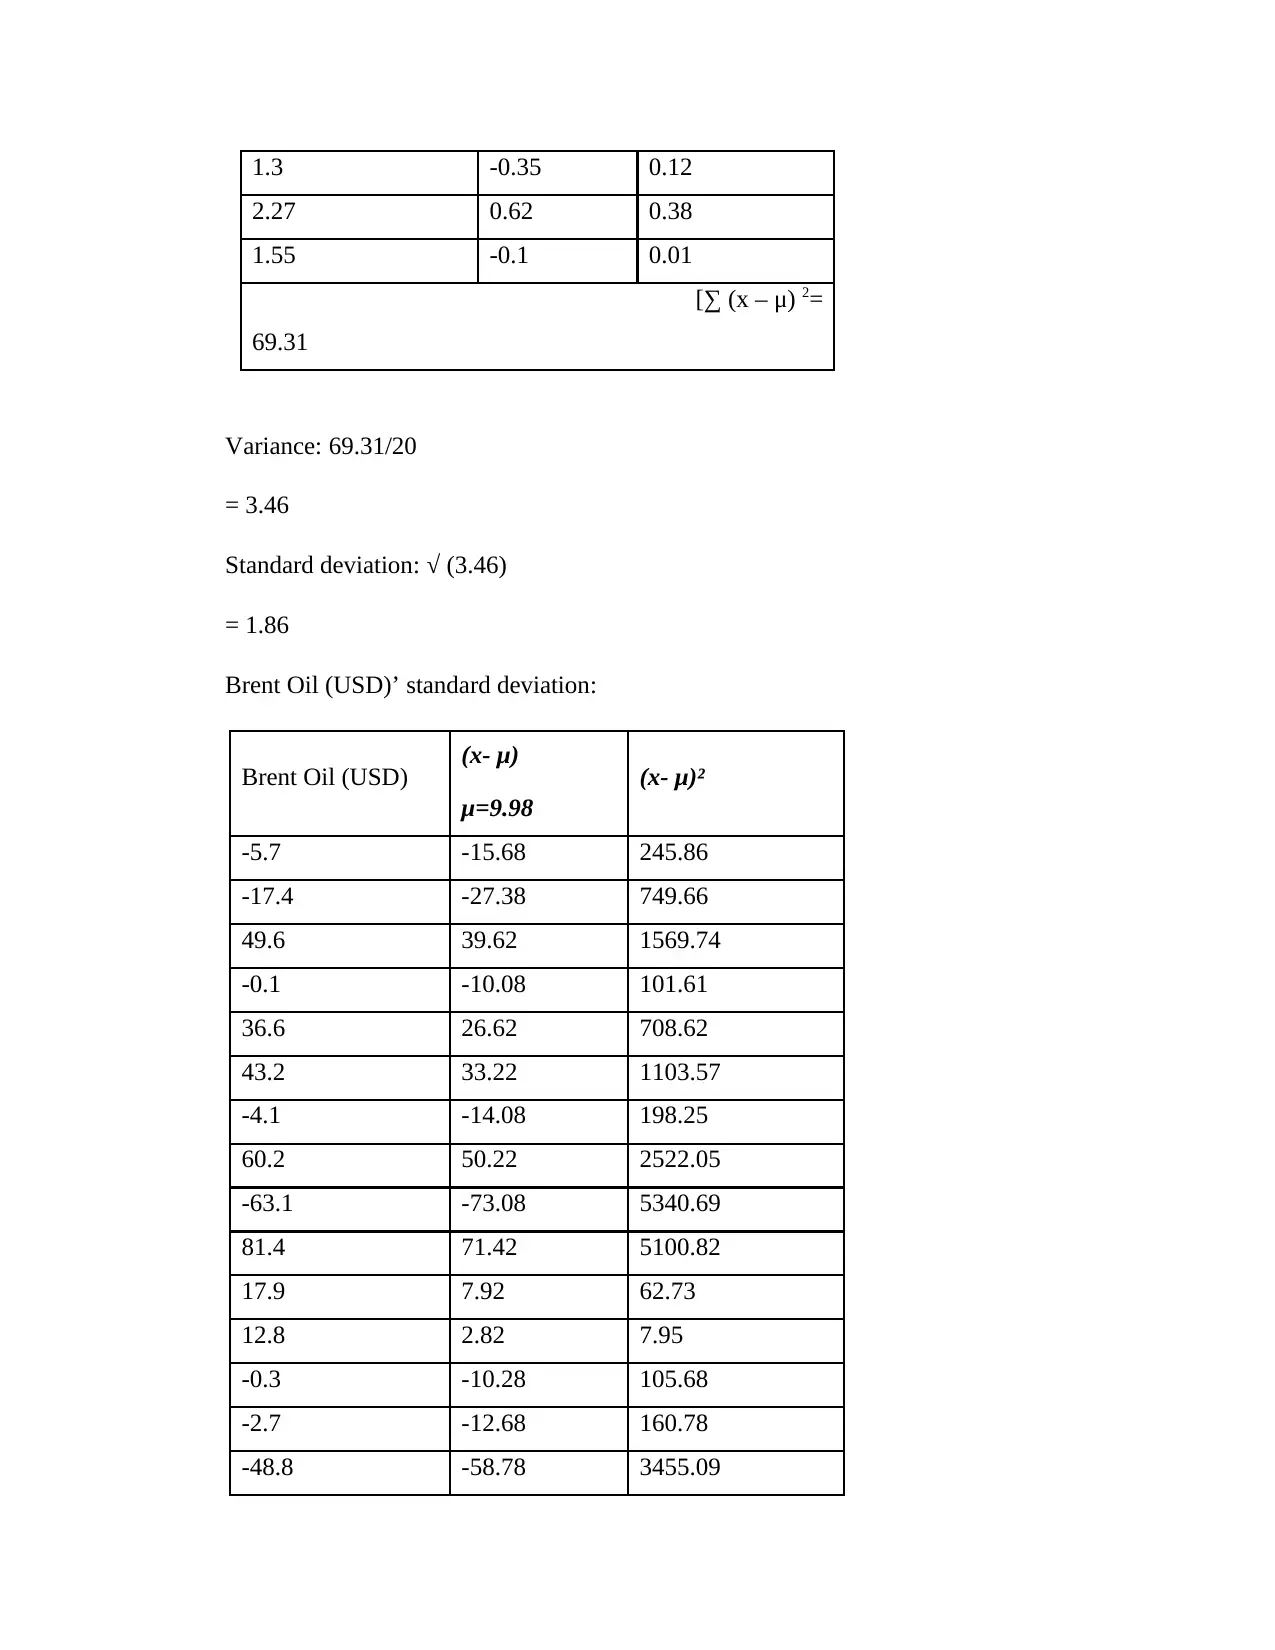
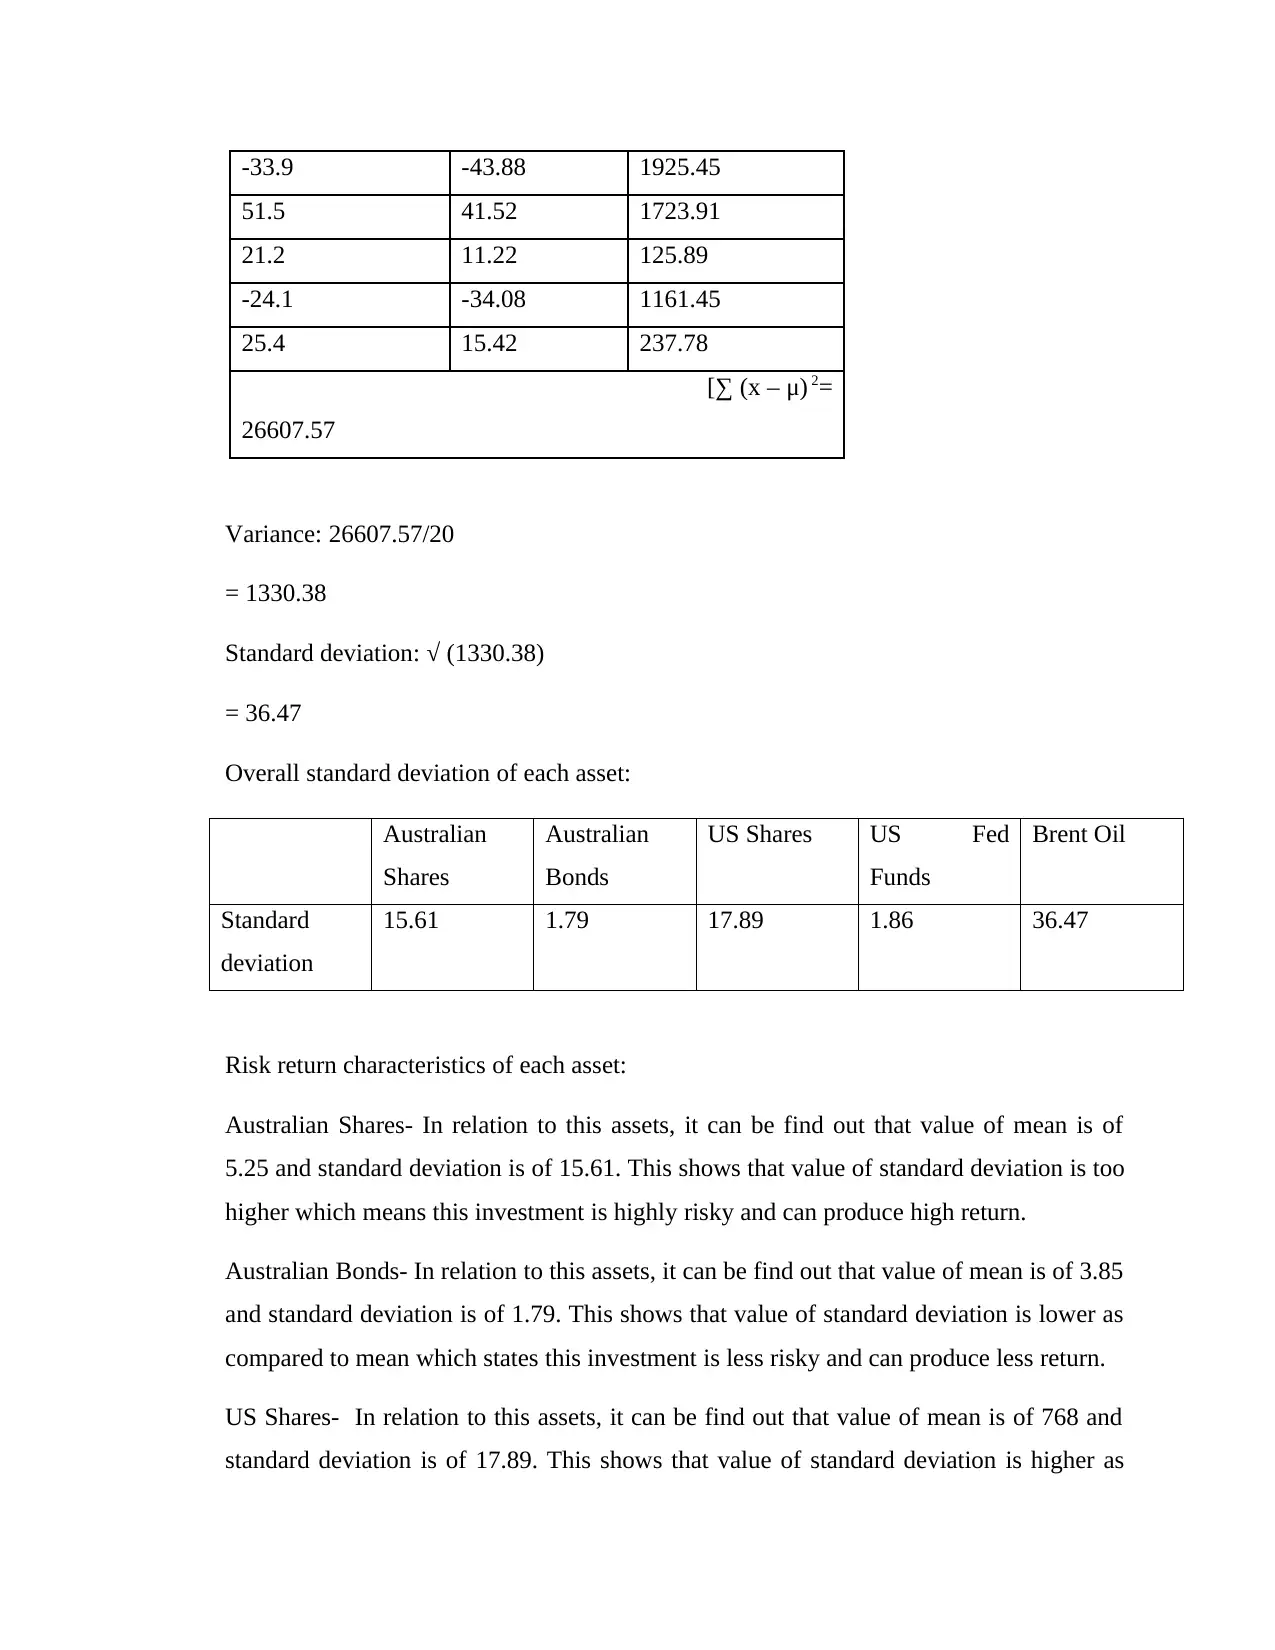
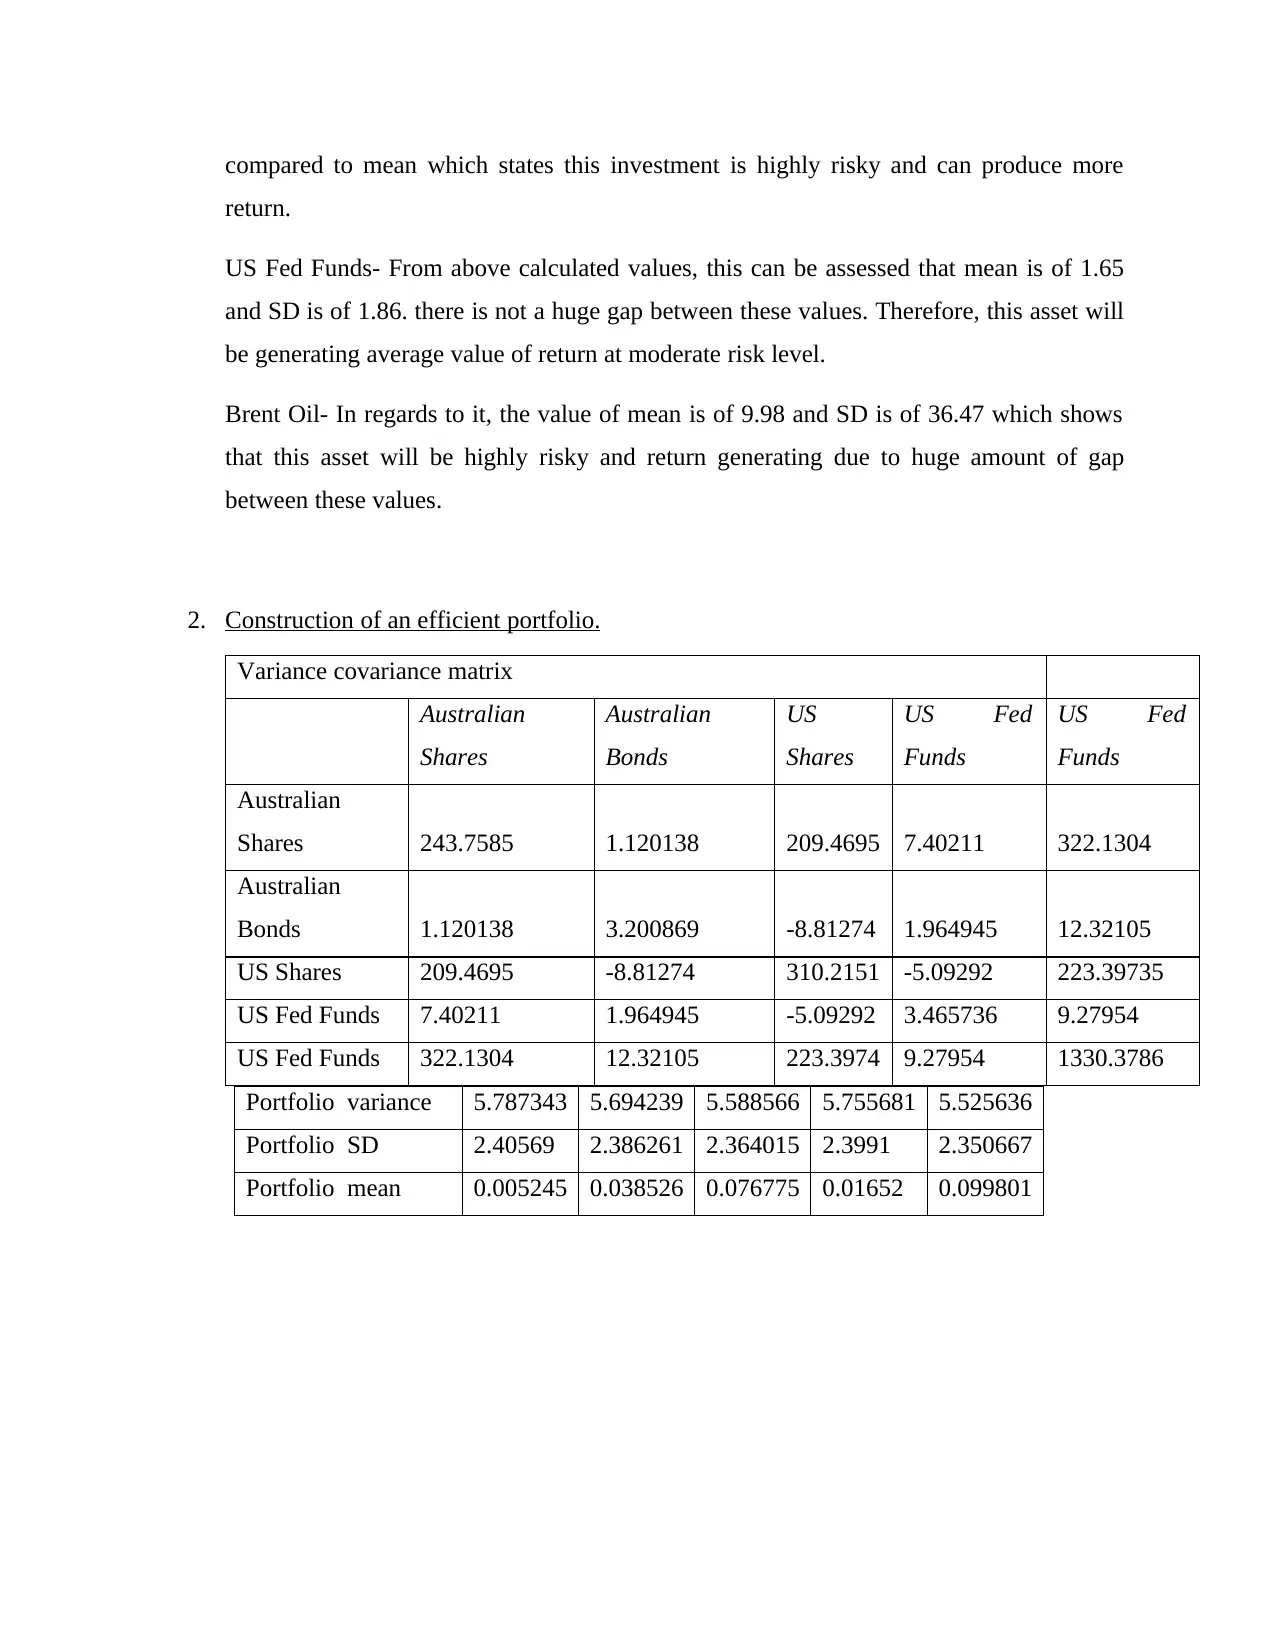
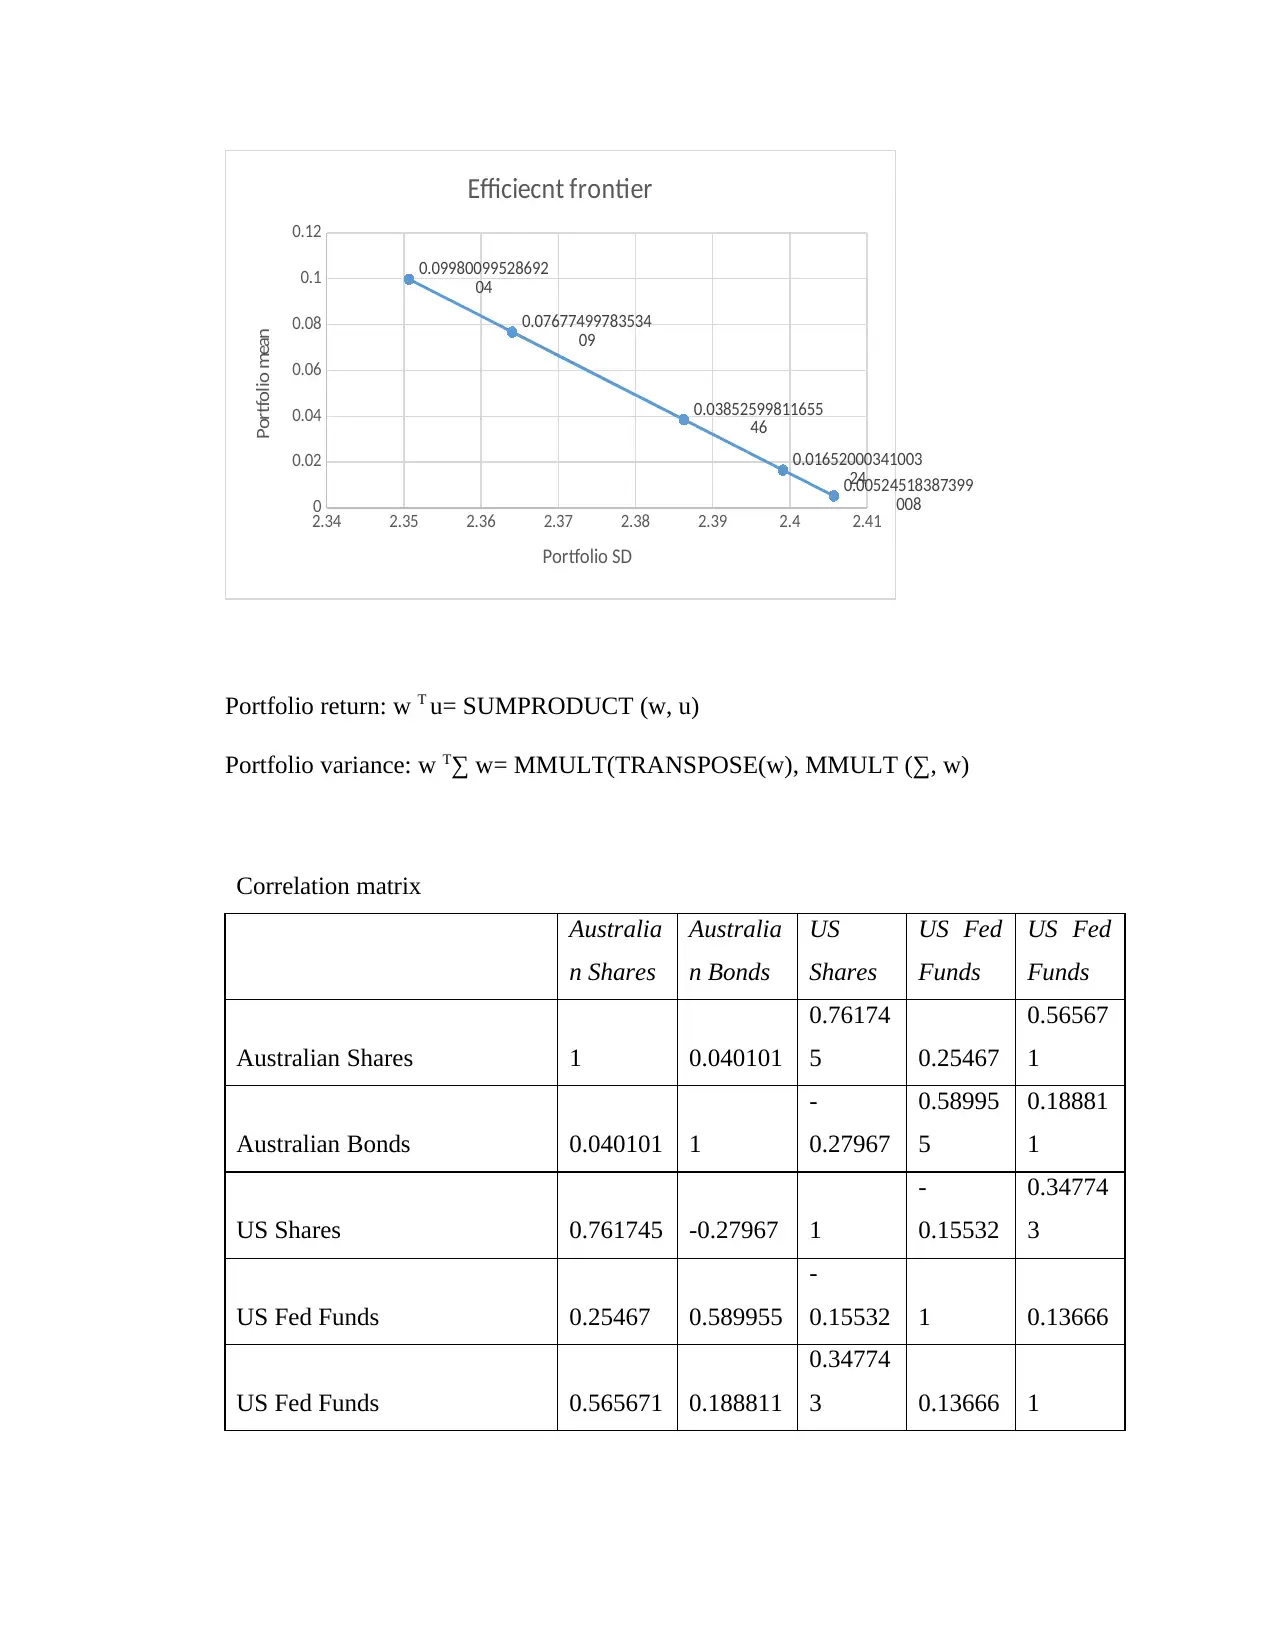
This report provides a detailed analysis of investment management principles, focusing on portfolio construction, risk-return characteristics, and the application of Modern Portfolio Theory (MPT). The report begins with an executive summary followed by the calculation of arithmetic mean (AM), geometric mean (GM), and standard deviation (σ) for five different asset classes: Australian Shares, Australian Bonds, US Shares, US Fed Funds, and Brent Oil. The analysis includes a variance-covariance matrix and the construction of an efficient portfolio, illustrating the relationship between risk and return. The report then delves into a discussion of MPT models, including the Markowitz mean-variance model and its limitations, before concluding with a discussion on diversification failure and its impact on portfolio performance. The findings highlight the importance of asset allocation in achieving high financial performance and minimizing risks, as demonstrated through the analysis of various asset classes.
Document Page
Investment management
tabler-icon-diamond-filled.svg

Paraphrase This Document

Need a fresh take? Get an instant paraphrase of this document with our AI Paraphraser
Document Page
Contents
EXECUTIVE SUMMARY.......................................................................................................................3
MAIN BODY.............................................................................................................................................4
1. Calculation of the Arithmetic Mean (AM), Geometric Mean (GM) and Standard Deviation (σ) of
returns of each of the five asset classes....................................................................................................4
2. Construction of an efficient portfolio.............................................................................................11
3. Discussion on Modern Portfolio Theory (MPT) models................................................................13
CONCLUSION........................................................................................................................................16
REFERENCES........................................................................................................................................17
Document Page
EXECUTIVE SUMMARY
The report abstracts about different aspects regarding to analysis of given assets. In first
and second question, information about calculation of different kinds of mean, standard deviation
is included in order to assess risk-return features. In the end part of report information related to
various types of modern portfolio theories is mentioned along with impact of diversification is
also summarized.
Document Page
MAIN BODY
1. Calculation of the Arithmetic Mean (AM), Geometric Mean (GM) and Standard
Deviation (σ) of returns of each of the five asset classes.
Arithmetic mean (μ)- In the context of statistics, term arithmetic mean can be defined as
an average of given data set (Qian, Yang and Chu, 2019). In relation to given information
about return of various five assets calculation of arithmetic mean is done below in such
manner:
Arithmetic mean (μ)= Sum of data/ number of data
Australian
Shares
Australian
Bonds
US Shares US Fed
Funds
Brent Oil
Sum of data 104.90 77.5 153.55 33.04 199.60
Number of data 20 20 20 20 20
Calculation 104.90/20 77.5/20 153.55/20 33.04/20 199.60/20
Arithmetic mean 5.25 3.85 7.68 1.65 9.98
Geometric Mean - This can be understood as a form of mean which typically shows
central tendency of given data set by help of making product of values (Lu, Ma and
Zhang, 2020). In relation to given data set of five assets, calculation of geometric mean is
done below in such manner:
Formula of geometric mean: n√x1.x2.x3……x n
Spread sheet formula: =PRODUCT (A1:A6) ^ (1/COUNT (A1:A6))
Australian
Shares
Australian
Bonds
US Shares US Fed
Funds
Brent Oil
Geometric Mean 9.42 3.32 0.69 14.63
tabler-icon-diamond-filled.svg

Paraphrase This Document

Need a fresh take? Get an instant paraphrase of this document with our AI Paraphraser
Document Page
Standard deviation: Standard deviation= √ (variance)
Variance: [āˆ‘ (x – μ) 2 / N]
Australian Shares’ standard deviation:
Australian Shares (x- μ) (x- μ)²
μ = 5.25
2.8 -2.45 6.00
6.7 1.45 2.10
-12.1 -17.35 301.02
9.7 4.45 19.80
22.8 17.55 308.00
17.6 12.35 152.52
19 13.75 189.06
11.8 6.55 42.90
-41.3 -46.55 2166.90
30.8 25.55 652.80
-2.6 -7.85 61.62
-14.5 -19.75 390.06
14.6 9.35 87.42
15.1 9.85 97.02
1.1 -4.15 17.22
-2.1 -7.35 54.02
7 1.75 3.06
7 1.75 3.06
-6.9 -12.15 147.62
18.4 13.15 172.92
[āˆ‘ (x –
μ)2= 4875.17
Document Page
Variance: 4875.17/20
= 243.76
Standard deviation: √ (243.76)
= 15.61
Australian Bonds:
Australian Bonds (x- μ) (x- μ)²
μ=3.85
6.3 2.45 6.00
4.3 0.45 0.20
4.8 0.95 0.90
5.3 1.45 2.10
5.3 1.45 2.10
5.5 1.65 2.72
6.3 2.45 6.00
6.8 2.95 8.70
4.3 0.45 0.20
3.8 -0.05 0.00
4.8 0.95 0.90
4.3 0.45 0.20
3 -0.85 0.72
2.5 -1.35 1.82
2.5 -1.35 1.82
2 -1.85 3.42
1.5 -2.35 5.52
1.5 -2.35 5.52
1.5 -2.35 5.52
0.75 -3.1 9.61
[āˆ‘ (x – μ) 2=
Document Page
64.02
Variance: 64.02/20
= 3.201
Standard deviation: √ (3.201)
= 1.79
US Shares’ standard deviation:
US Shares (x- μ) (x- μ)²
μ=7.68
-9.1 -16.78 281.57
-11.89 -19.57 382.98
-22.1 -29.78 886.85
28.68 21 441.00
10.88 3.2 10.24
4.91 -2.77 7.67
15.79 8.11 65.77
5.49 -2.19 4.80
-37 -44.68 1996.30
26.46 18.78 352.69
15.06 7.38 54.46
2.11 -5.57 31.02
16 8.32 69.22
32.39 24.71 610.58
13.69 6.01 36.12
1.38 -6.3 39.69
11.96 4.28 18.32
21.83 14.15 200.22
-4.48 -12.16 147.87
tabler-icon-diamond-filled.svg

Paraphrase This Document

Need a fresh take? Get an instant paraphrase of this document with our AI Paraphraser
Document Page
31.49 23.81 566.92
[āˆ‘ (x – μ)2=
6204.30
Variance: 6404.30/20
= 320.21
Standard deviation: √ (320.21)
= 17.89
US Fed Funds’ standard deviation:
US Fed Funds Rate (x- μ) (x- μ)²
μ=1.65
6.4 4.75 22.56
1.82 0.17 0.03
1.24 -0.41 0.17
0.98 -0.67 0.45
2.16 0.51 0.26
4.16 2.51 6.30
5.24 3.59 12.89
4.24 2.59 6.71
0.16 -1.49 2.22
0.12 -1.53 2.34
0.18 -1.47 2.16
0.07 -1.58 2.50
0.16 -1.49 2.22
0.09 -1.56 2.43
0.12 -1.53 2.34
0.24 -1.41 1.99
0.54 -1.11 1.23
Document Page
1.3 -0.35 0.12
2.27 0.62 0.38
1.55 -0.1 0.01
[āˆ‘ (x – μ) 2=
69.31
Variance: 69.31/20
= 3.46
Standard deviation: √ (3.46)
= 1.86
Brent Oil (USD)’ standard deviation:
Brent Oil (USD) (x- μ) (x- μ)²
μ=9.98
-5.7 -15.68 245.86
-17.4 -27.38 749.66
49.6 39.62 1569.74
-0.1 -10.08 101.61
36.6 26.62 708.62
43.2 33.22 1103.57
-4.1 -14.08 198.25
60.2 50.22 2522.05
-63.1 -73.08 5340.69
81.4 71.42 5100.82
17.9 7.92 62.73
12.8 2.82 7.95
-0.3 -10.28 105.68
-2.7 -12.68 160.78
-48.8 -58.78 3455.09
Document Page
-33.9 -43.88 1925.45
51.5 41.52 1723.91
21.2 11.22 125.89
-24.1 -34.08 1161.45
25.4 15.42 237.78
[āˆ‘ (x – μ) 2=
26607.57
Variance: 26607.57/20
= 1330.38
Standard deviation: √ (1330.38)
= 36.47
Overall standard deviation of each asset:
Australian
Shares
Australian
Bonds
US Shares US Fed
Funds
Brent Oil
Standard
deviation
15.61 1.79 17.89 1.86 36.47
Risk return characteristics of each asset:
Australian Shares- In relation to this assets, it can be find out that value of mean is of
5.25 and standard deviation is of 15.61. This shows that value of standard deviation is too
higher which means this investment is highly risky and can produce high return.
Australian Bonds- In relation to this assets, it can be find out that value of mean is of 3.85
and standard deviation is of 1.79. This shows that value of standard deviation is lower as
compared to mean which states this investment is less risky and can produce less return.
US Shares- In relation to this assets, it can be find out that value of mean is of 768 and
standard deviation is of 17.89. This shows that value of standard deviation is higher as
tabler-icon-diamond-filled.svg

Paraphrase This Document

Need a fresh take? Get an instant paraphrase of this document with our AI Paraphraser
Document Page
compared to mean which states this investment is highly risky and can produce more
return.
US Fed Funds- From above calculated values, this can be assessed that mean is of 1.65
and SD is of 1.86. there is not a huge gap between these values. Therefore, this asset will
be generating average value of return at moderate risk level.
Brent Oil- In regards to it, the value of mean is of 9.98 and SD is of 36.47 which shows
that this asset will be highly risky and return generating due to huge amount of gap
between these values.
2. Construction of an efficient portfolio.
Portfolio variance 5.787343 5.694239 5.588566 5.755681 5.525636
Portfolio SD 2.40569 2.386261 2.364015 2.3991 2.350667
Portfolio mean 0.005245 0.038526 0.076775 0.01652 0.099801
Variance covariance matrix
Australian
Shares
Australian
Bonds
US
Shares
US Fed
Funds
US Fed
Funds
Australian
Shares 243.7585 1.120138 209.4695 7.40211 322.1304
Australian
Bonds 1.120138 3.200869 -8.81274 1.964945 12.32105
US Shares 209.4695 -8.81274 310.2151 -5.09292 223.39735
US Fed Funds 7.40211 1.964945 -5.09292 3.465736 9.27954
US Fed Funds 322.1304 12.32105 223.3974 9.27954 1330.3786
Document Page
2.34 2.35 2.36 2.37 2.38 2.39 2.4 2.41
0
0.02
0.04
0.06
0.08
0.1
0.12
0.00524518387399
008
0.03852599811655
46
0.07677499783534
09
0.01652000341003
24
0.09980099528692
04
Efficiecnt frontier
Portfolio SD
Portfolio mean
Portfolio return: w T u= SUMPRODUCT (w, u)
Portfolio variance: w Tāˆ‘ w= MMULT(TRANSPOSE(w), MMULT (āˆ‘, w)
Correlation matrix
Australia
n Shares
Australia
n Bonds
US
Shares
US Fed
Funds
US Fed
Funds
Australian Shares 1 0.040101
0.76174
5 0.25467
0.56567
1
Australian Bonds 0.040101 1
-
0.27967
0.58995
5
0.18881
1
US Shares 0.761745 -0.27967 1
-
0.15532
0.34774
3
US Fed Funds 0.25467 0.589955
-
0.15532 1 0.13666
US Fed Funds 0.565671 0.188811
0.34774
3 0.13666 1
chevron_up_icon
1 out of 16
circle_padding
hide_on_mobile
zoom_out_icon
[object Object]