Investment Analysis Project: Portfolio Optimization and Analysis

Verified

Added on  2020/05/11

|4
|690
|63
Project
AI Summary
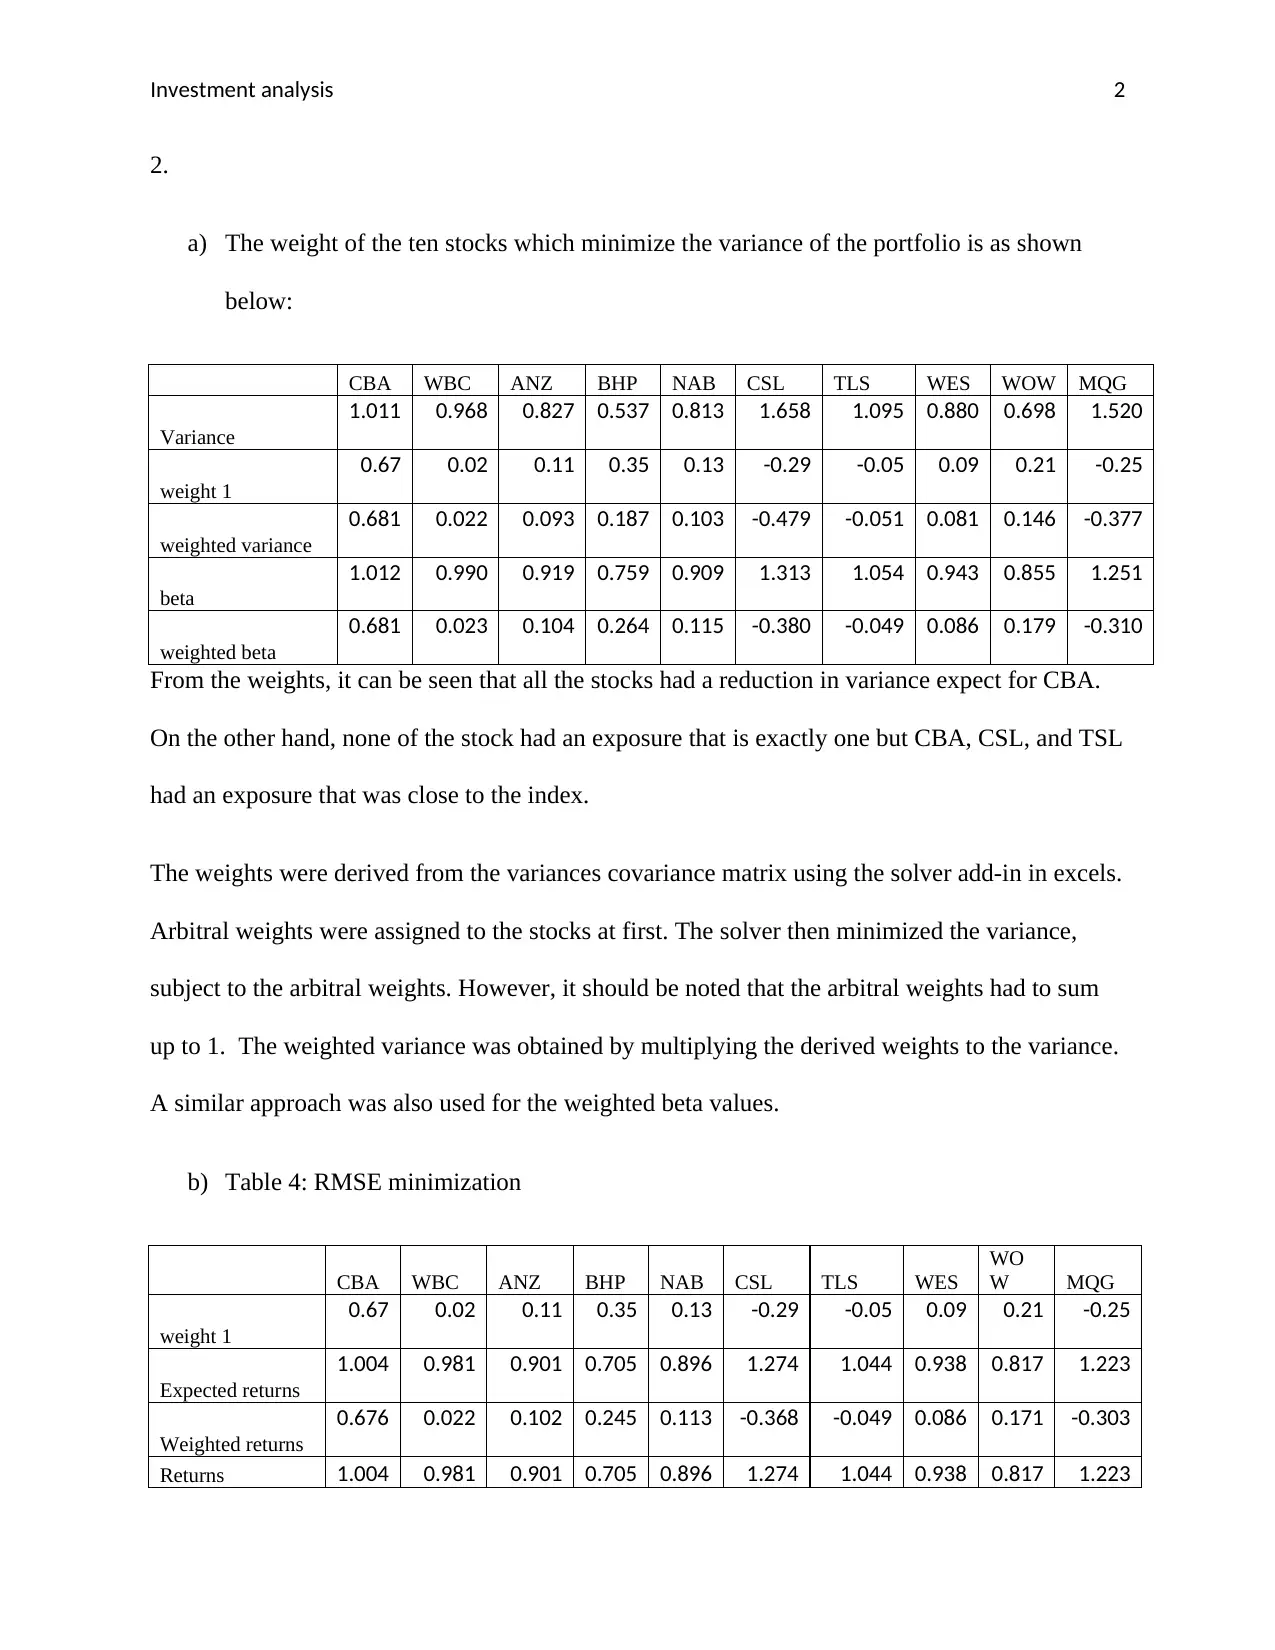
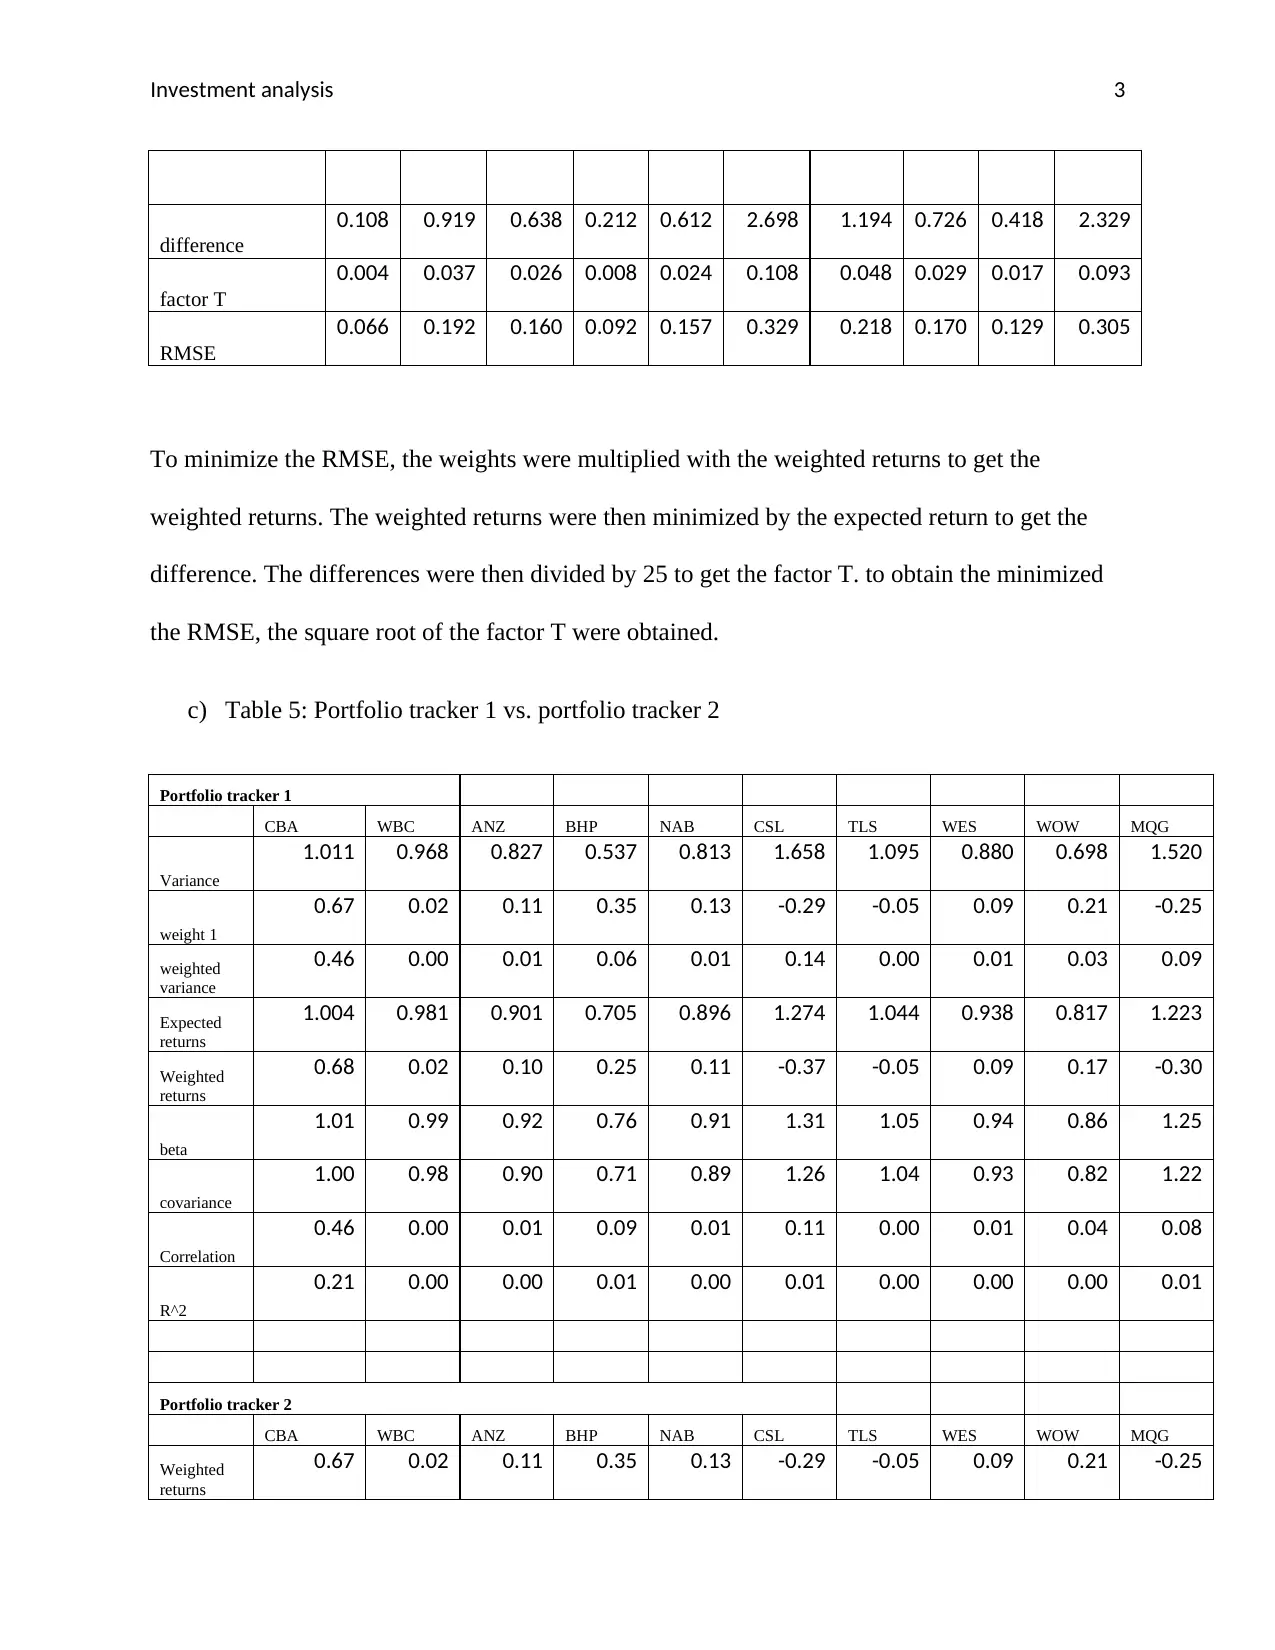
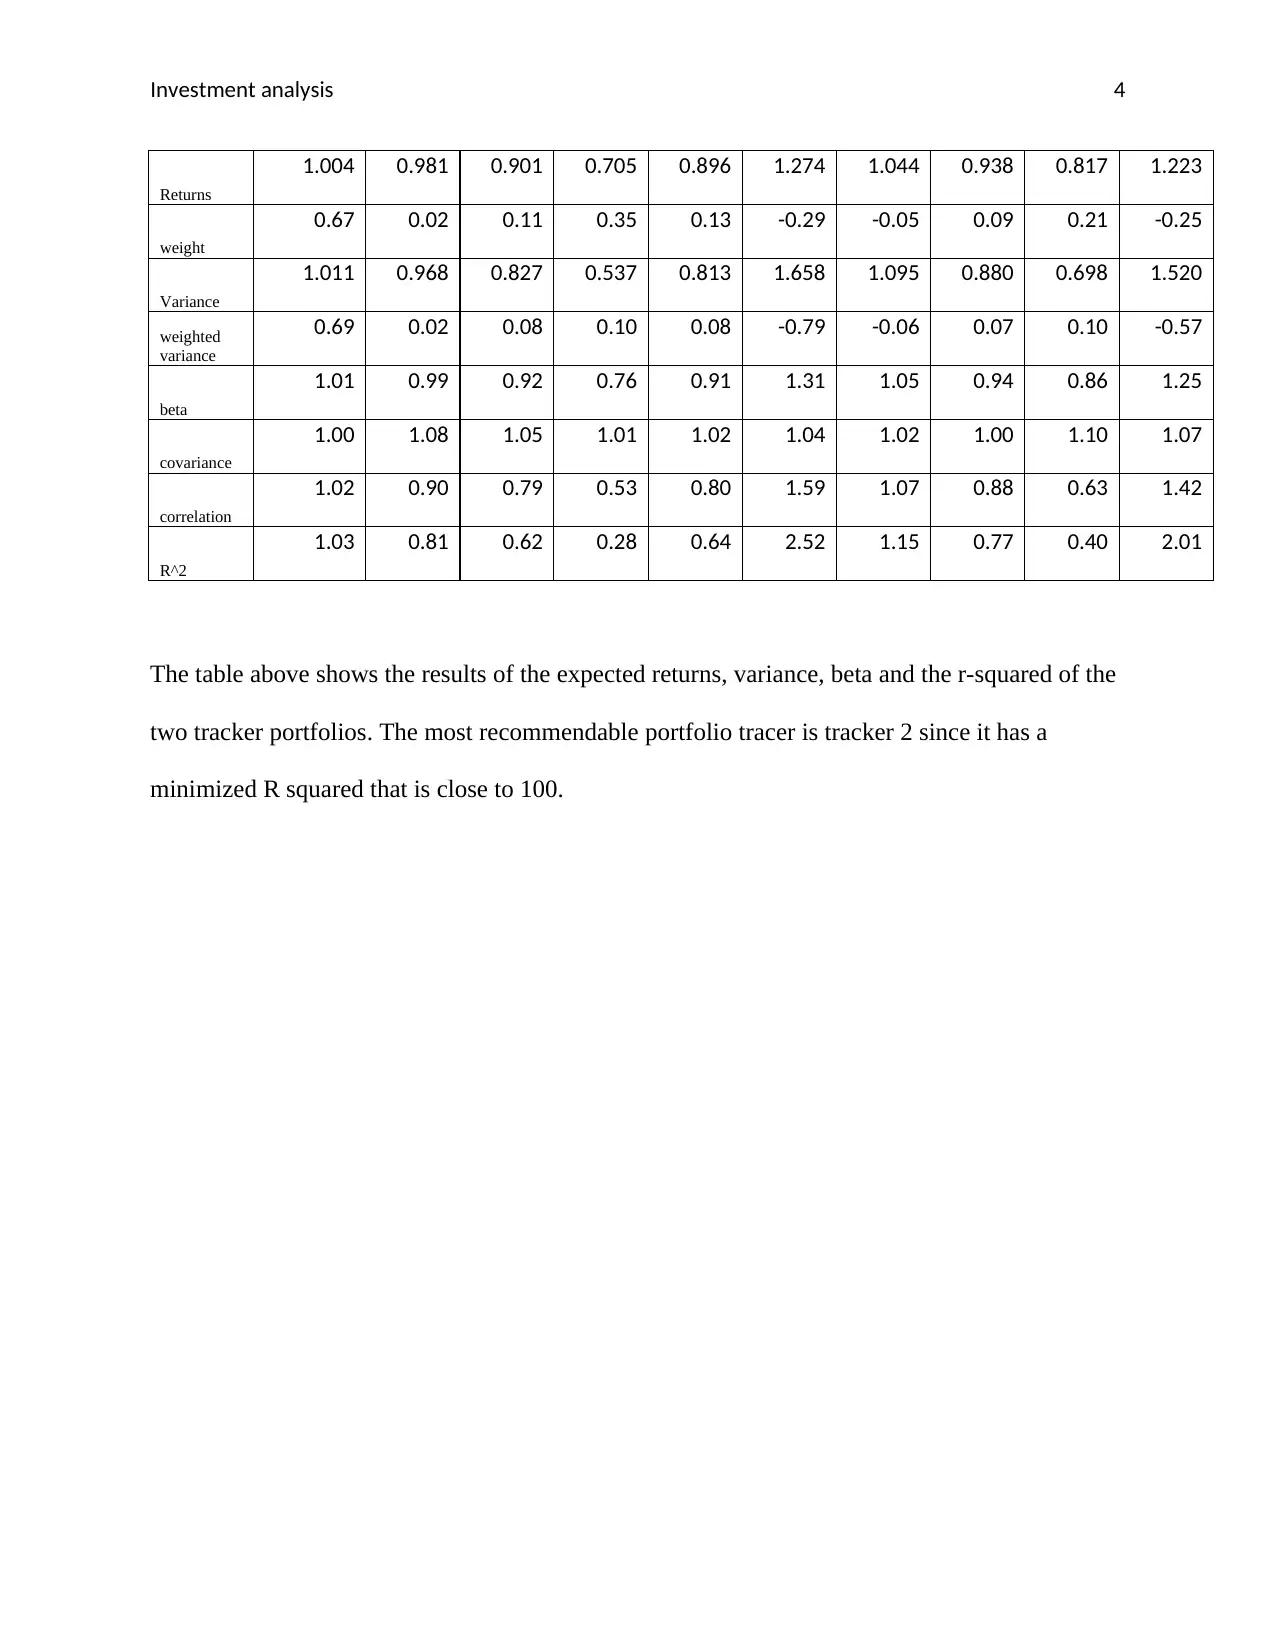
This investment analysis project examines portfolio optimization and performance. It begins by calculating the weights of ten stocks to minimize portfolio variance, presenting the weighted variance and beta for each stock. The analysis then proceeds to minimize the Root Mean Square Error (RMSE) by calculating weighted returns and differences from expected returns. Finally, the project compares two portfolio trackers, evaluating their expected returns, variance, beta, covariance, correlation, and R-squared values to determine the most recommendable portfolio tracker, which is determined to be tracker 2 due to its R-squared value being close to 100.
Document Page
Running Header: INVESTMENT ANALYSIS
1
Investment analysis
Student's name:
Institution:
Professor's name:
Course:
tabler-icon-diamond-filled.svg

Paraphrase This Document

Need a fresh take? Get an instant paraphrase of this document with our AI Paraphraser
Document Page
Investment analysis 2
2.
a) The weight of the ten stocks which minimize the variance of the portfolio is as shown
below:
CBA WBC ANZ BHP NAB CSL TLS WES WOW MQG
Variance
1.011 0.968 0.827 0.537 0.813 1.658 1.095 0.880 0.698 1.520
weight 1
0.67 0.02 0.11 0.35 0.13 -0.29 -0.05 0.09 0.21 -0.25
weighted variance
0.681 0.022 0.093 0.187 0.103 -0.479 -0.051 0.081 0.146 -0.377
beta
1.012 0.990 0.919 0.759 0.909 1.313 1.054 0.943 0.855 1.251
weighted beta
0.681 0.023 0.104 0.264 0.115 -0.380 -0.049 0.086 0.179 -0.310
From the weights, it can be seen that all the stocks had a reduction in variance expect for CBA.
On the other hand, none of the stock had an exposure that is exactly one but CBA, CSL, and TSL
had an exposure that was close to the index.
The weights were derived from the variances covariance matrix using the solver add-in in excels.
Arbitral weights were assigned to the stocks at first. The solver then minimized the variance,
subject to the arbitral weights. However, it should be noted that the arbitral weights had to sum
up to 1. The weighted variance was obtained by multiplying the derived weights to the variance.
A similar approach was also used for the weighted beta values.
b) Table 4: RMSE minimization
CBA WBC ANZ BHP NAB CSL TLS WES
WO
W MQG
weight 1
0.67 0.02 0.11 0.35 0.13 -0.29 -0.05 0.09 0.21 -0.25
Expected returns
1.004 0.981 0.901 0.705 0.896 1.274 1.044 0.938 0.817 1.223
Weighted returns
0.676 0.022 0.102 0.245 0.113 -0.368 -0.049 0.086 0.171 -0.303
Returns 1.004 0.981 0.901 0.705 0.896 1.274 1.044 0.938 0.817 1.223
Document Page
Investment analysis 3
difference
0.108 0.919 0.638 0.212 0.612 2.698 1.194 0.726 0.418 2.329
factor T
0.004 0.037 0.026 0.008 0.024 0.108 0.048 0.029 0.017 0.093
RMSE
0.066 0.192 0.160 0.092 0.157 0.329 0.218 0.170 0.129 0.305
To minimize the RMSE, the weights were multiplied with the weighted returns to get the
weighted returns. The weighted returns were then minimized by the expected return to get the
difference. The differences were then divided by 25 to get the factor T. to obtain the minimized
the RMSE, the square root of the factor T were obtained.
c) Table 5: Portfolio tracker 1 vs. portfolio tracker 2
Portfolio tracker 1
CBA WBC ANZ BHP NAB CSL TLS WES WOW MQG
Variance
1.011 0.968 0.827 0.537 0.813 1.658 1.095 0.880 0.698 1.520
weight 1
0.67 0.02 0.11 0.35 0.13 -0.29 -0.05 0.09 0.21 -0.25
weighted
variance
0.46 0.00 0.01 0.06 0.01 0.14 0.00 0.01 0.03 0.09
Expected
returns
1.004 0.981 0.901 0.705 0.896 1.274 1.044 0.938 0.817 1.223
Weighted
returns
0.68 0.02 0.10 0.25 0.11 -0.37 -0.05 0.09 0.17 -0.30
beta
1.01 0.99 0.92 0.76 0.91 1.31 1.05 0.94 0.86 1.25
covariance
1.00 0.98 0.90 0.71 0.89 1.26 1.04 0.93 0.82 1.22
Correlation
0.46 0.00 0.01 0.09 0.01 0.11 0.00 0.01 0.04 0.08
R^2
0.21 0.00 0.00 0.01 0.00 0.01 0.00 0.00 0.00 0.01
Portfolio tracker 2
CBA WBC ANZ BHP NAB CSL TLS WES WOW MQG
Weighted
returns
0.67 0.02 0.11 0.35 0.13 -0.29 -0.05 0.09 0.21 -0.25
Document Page
Investment analysis 4
Returns
1.004 0.981 0.901 0.705 0.896 1.274 1.044 0.938 0.817 1.223
weight
0.67 0.02 0.11 0.35 0.13 -0.29 -0.05 0.09 0.21 -0.25
Variance
1.011 0.968 0.827 0.537 0.813 1.658 1.095 0.880 0.698 1.520
weighted
variance
0.69 0.02 0.08 0.10 0.08 -0.79 -0.06 0.07 0.10 -0.57
beta
1.01 0.99 0.92 0.76 0.91 1.31 1.05 0.94 0.86 1.25
covariance
1.00 1.08 1.05 1.01 1.02 1.04 1.02 1.00 1.10 1.07
correlation
1.02 0.90 0.79 0.53 0.80 1.59 1.07 0.88 0.63 1.42
R^2
1.03 0.81 0.62 0.28 0.64 2.52 1.15 0.77 0.40 2.01
The table above shows the results of the expected returns, variance, beta and the r-squared of the
two tracker portfolios. The most recommendable portfolio tracer is tracker 2 since it has a
minimized R squared that is close to 100.
chevron_up_icon
1 out of 4
circle_padding
hide_on_mobile
zoom_out_icon
[object Object]