Investment Analysis and Portfolio Management Project Report - Finance
VerifiedAdded on 2022/08/27
|19
|3180
|16
Project
AI Summary
This report presents an investment analysis and portfolio management project focusing on Jardine Matheson Holdings Limited and DBS Group Holdings Limited. The analysis begins with calculating the annualized mean return, standard deviation, and correlation of the two stocks using five-year historical price data. It then determines the investment opportunity set by varying the weights of the two stocks and plots these sets. The project proceeds to identify the optimal risky portfolio, calculating its weights, expected return, and standard deviation, and plotting it on the investment opportunity set graph. Subsequently, the minimum variance portfolio is determined, and its characteristics are calculated and plotted. The efficient frontier is also identified. Finally, the report discusses diversification benefits in relation to the efficient frontier and compares the risk-return characteristics of the optimal risky and minimum-variance portfolios. The project uses Excel for calculations, with the detailed calculations in the appendix, and aims to illustrate portfolio construction and risk management principles.
INVESTMENT ANALYSIS AND
PORTFOLIO MANAGEMENT
Running Head: Investment Analysis and Portfolio Management
PORTFOLIO MANAGEMENT
Running Head: Investment Analysis and Portfolio Management
Paraphrase This Document
Need a fresh take? Get an instant paraphrase of this document with our AI Paraphraser
Investment Analysis and Portfolio Management
Contents
Introduction................................................................................................................................1
Investment Analysis and Portfolio Management.......................................................................2
a. Calculating the annualised mean return, standard deviation and correlation of Jardine
Matheson Holdings Limited and DBS Group Holdings Limited...........................................3
b. Determining the investment opportunity set of Jardine Matheson Holdings and DBS
Group Holdings stocks...........................................................................................................4
c. Determining the weights on the Optimal Risky Portfolio consisting of Jardine
Matheson Holdings and DBS Group Holdings stocks...........................................................6
d. Calculating the expected return and standard deviation of the above optimal risky
portfolio and plotting it on the investment opportunity sets graph of Jardine Matheson
Holdings and DBS Group Holdings stocks............................................................................8
e. Determining the weights on the Minimum Variance Portfolio consisting of Jardine
Matheson Holdings and DBS Group Holdings stocks...........................................................9
f. Calculating the expected return and standard deviation of the above Minimum
Variance Portfolio and plotting it along with the efficient frontier on the investment
opportunity sets graph of Jardine Matheson Holdings and DBS Group Holdings stocks....10
g. Discussion on the diversification in reference to the efficient frontier and comparison
of the expected return and standard deviation of the optimal risky portfolio and the
minimum-variance portfolio.................................................................................................12
Conclusion................................................................................................................................15
References................................................................................................................................16
Appendix..................................................................................................................................17
1
Investment Analysis and Portfolio Management
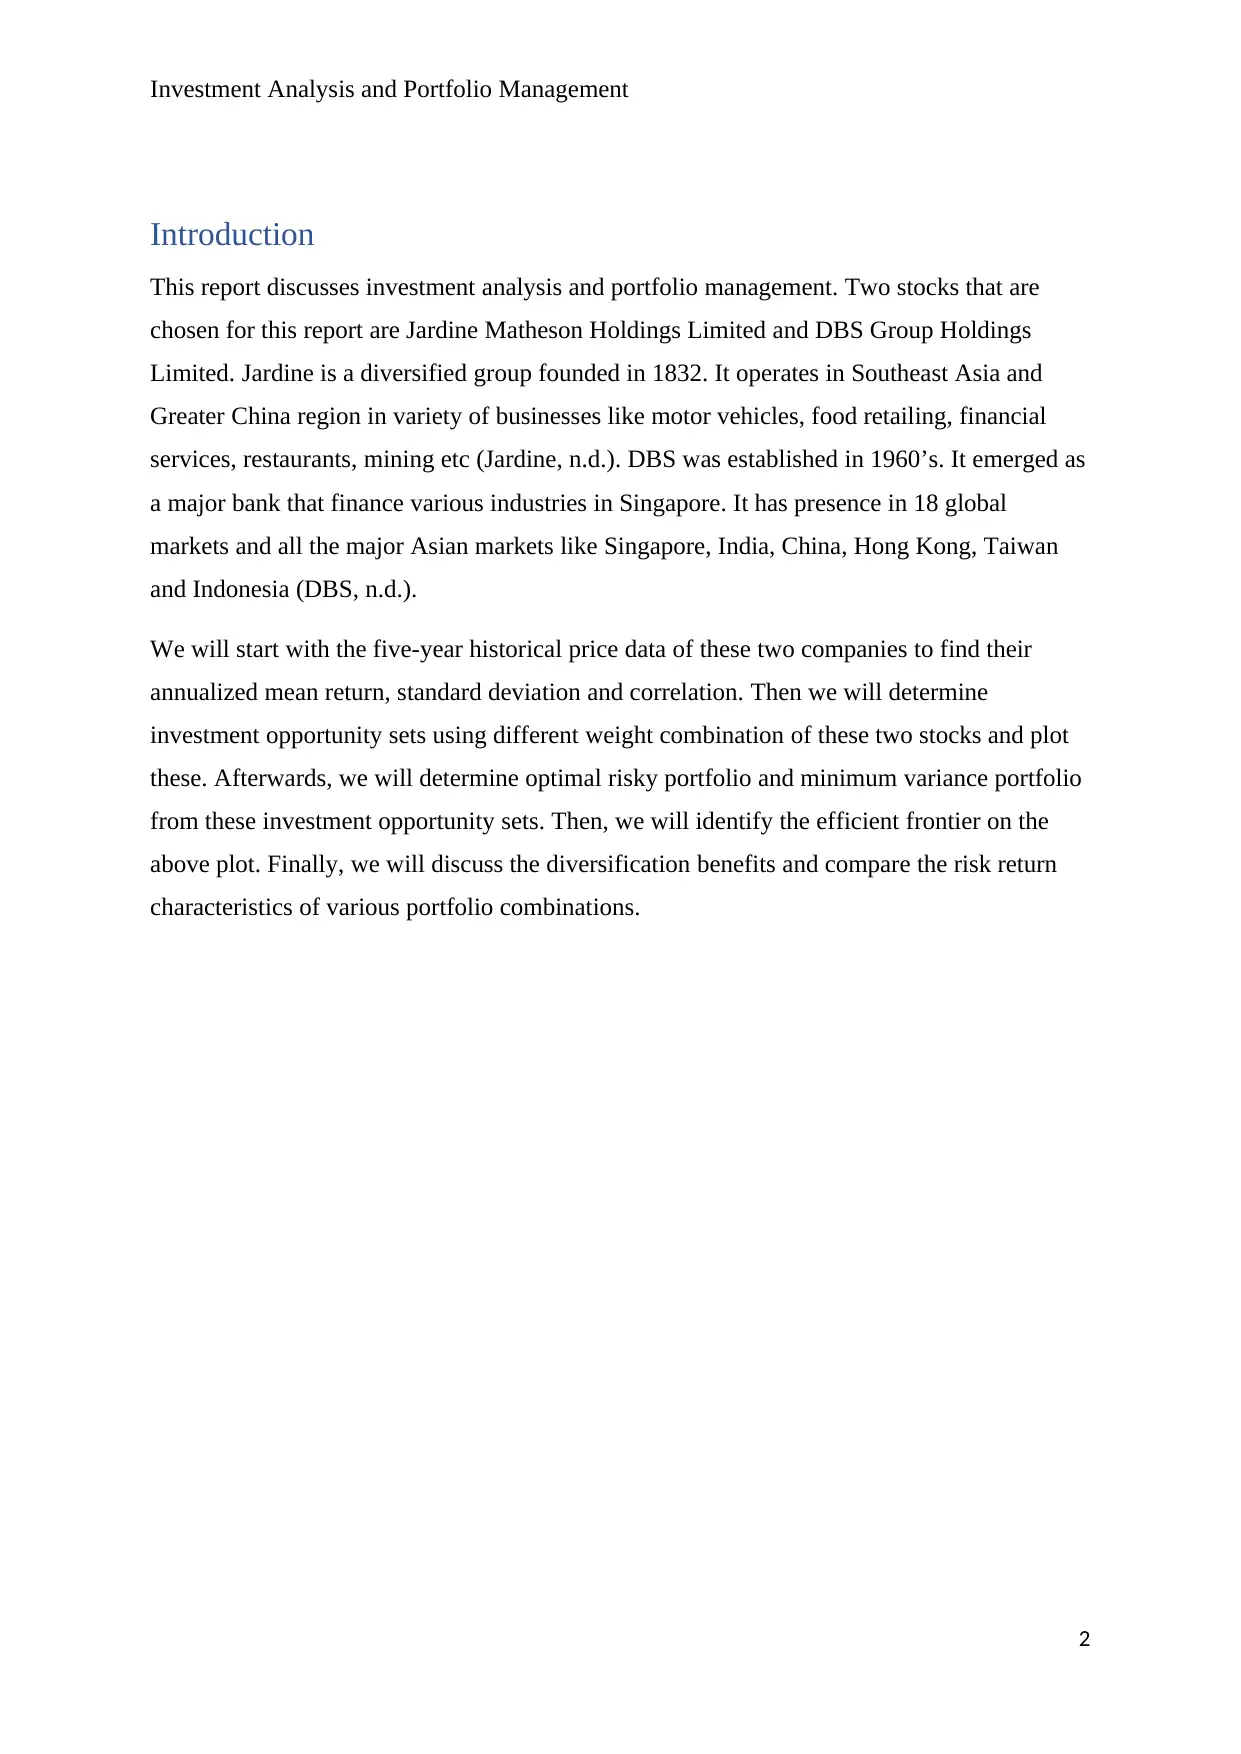
Introduction
This report discusses investment analysis and portfolio management. Two stocks that are
chosen for this report are Jardine Matheson Holdings Limited and DBS Group Holdings
Limited. Jardine is a diversified group founded in 1832. It operates in Southeast Asia and
Greater China region in variety of businesses like motor vehicles, food retailing, financial
services, restaurants, mining etc (Jardine, n.d.). DBS was established in 1960’s. It emerged as
a major bank that finance various industries in Singapore. It has presence in 18 global
markets and all the major Asian markets like Singapore, India, China, Hong Kong, Taiwan
and Indonesia (DBS, n.d.).
We will start with the five-year historical price data of these two companies to find their
annualized mean return, standard deviation and correlation. Then we will determine
investment opportunity sets using different weight combination of these two stocks and plot
these. Afterwards, we will determine optimal risky portfolio and minimum variance portfolio
from these investment opportunity sets. Then, we will identify the efficient frontier on the
above plot. Finally, we will discuss the diversification benefits and compare the risk return
characteristics of various portfolio combinations.
2
⊘ This is a preview!⊘
Do you want full access?
Subscribe today to unlock all pages.
Trusted by 1+ million students worldwide
Investment Analysis and Portfolio Management
Investment Analysis and Portfolio Management
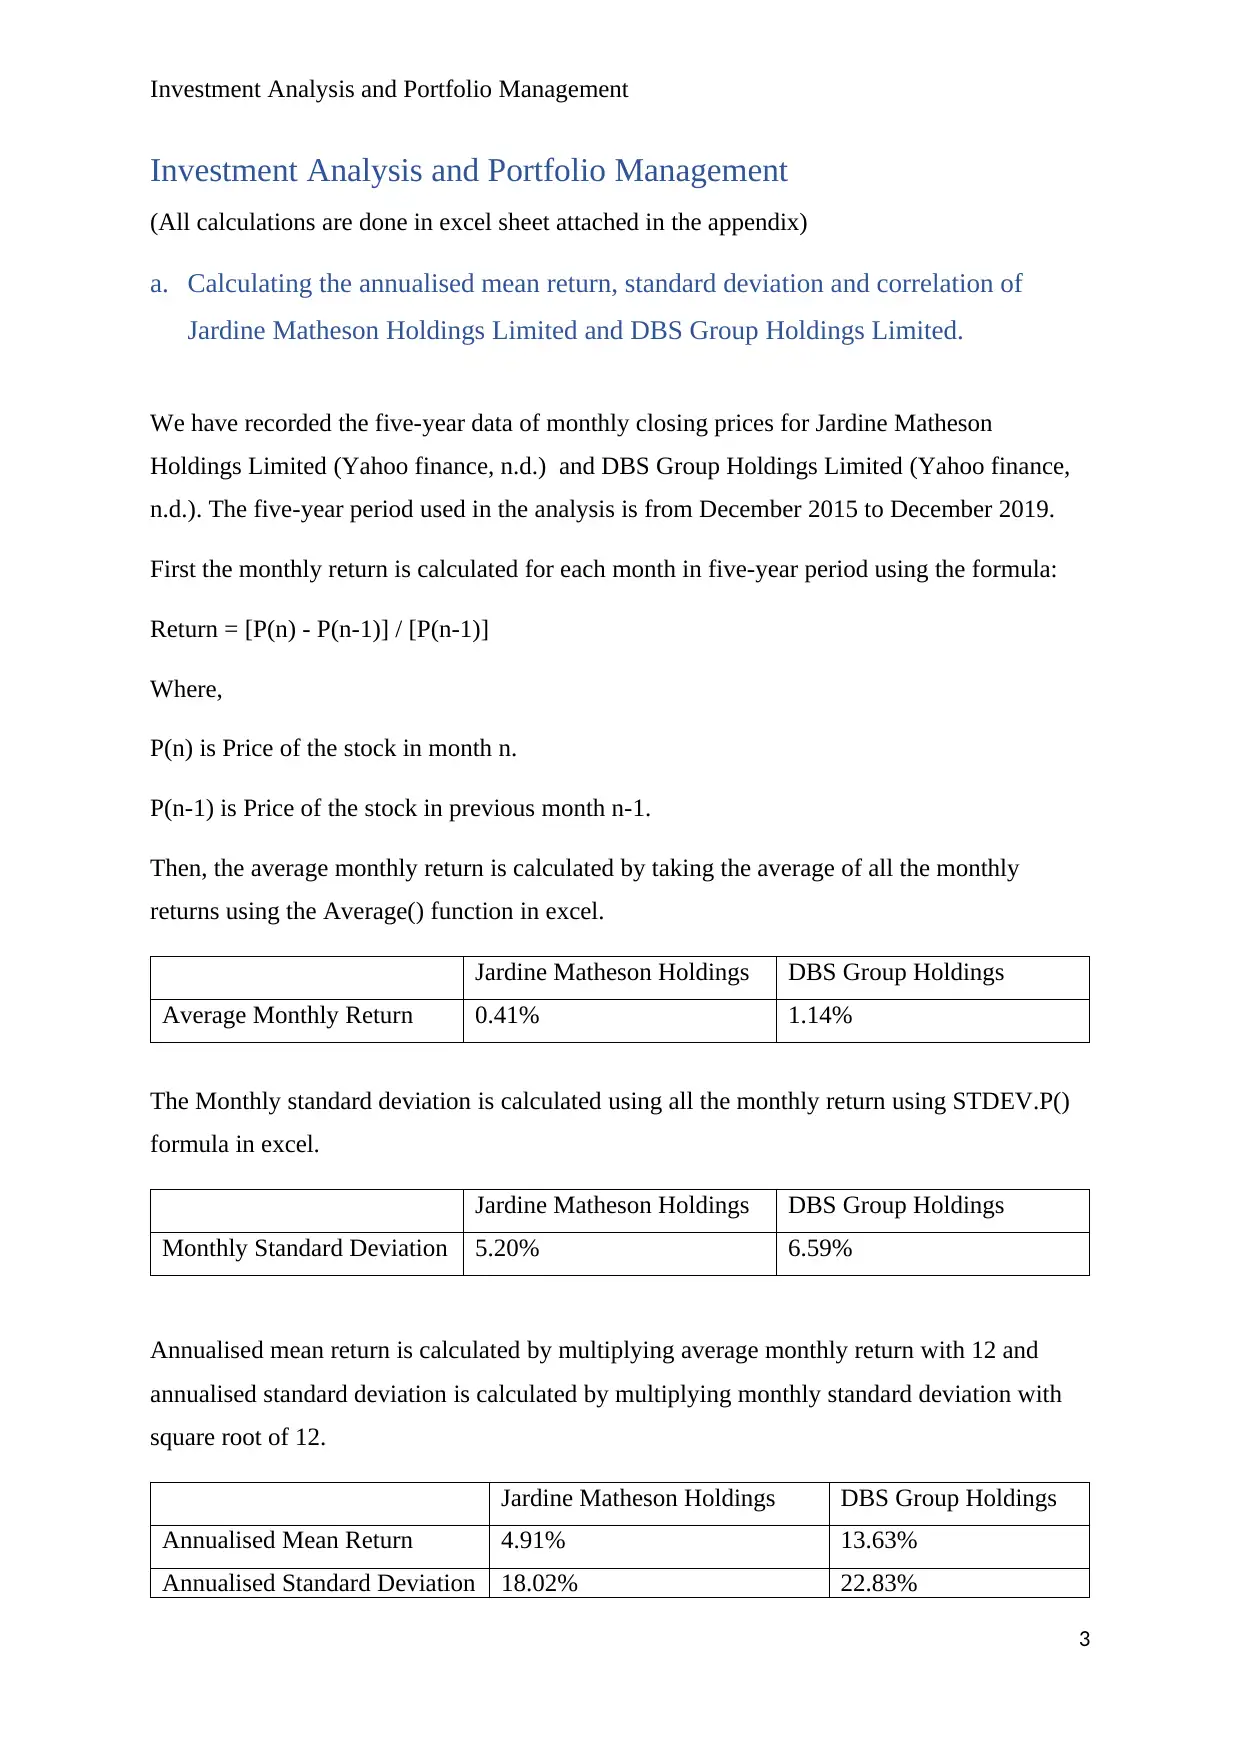
(All calculations are done in excel sheet attached in the appendix)
a. Calculating the annualised mean return, standard deviation and correlation of
Jardine Matheson Holdings Limited and DBS Group Holdings Limited.
We have recorded the five-year data of monthly closing prices for Jardine Matheson
Holdings Limited (Yahoo finance, n.d.) and DBS Group Holdings Limited (Yahoo finance,
n.d.). The five-year period used in the analysis is from December 2015 to December 2019.
First the monthly return is calculated for each month in five-year period using the formula:
Return = [P(n) - P(n-1)] / [P(n-1)]
Where,
P(n) is Price of the stock in month n.
P(n-1) is Price of the stock in previous month n-1.
Then, the average monthly return is calculated by taking the average of all the monthly
returns using the Average() function in excel.
Jardine Matheson Holdings DBS Group Holdings
Average Monthly Return 0.41% 1.14%
The Monthly standard deviation is calculated using all the monthly return using STDEV.P()
formula in excel.
Jardine Matheson Holdings DBS Group Holdings
Monthly Standard Deviation 5.20% 6.59%
Annualised mean return is calculated by multiplying average monthly return with 12 and
annualised standard deviation is calculated by multiplying monthly standard deviation with
square root of 12.
Jardine Matheson Holdings DBS Group Holdings
Annualised Mean Return 4.91% 13.63%
Annualised Standard Deviation 18.02% 22.83%
3
Investment Analysis and Portfolio Management
(All calculations are done in excel sheet attached in the appendix)
a. Calculating the annualised mean return, standard deviation and correlation of
Jardine Matheson Holdings Limited and DBS Group Holdings Limited.
We have recorded the five-year data of monthly closing prices for Jardine Matheson
Holdings Limited (Yahoo finance, n.d.) and DBS Group Holdings Limited (Yahoo finance,
n.d.). The five-year period used in the analysis is from December 2015 to December 2019.
First the monthly return is calculated for each month in five-year period using the formula:
Return = [P(n) - P(n-1)] / [P(n-1)]
Where,
P(n) is Price of the stock in month n.
P(n-1) is Price of the stock in previous month n-1.
Then, the average monthly return is calculated by taking the average of all the monthly
returns using the Average() function in excel.
Jardine Matheson Holdings DBS Group Holdings
Average Monthly Return 0.41% 1.14%
The Monthly standard deviation is calculated using all the monthly return using STDEV.P()
formula in excel.
Jardine Matheson Holdings DBS Group Holdings
Monthly Standard Deviation 5.20% 6.59%
Annualised mean return is calculated by multiplying average monthly return with 12 and
annualised standard deviation is calculated by multiplying monthly standard deviation with
square root of 12.
Jardine Matheson Holdings DBS Group Holdings
Annualised Mean Return 4.91% 13.63%
Annualised Standard Deviation 18.02% 22.83%
3
Paraphrase This Document
Need a fresh take? Get an instant paraphrase of this document with our AI Paraphraser
Investment Analysis and Portfolio Management
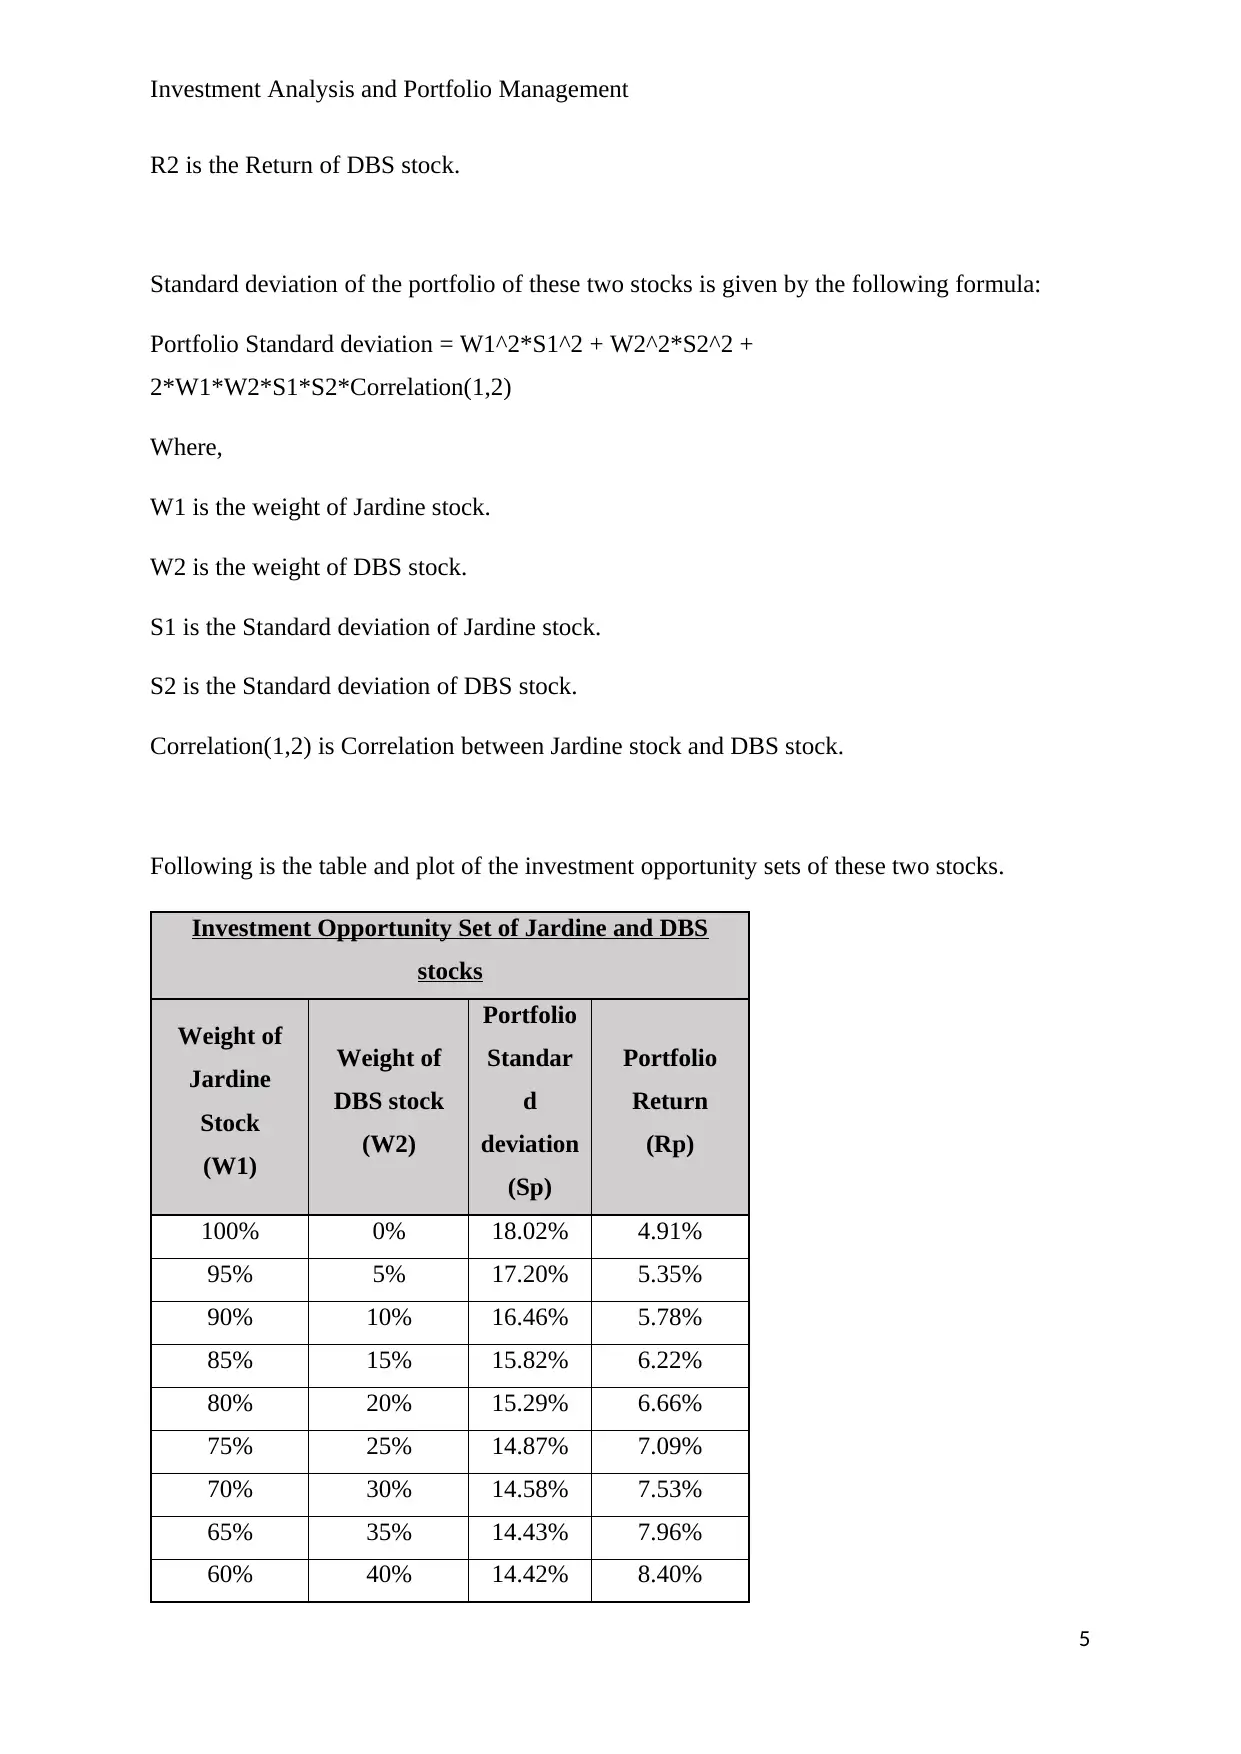
It is seen that Jardine Matheson Holdings stock has lower mean return and standard deviation
than DBS stock. If we compare the Sharpe ratio of both the stocks then it can be observed
that the return in excess of risk-free rate per unit of risk is higher for the DBS stock (shown
below).
Sharpe Ratio = (Stock Return – Risk-free rate) / Stock Standard Deviation
Jardine Matheson Holdings DBS Group Holdings
Sharpe Ratio 0.19 0.53
Correlation between these two stocks is calculated using all the monthly returns data using
CORREL() formula in excel.
Correlation between Jardine and DBS stocks = 0.03835
The correlation between these two stocks is close to zero that means the movement of the
returns of these two stocks is not related to each other.
b. Determining the investment opportunity set of Jardine Matheson Holdings and
DBS Group Holdings stocks.
We use the investment proportions for Jardine Matheson Holdings and DBS Group Holdings
stocks from 0% to 100% taking intervals of 5% to determine the investment opportunity set
of these two stocks.
Return of the portfolio of these two stocks is given by the following formula:
Portfolio Return = W1*R1 + W2*R2
Where,
W1 is the weight of Jardine stock.
W2 is the weight of DBS stock.
R1 is the Return of Jardine stock.
4
Investment Analysis and Portfolio Management
R2 is the Return of DBS stock.
Standard deviation of the portfolio of these two stocks is given by the following formula:
Portfolio Standard deviation = W1^2*S1^2 + W2^2*S2^2 +
2*W1*W2*S1*S2*Correlation(1,2)
Where,
W1 is the weight of Jardine stock.
W2 is the weight of DBS stock.
S1 is the Standard deviation of Jardine stock.
S2 is the Standard deviation of DBS stock.
Correlation(1,2) is Correlation between Jardine stock and DBS stock.
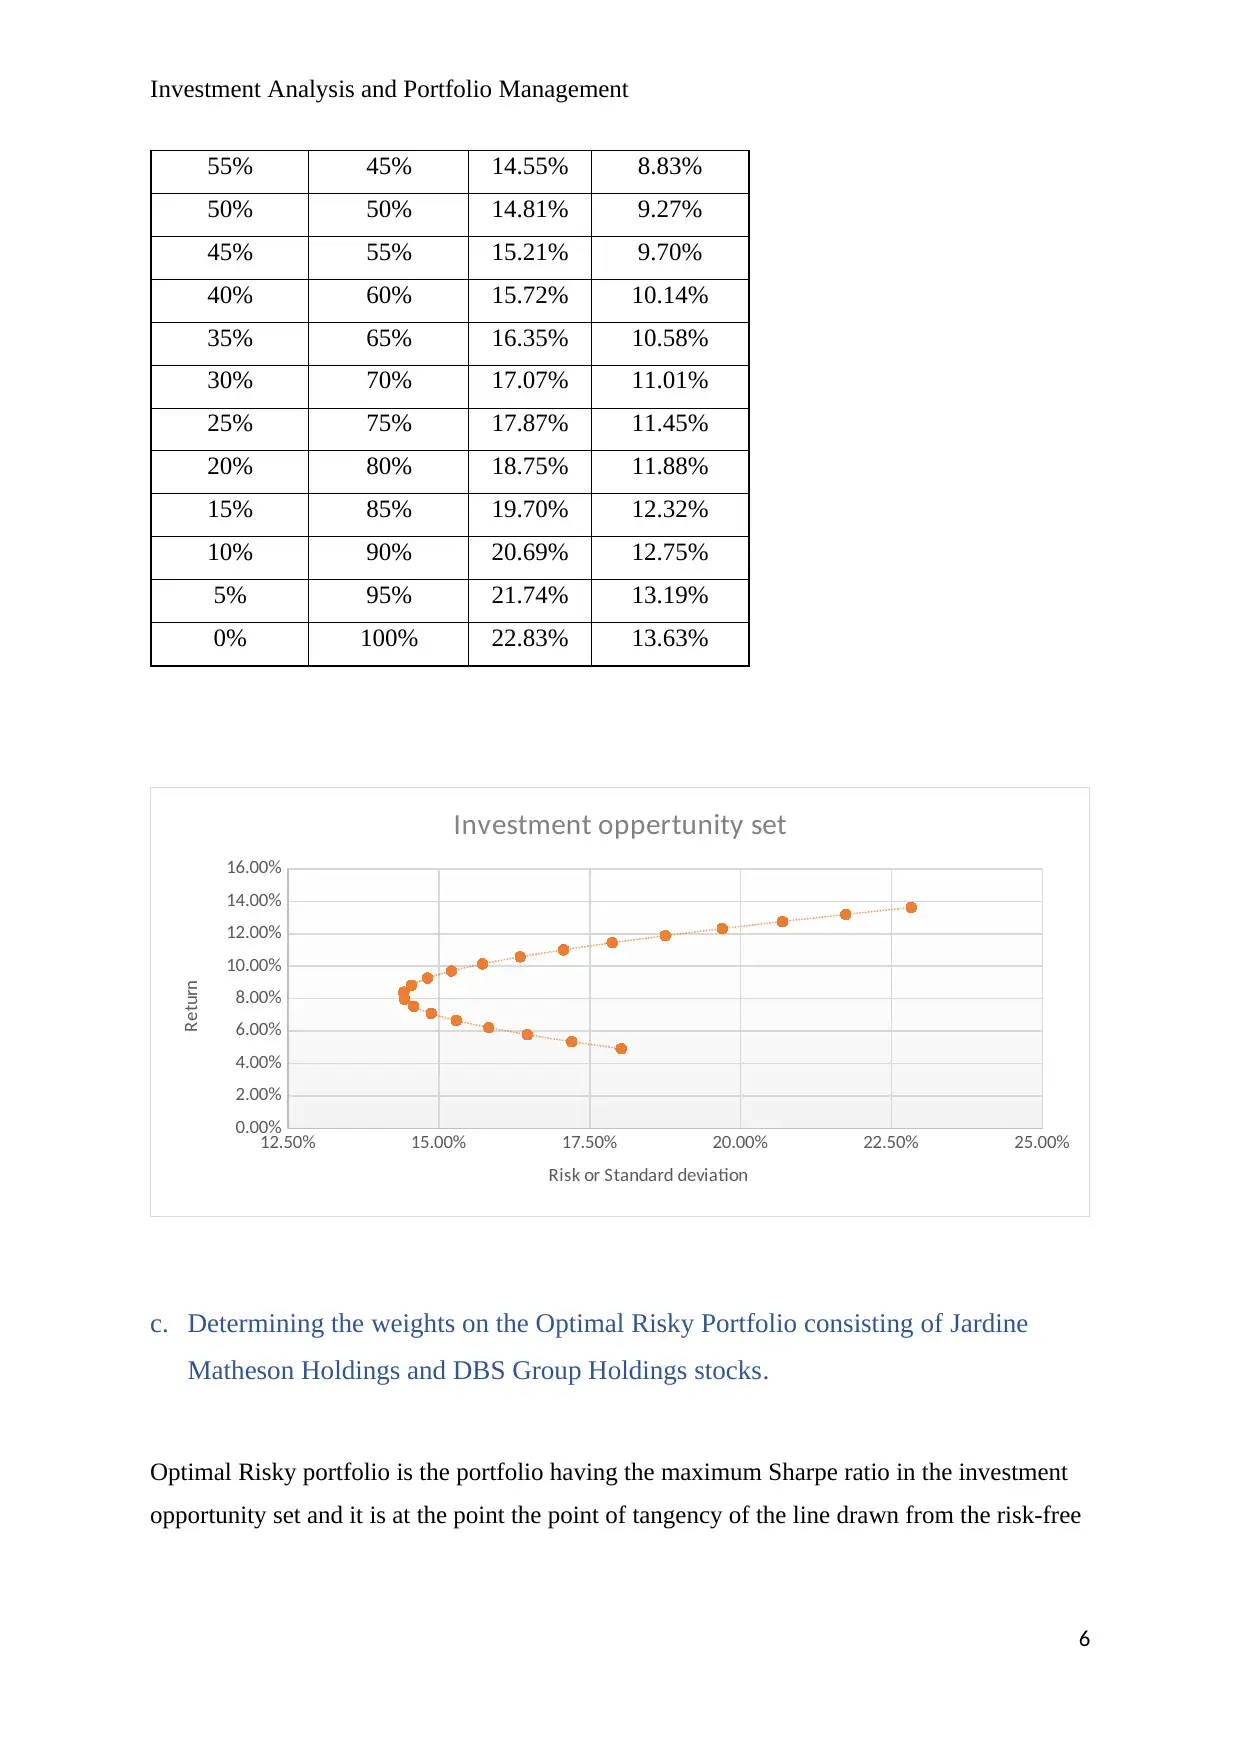
Following is the table and plot of the investment opportunity sets of these two stocks.
Investment Opportunity Set of Jardine and DBS
stocks
Weight of
Jardine
Stock
(W1)
Weight of
DBS stock
(W2)
Portfolio
Standar
d
deviation
(Sp)
Portfolio
Return
(Rp)
100% 0% 18.02% 4.91%
95% 5% 17.20% 5.35%
90% 10% 16.46% 5.78%
85% 15% 15.82% 6.22%
80% 20% 15.29% 6.66%
75% 25% 14.87% 7.09%
70% 30% 14.58% 7.53%
65% 35% 14.43% 7.96%
60% 40% 14.42% 8.40%
5
R2 is the Return of DBS stock.
Standard deviation of the portfolio of these two stocks is given by the following formula:
Portfolio Standard deviation = W1^2*S1^2 + W2^2*S2^2 +
2*W1*W2*S1*S2*Correlation(1,2)
Where,
W1 is the weight of Jardine stock.
W2 is the weight of DBS stock.
S1 is the Standard deviation of Jardine stock.
S2 is the Standard deviation of DBS stock.
Correlation(1,2) is Correlation between Jardine stock and DBS stock.
Following is the table and plot of the investment opportunity sets of these two stocks.
Investment Opportunity Set of Jardine and DBS
stocks
Weight of
Jardine
Stock
(W1)
Weight of
DBS stock
(W2)
Portfolio
Standar
d
deviation
(Sp)
Portfolio
Return
(Rp)
100% 0% 18.02% 4.91%
95% 5% 17.20% 5.35%
90% 10% 16.46% 5.78%
85% 15% 15.82% 6.22%
80% 20% 15.29% 6.66%
75% 25% 14.87% 7.09%
70% 30% 14.58% 7.53%
65% 35% 14.43% 7.96%
60% 40% 14.42% 8.40%
5
⊘ This is a preview!⊘
Do you want full access?
Subscribe today to unlock all pages.
Trusted by 1+ million students worldwide
Investment Analysis and Portfolio Management
55% 45% 14.55% 8.83%
50% 50% 14.81% 9.27%
45% 55% 15.21% 9.70%
40% 60% 15.72% 10.14%
35% 65% 16.35% 10.58%
30% 70% 17.07% 11.01%
25% 75% 17.87% 11.45%
20% 80% 18.75% 11.88%
15% 85% 19.70% 12.32%
10% 90% 20.69% 12.75%
5% 95% 21.74% 13.19%
0% 100% 22.83% 13.63%
12.50% 15.00% 17.50% 20.00% 22.50% 25.00%
0.00%
2.00%
4.00%
6.00%
8.00%
10.00%
12.00%
14.00%
16.00%
Investment oppertunity set
Risk or Standard deviation
Return
c. Determining the weights on the Optimal Risky Portfolio consisting of Jardine
Matheson Holdings and DBS Group Holdings stocks.
Optimal Risky portfolio is the portfolio having the maximum Sharpe ratio in the investment
opportunity set and it is at the point the point of tangency of the line drawn from the risk-free
6
Paraphrase This Document
Need a fresh take? Get an instant paraphrase of this document with our AI Paraphraser
Investment Analysis and Portfolio Management
rate (Capital allocation line). The weights of these two stocks in their optimal risky portfolio
is determined using the formulas given below:
W1 = [(R1-Rf)*S2^2 – (R2-Rf)*Correlation(1,2)*S1*S2] / [(R1-Rf)*S2^2 + (R1-Rf+R2-
Rf)* Correlation(1,2)*S1*S2]
W2 = 1 – W1
Where,
W1 is the weight of Jardine stock.
W2 is the weight of DBS stock.
R1 is the Return of Jardine stock.
R2 is the Return of DBS stock.
S1 is the Standard deviation of Jardine stock.
S2 is the Standard deviation of DBS stock.
Rf is Risk-free rate
Correlation(1,2) is Correlation between Jardine stock and DBS stock.
Following are the weights on the Optimal Risky Portfolio consisting of Jardine Matheson
Holdings and DBS Group Holdings stocks:
Optimal Risky Portfolio
Weight of Jardine Stock (W1) Weight of DBS stock (W2)
29.12% 70.88%
7
Investment Analysis and Portfolio Management
d. Calculating the expected return and standard deviation of the above optimal risky
portfolio and plotting it on the investment opportunity sets graph of Jardine
Matheson Holdings and DBS Group Holdings stocks.
Weights on this optimal risky portfolio:
Optimal Risky Portfolio
Weight of Jardine Stock (W1) Weight of DBS stock (W2)
29.12% 70.88%
Using the following formulas to calculate expected return and standard deviation of this
optimal risky portfolio:
Expected Return = W1*R1 + W2*R2
Standard deviation = W1^2*S1^2 + W2^2*S2^2 + 2*W1*W2*S1*S2*Correlation(1,2)
Where,
W1 is the weight of Jardine stock.
W2 is the weight of DBS stock.
R1 is the Return of Jardine stock.
R2 is the Return of DBS stock.
S1 is the Standard deviation of Jardine stock.
S2 is the Standard deviation of DBS stock.
Correlation(1,2) is Correlation between Jardine stock and DBS stock.
Expected return and standard deviation of this optimal risky portfolio:
Optimal Risky Portfolio
Portfolio Standard deviation (Sop) Portfolio Return (Rop)
17.20% 11.09%
8
⊘ This is a preview!⊘
Do you want full access?
Subscribe today to unlock all pages.
Trusted by 1+ million students worldwide
Investment Analysis and Portfolio Management
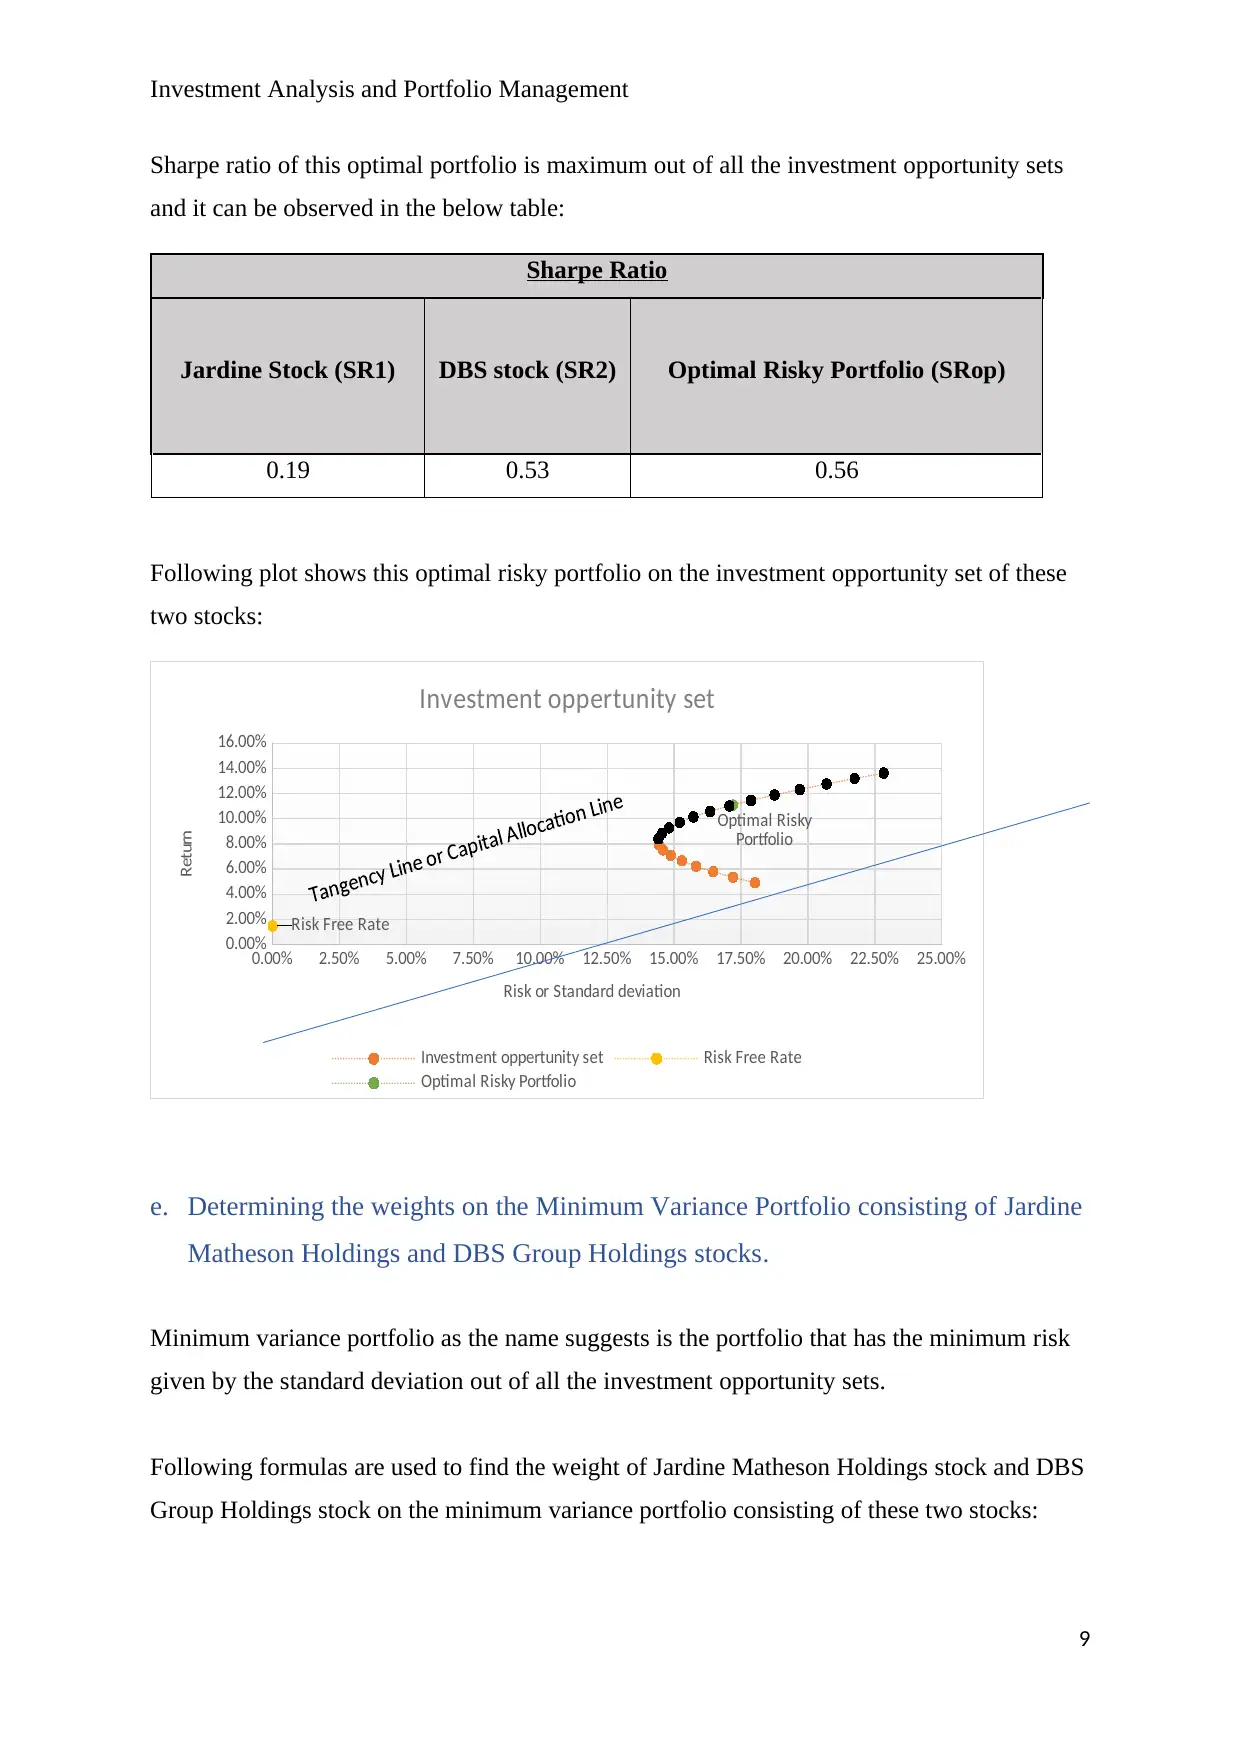
Sharpe ratio of this optimal portfolio is maximum out of all the investment opportunity sets
and it can be observed in the below table:
Sharpe Ratio
Jardine Stock (SR1) DBS stock (SR2) Optimal Risky Portfolio (SRop)
0.19 0.53 0.56
Following plot shows this optimal risky portfolio on the investment opportunity set of these
two stocks:
0.00% 2.50% 5.00% 7.50% 10.00% 12.50% 15.00% 17.50% 20.00% 22.50% 25.00%
0.00%
2.00%
4.00%
6.00%
8.00%
10.00%
12.00%
14.00%
16.00%
Optimal Risky
Portfolio
Risk Free Rate
Investment oppertunity set
Investment oppertunity set Risk Free Rate
Optimal Risky Portfolio
Risk or Standard deviation
Return
e. Determining the weights on the Minimum Variance Portfolio consisting of Jardine
Matheson Holdings and DBS Group Holdings stocks.
Minimum variance portfolio as the name suggests is the portfolio that has the minimum risk
given by the standard deviation out of all the investment opportunity sets.
Following formulas are used to find the weight of Jardine Matheson Holdings stock and DBS
Group Holdings stock on the minimum variance portfolio consisting of these two stocks:
9
Paraphrase This Document
Need a fresh take? Get an instant paraphrase of this document with our AI Paraphraser
Investment Analysis and Portfolio Management
W1 = [S2^2 – Correlation(1,2)*S1*S2] / [S1^2 + S2^2 – 2*Correlation(1,2)*S1*S2]
W2 = 1 – W1
Where,
W1 is the weight of Jardine stock.
W2 is the weight of DBS stock.
S1 is the Standard deviation of Jardine stock.
S2 is the Standard deviation of DBS stock.
Correlation(1,2) is Correlation between Jardine stock and DBS stock.
The calculated weights are shown in the below table:
Minimum Variance Portfolio
Weight of Jardine Stock (W1) Weight of DBS stock (W2)
62.07% 37.93%
f. Calculating the expected return and standard deviation of the above Minimum
Variance Portfolio and plotting it along with the efficient frontier on the
investment opportunity sets graph of Jardine Matheson Holdings and DBS Group
Holdings stocks.
Weights on this minimum variance portfolio:
Minimum Variance Portfolio
Weight of Jardine Stock (W1) Weight of DBS stock (W2)
62.07% 37.93%
Using the following formulas to calculate expected return and standard deviation of this
minimum variance portfolio:
Expected Return = W1*R1 + W2*R2
Standard deviation = W1^2*S1^2 + W2^2*S2^2 + 2*W1*W2*S1*S2*Correlation(1,2)
Where,
10
Investment Analysis and Portfolio Management
W1 is the weight of Jardine stock.
W2 is the weight of DBS stock.
R1 is the Return of Jardine stock.
R2 is the Return of DBS stock.
S1 is the Standard deviation of Jardine stock.
S2 is the Standard deviation of DBS stock.
Correlation(1,2) is Correlation between Jardine stock and DBS stock.
Expected return and standard deviation of this minimum variance portfolio:
Minimum Variance Portfolio
Portfolio Standard deviation Portfolio Return
14.41% 8.22%
Risk given by standard deviation of this minimum variance portfolio is minimum out of all
the investment opportunity sets and it can be observed in the below table:
Standard deviation
Jardine Stock (S1) DBS stock (S2) Minimum Variance Portfolio (Sop)
18.02% 22.83% 14.41%
Efficient frontier is the set of portfolios that are efficient to all other portfolios in the
investment opportunity set. These portfolios on efficient frontier have higher return for the
given level of risk than any other set of portfolios. All the portfolios lying above the
minimum variance portfolio on the investment opportunity sets curve make the efficient
frontier.
Following plot shows this minimum variance portfolio and the efficient frontier on the plot of
investment opportunity set of these two stocks:
11
⊘ This is a preview!⊘
Do you want full access?
Subscribe today to unlock all pages.
Trusted by 1+ million students worldwide
1 out of 19
Related Documents


Your All-in-One AI-Powered Toolkit for Academic Success.
+13062052269
info@desklib.com
Available 24*7 on WhatsApp / Email
![[object Object]](/_next/static/media/star-bottom.7253800d.svg)
Unlock your academic potential
Copyright © 2020–2026 A2Z Services. All Rights Reserved. Developed and managed by ZUCOL.