Investment Analysis and Portfolio Management in China and India
VerifiedAdded on 2019/11/08
|16
|3640
|82
Report
AI Summary
This report provides an investment analysis and portfolio management overview of China and India, two prominent emerging economies. It examines the political environments, economic situations, interest and exchange rates, employment statistics, and key industries of both countries. The analysis further explores the performance of major assets, fixed interest, and stock markets, offering insights into investment opportunities and risks within these dynamic markets. The report highlights the influence of political stability, economic policies, and market trends on investment returns, providing a comprehensive understanding of the investment landscape in China and India. Finally, the report provides a comparison of the two countries with respect to their current account and trade balance.
Running head: Investment Analysis and Portfolio Management 1
INVESTMENT ANALYSIS AND PORTFOLIO MANAGEMENT
Student Name
Institution
INVESTMENT ANALYSIS AND PORTFOLIO MANAGEMENT
Student Name
Institution
Paraphrase This Document
Need a fresh take? Get an instant paraphrase of this document with our AI Paraphraser
Investment Analysis and Portfolio Management 2
Introduction
Emerging economies refers to those economies of countries that are towards becoming
advance though. Two examples of these countries are China and India being the largest emerging
market economies in the world. Emerging economies offers some of the best business
opportunities since these countries have large economies with the ability to advance. The two
countries have different and varied economic and environmental condition that influences
investment. Both China and India have registered different economic growth that has a direct or
indirect effect on the return on capital invested. The robust economy that is supported by large
population size and good demography is vital for foreign investors willing to invest in the two
countries. The following paper gives the investment analysis and portfolio management within
two emerging economies of China and India.
The political environment in China has made limited progress in economic reforms. The
current Communist Party show limited economic reforms that hinder both economic growth and
trade with the economic growth currently standing at 6.9%. This implies that since the party
came into power there are structural problems that are also tied to financial regulatory
inefficiencies jeopardizing the financial sector (Bode, Kane & Marcus 2005). Furthermore, the
influence of Communist Party in the rule of law has reduced the dependence on the rule of law
pointing towards economic uncertainty growth giving integrity of Government Integrity 41.6.
This is due to the vulnerability of the legal system that controls the trade regulation to the
political influence of Communist Party hence judicial effectiveness 60.7 (Thorp 2010). Failure to
reform the economic and financial sector has also resulted in debt either in the household,
corporate, or the government. This political problem leaves the legitimacy of the Communist
Investment Analysis and Portfolio Management 3
Party government in doubt since it fails to improve the living standards of the people as they
promised when coming to power.
The government of India, on the other hand, is a democratically stable with annual
growth of 7%. Bharatiya Janata Party has performed since its coming into power in 2014 with
the reinvigorating economy policy. This is coupled with technological advancement creating a
clear distinction between the extremely wealthy and poor that exists in the Indian economy. In
addition, the economic policies that are developed by Bharatiya Janata Party have facilitated the
struggle in the country’s diverse population. The government of India is currently developing ties
with other countries such as the USA giving the current good score in terms of foreign relations.
Continuous pressure has made the judicial system in the country to be independent with good
adherence to the rule of law. The government integrity, therefore, remains Government Integrity
44.3 due to understaffed of the judiciary with Judicial Effectiveness 44.4.
Economic situation
The Indian open market gives the value of export and import leveling at 49% of GDP.
According to reff, the average tariff that is applied to balance of trade currently is 6.2% with
state enterprise distorting the economy of India. Moreover, the government banking institutions
are the major players in the economy. These institutions also dominate the capital market sector
despite the liberalization of market efforts. The trade freedom is on the rise and, currently stands
at 72.6% giving investment freedom and financial freedom equal rating of 40.0. India’s interest
rate, on the other hand, is currently 8.1% p.a. this interest rate was made effective from the
financial year 2016/2017.
⊘ This is a preview!⊘
Do you want full access?
Subscribe today to unlock all pages.
Trusted by 1+ million students worldwide
Investment Analysis and Portfolio Management 4
Interest rates
China economy is improving in terms of interest rates with the adoption of short-term
interest rate that has been witnessed in the recent times in the country. Some institution such as
Shanghai Interbank current interest rate stands at 4.42% superseding the PBOC’s of 4.35%. This
is positive given the 4.85% interest rate recorded in June 2015. The trend has been on the decline
since 1996 where the country recorded an interest rate of 10.98% and was the highest. For the
last, two years the interest rate has stabilized at 4.35% since October 2015 (Jalil, Feridun & Ying
2010, pp. 189-195).
The India’s State Bank of India (SBI) has the mandate to set the interest rate throughout
the country. The fixed deposits interest rate is currently set at 5.25%pa to 7.25%pa. Moreover,
fixed deposit is set differently depending on the period of time for instance 60,90, and 120 days
have fixed deposit rate of 6.5% pa while 6 months attract fixed deposit rate of 6.75% pa. On the
higher side, duration of 9 months comes with a fixed deposit rate of 7% pa (Echeverri-Gent
2002, pp. 19–53).
Exchange rates
China is a major player in the global trade platform with its economic policies
influencing the much global economy. According to Bose and Jalal (2011), China is at the
epicenter of the Asian trade making the country Yuan have influence in the exchange rate within
the global economy. The Chinese currency is currently stabilizing with 1 Yuan trading at 0.15
US Dollar in the international market. This gives the currently country stable foreign exchange
rate in the international trade. Indian rupee is the official currency of India (INR) and is one of
Paraphrase This Document
Need a fresh take? Get an instant paraphrase of this document with our AI Paraphraser
Investment Analysis and Portfolio Management 5
the popular currencies in the USD to INR rate. The current inflation rate is 5.20% and, currently,
1 Indian rupee is equivalent to 0.016 US Dollar (Bode, Kane & Marcus 2005).
Employment and unemployment rates
The country’s population of 1,374.62m offers cheap labor hence a contributing factor in
the economic growth witnessed over the past years. The unemployment rate currently is 4.1%
leading to shift as the economic rate stagnates. The country’s economic growth slowdown since
and dynamically influences with the country's demography. The large population gives the
country cheap labor and out of 765.31 million economically viable persons in China 753.21
million are currently employed totaling to 70.8 %. Statistics dating back to 2016 shows that 27.7
% of the workforce are employed in agriculture, 28.8 % in industry and 43.5 % in services (What
Investment 2015).
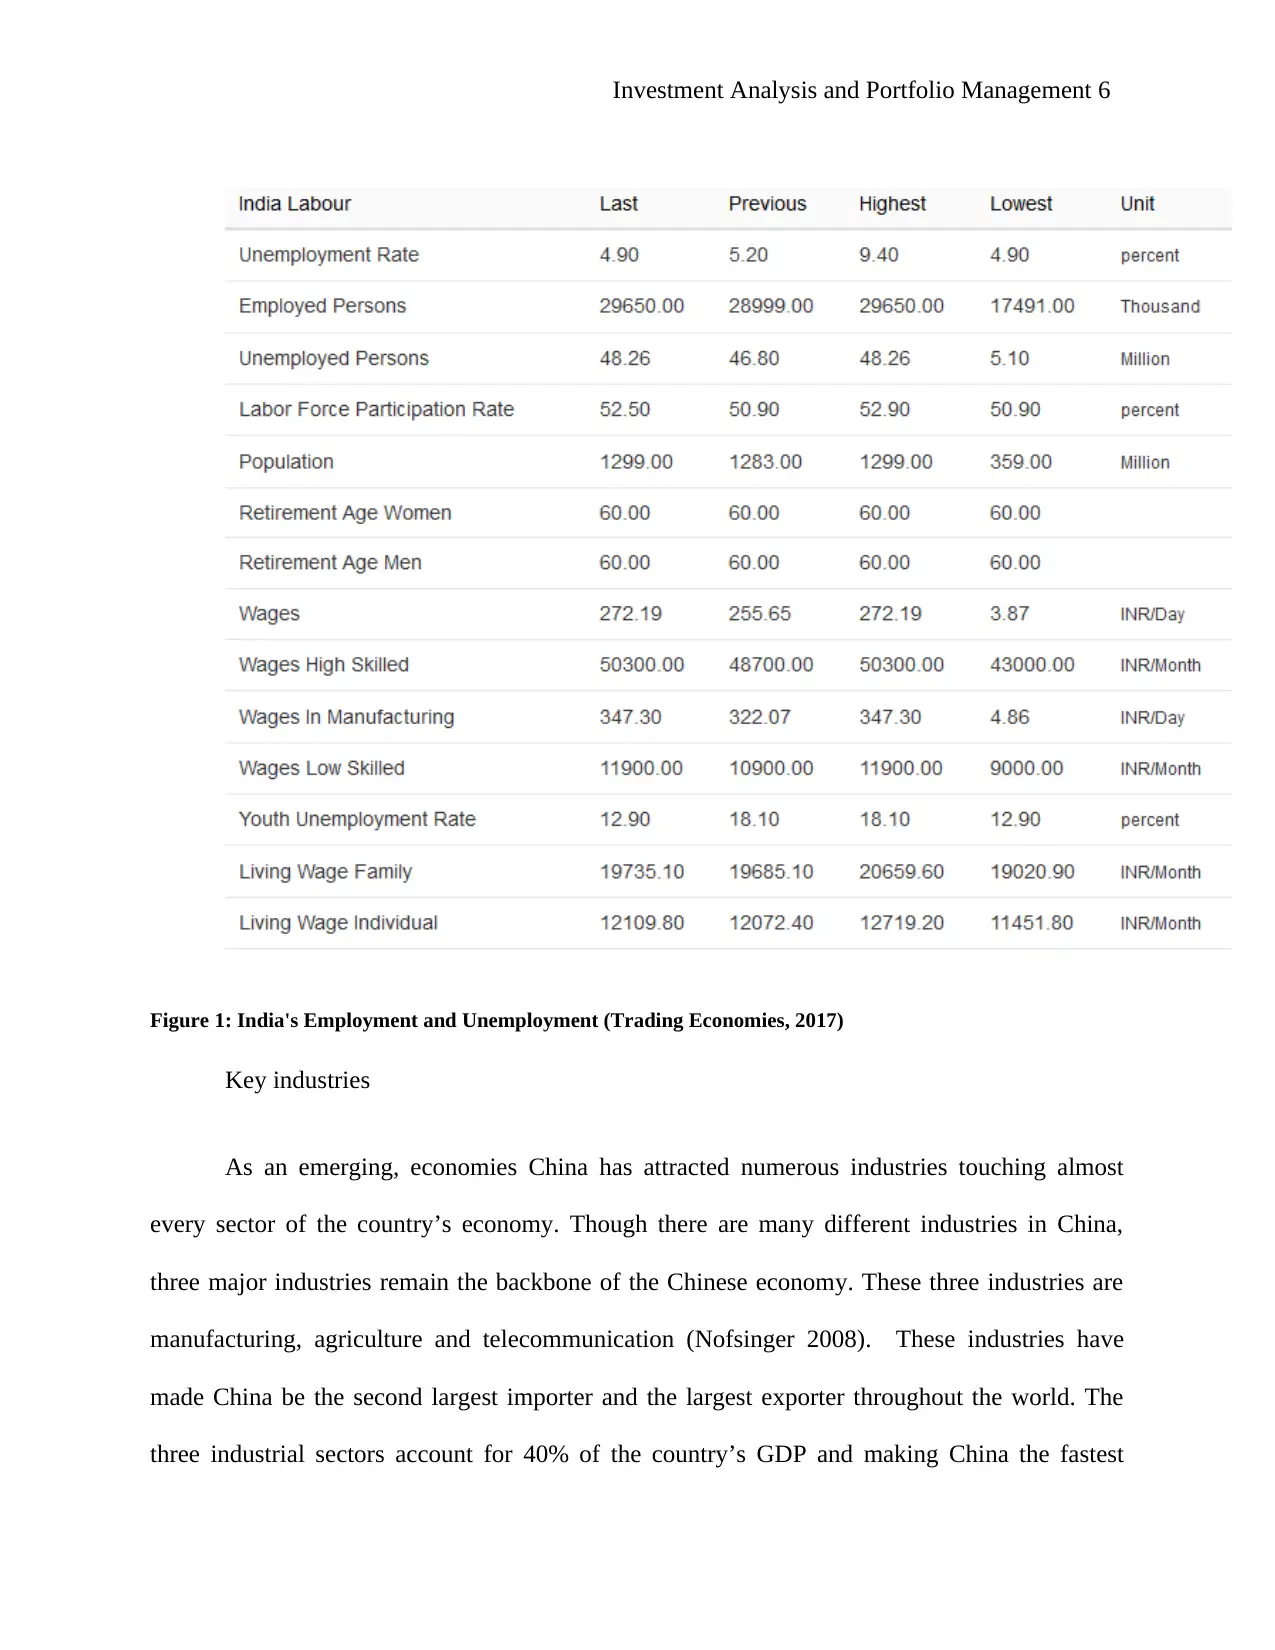
India has seen its rate of unemployment decreasing since 2012 where the unemployment
rate was 5.20% and in 2013 the rate decline to 4.90%. The decrease in the unemployment rate
has shown positive with the highest unemployment rate being in 2009 where the rate was 9.40%.
the employment rate is also expected to increase to The composition of the employment and
unemployment rate and population can be well described by Www.Tradingeconomics.Com
(2017).
the popular currencies in the USD to INR rate. The current inflation rate is 5.20% and, currently,
1 Indian rupee is equivalent to 0.016 US Dollar (Bode, Kane & Marcus 2005).
Employment and unemployment rates
The country’s population of 1,374.62m offers cheap labor hence a contributing factor in
the economic growth witnessed over the past years. The unemployment rate currently is 4.1%
leading to shift as the economic rate stagnates. The country’s economic growth slowdown since
and dynamically influences with the country's demography. The large population gives the
country cheap labor and out of 765.31 million economically viable persons in China 753.21
million are currently employed totaling to 70.8 %. Statistics dating back to 2016 shows that 27.7
% of the workforce are employed in agriculture, 28.8 % in industry and 43.5 % in services (What
Investment 2015).
India has seen its rate of unemployment decreasing since 2012 where the unemployment
rate was 5.20% and in 2013 the rate decline to 4.90%. The decrease in the unemployment rate
has shown positive with the highest unemployment rate being in 2009 where the rate was 9.40%.
the employment rate is also expected to increase to The composition of the employment and
unemployment rate and population can be well described by Www.Tradingeconomics.Com
(2017).
Investment Analysis and Portfolio Management 6
Figure 1: India's Employment and Unemployment (Trading Economies, 2017)
Key industries
As an emerging, economies China has attracted numerous industries touching almost
every sector of the country’s economy. Though there are many different industries in China,
three major industries remain the backbone of the Chinese economy. These three industries are
manufacturing, agriculture and telecommunication (Nofsinger 2008). These industries have
made China be the second largest importer and the largest exporter throughout the world. The
three industrial sectors account for 40% of the country’s GDP and making China the fastest
⊘ This is a preview!⊘
Do you want full access?
Subscribe today to unlock all pages.
Trusted by 1+ million students worldwide

Investment Analysis and Portfolio Management 7
growing market. In the manufacturing sector, for instance, the country remains the largest
manufacturer and exporter than any other country. Some major products are textiles, aluminum,
cement, electronics, rail cars, steel, chemicals, ships, toys, iron, aircraft and many other products.
Agricultural sectors produce millet, wheat, soybeans, tobacco, oilseeds, peanuts, pork, corn, fish,
tea, and potatoes. Telecommunication industry is dominated by Microsoft and IBM coupled with
increase cloud computing (Gitman & Joehnk 2008).
India economy is the 9th largest economy in the world that and one of the first growing
economies. India is also coupling China as the two largest emerging economies with a significant
role in the global economy. Similar to China, India is also dominated by three main industries
forming the economy and these are manufacturing, service and agricultural industries (Trading
Economics 2017). Manufacturing industries currently account for 27% while service industries
account for 57% of the GDP. Some of the top industries are textile industry, tourism, chemical
industry, transport, telecommunication, banking, retailing, and agriculture and real estate
industries. The largest industry in India remains retailing and wholesale industry accounting for
23% of the GDP followed by agriculture at 15.7% (Dev, & Rao 2009).
Current account
According to Xiangyan (2015), China current account gives a surplus of $196.4 billion
declining by 14% registered in 2015 where the country had a surplus of $494.1 billion in goods-
trade. Service trade, on the other hand, had a deficit of $244.2 billion, translating to 12 % within
a year. In the capital and financial account, a total surplus of $26.3 billion was witnessed in
20016 with a deficit of $300 million recorded in the capital account giving a deficit of $417
Paraphrase This Document
Need a fresh take? Get an instant paraphrase of this document with our AI Paraphraser
Investment Analysis and Portfolio Management 8
billion within the non-reserve financial account. Therefore, Chinese authorities indicate that it is
expected that cross-border capital movement will gradually become balanced before the end of
the year (Arnold 2010).
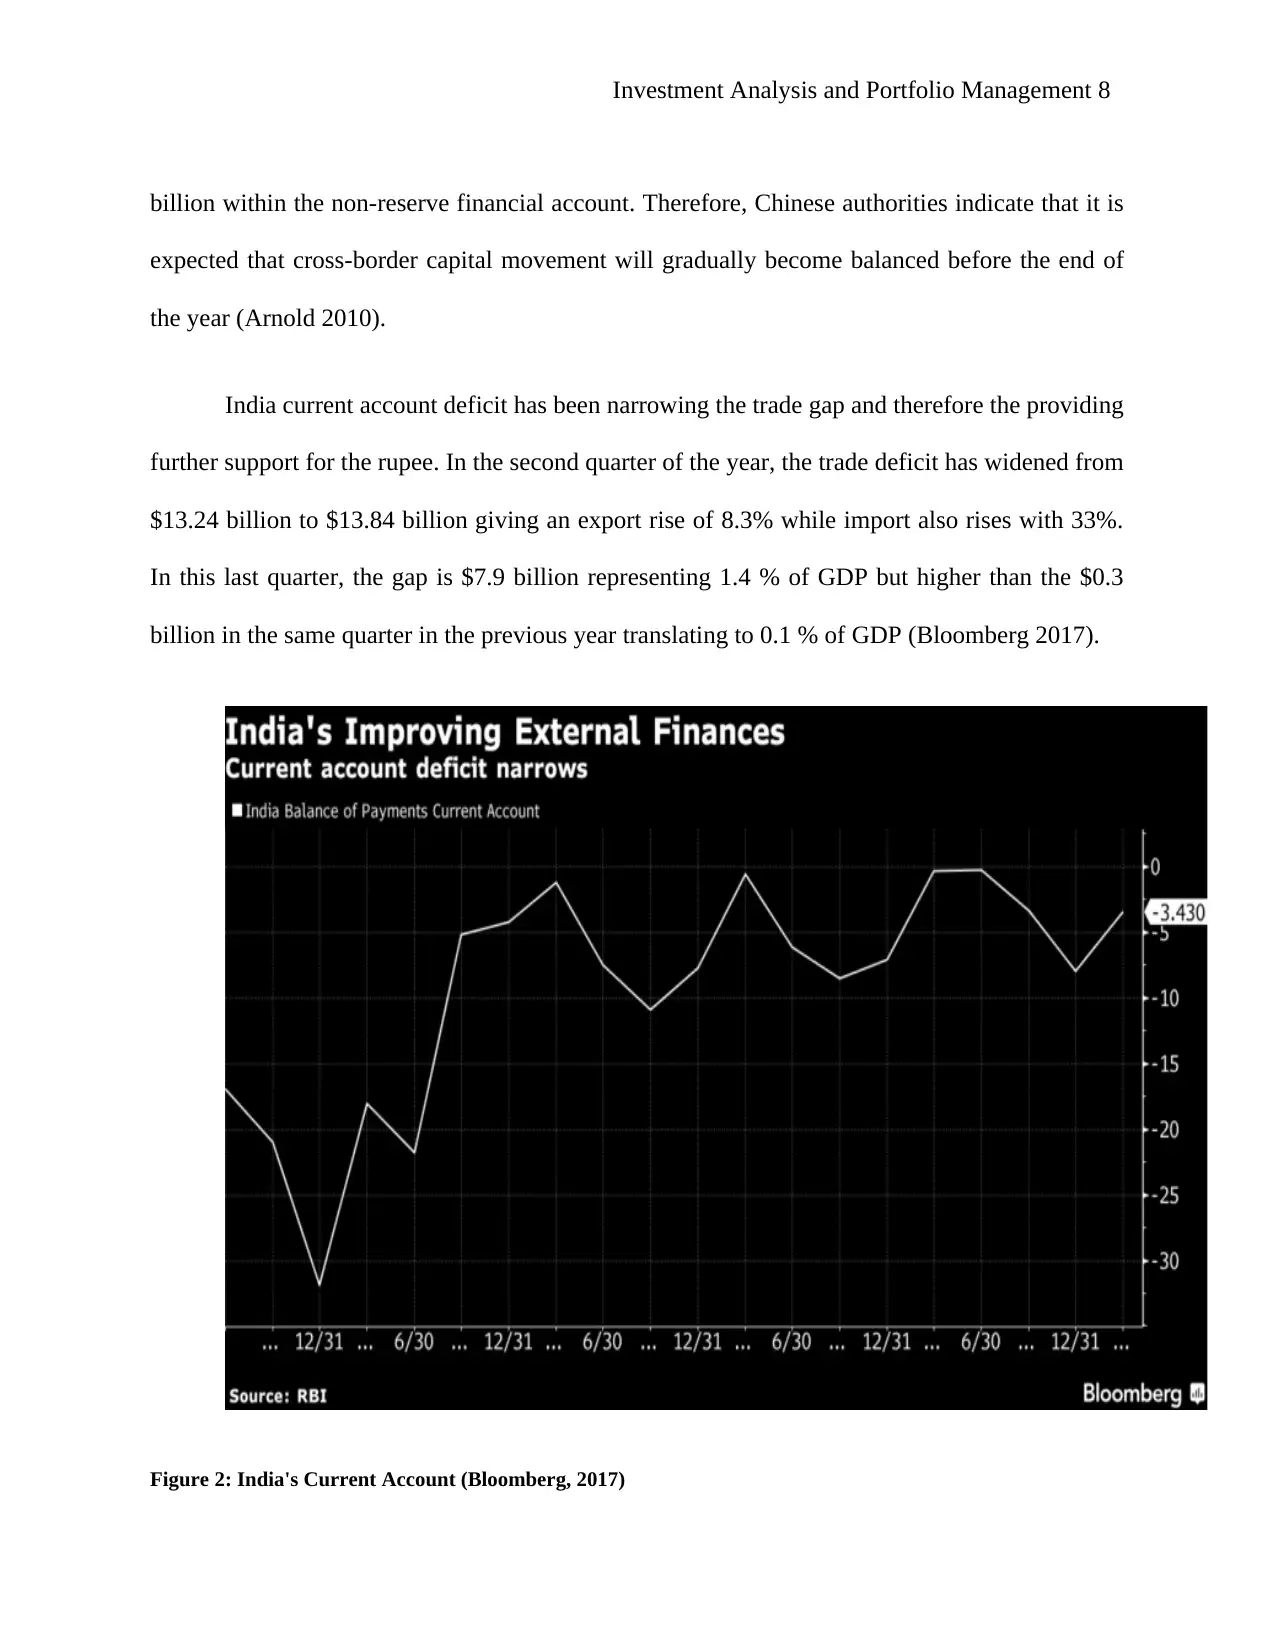
India current account deficit has been narrowing the trade gap and therefore the providing
further support for the rupee. In the second quarter of the year, the trade deficit has widened from
$13.24 billion to $13.84 billion giving an export rise of 8.3% while import also rises with 33%.
In this last quarter, the gap is $7.9 billion representing 1.4 % of GDP but higher than the $0.3
billion in the same quarter in the previous year translating to 0.1 % of GDP (Bloomberg 2017).
Figure 2: India's Current Account (Bloomberg, 2017)
billion within the non-reserve financial account. Therefore, Chinese authorities indicate that it is
expected that cross-border capital movement will gradually become balanced before the end of
the year (Arnold 2010).
India current account deficit has been narrowing the trade gap and therefore the providing
further support for the rupee. In the second quarter of the year, the trade deficit has widened from
$13.24 billion to $13.84 billion giving an export rise of 8.3% while import also rises with 33%.
In this last quarter, the gap is $7.9 billion representing 1.4 % of GDP but higher than the $0.3
billion in the same quarter in the previous year translating to 0.1 % of GDP (Bloomberg 2017).
Figure 2: India's Current Account (Bloomberg, 2017)
Investment Analysis and Portfolio Management 9
Performance of major assets
Assets performance in China has generally increased since 2016 with a high return on
built assets. The overall high return on assets comes as a result of economic growth based on its
built assets. In 2016 the built assets register high return of 52.9% of GDP totaling to 10.4tn. The
growth of assets in the China’s market is expected to rise by 6.3% annually for the next five
years to reach the climax of $17.85 billion in 2021 (China Daily 2017).
Performance of fixed interest
Throughout the third quarter of 2016 the financial market has stabilized with the total
turnover reaching RMB 202.8 trillion according to People’s Bank of China (PBOC) reflecting a
year on year increase of 41.7% (Tsui, et al 2017). In the final quarter, the currency total turnover
reached RMB 59.3 trillion recording an increase of 29.5% YoY and 19.9% decrease in a month
on month. To this effect, the Chinese government continues to adopt policies that aim at making
the economy to steady hence the yield curve fluctuate for all bond in some degree. Interbank
bond market, on the other hand, registered YoY increase of 46.2% totaling to RMB 36.4 trillion
while RMB 11.2 trillion turnovers were registered towards the end of the fourth quarter of 2016
representing a YoY increase of 32.0% or 10.8% decrease month on month (Tang 2010, pp. 52–
53). Commodity price index also registered high turnover in the third quarter as compared to the
previous year. This was represented by 14.1% as compared to 33.1% experienced at the
beginning of the year. Property assets performance has total to RMB 7.4598 trillion which a
represent YoY increase of 5.8% and this was without any impact on the property price. Of this
⊘ This is a preview!⊘
Do you want full access?
Subscribe today to unlock all pages.
Trusted by 1+ million students worldwide
Investment Analysis and Portfolio Management 10
27.1% increase was recorded on the residential property assets only. Commodity housing
property assets have totaled to RMB 8.0208 trillion, representing a YoY increase of 41.3%,
while sales of residential property assets increased by 43.2%. The stock performance has been
equally good with joint-stock commercial banks’ liabilities growing a little bit faster and GYB
registered an increase of 36.55% being the highest followed by BON that has 27.71% and
CMBC with 25.88%. The increase can be attributed to increases in customer deposit thereby
increasing bond payable. In the third quarter of 2016, customer deposit reached RMB 91.12
trillion that represents 9% increase when compared to the previous year (Sinha 2004, pp 25–63).
India is an investment hub that attracts many investors throughout the globe due to its varied
investment environment characterized by vigorous economic reforms. The stock has been on the gaining
track that can be traced for the last 10 years at the rate of 142% as evident by Bombay Stock
Exchange. Modi's current government has come up with a strategy on the business policies that
aim to make the country’s GDP reach 25% by 2020. Therefore, the country is most likely to
grow as result of boost manufacturing sector that aim at reaching 25% GDP. This is higher given
that in 2013, manufacturing was contributing nearly 13% of the GDP (What Investment 2015).
Paraphrase This Document
Need a fresh take? Get an instant paraphrase of this document with our AI Paraphraser
Investment Analysis and Portfolio Management 11
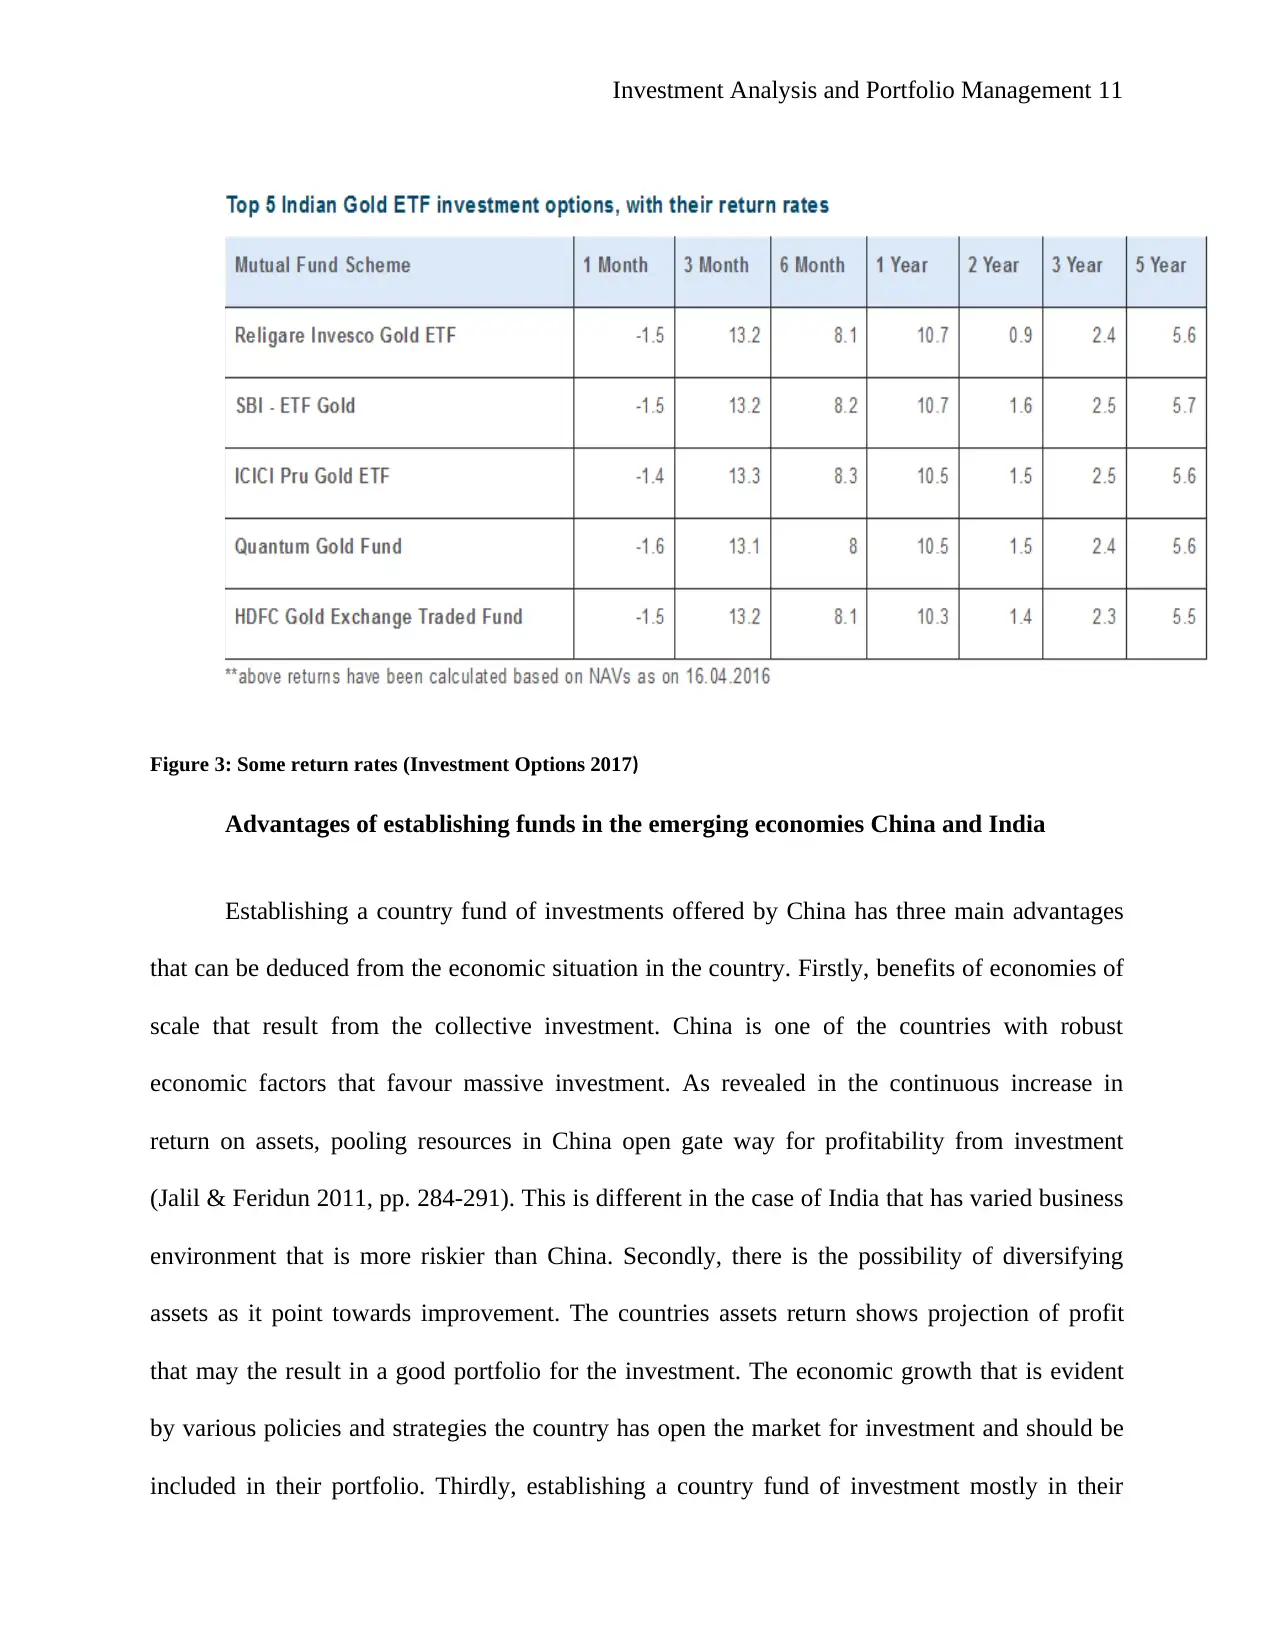
Figure 3: Some return rates (Investment Options 2017)
Advantages of establishing funds in the emerging economies China and India
Establishing a country fund of investments offered by China has three main advantages
that can be deduced from the economic situation in the country. Firstly, benefits of economies of
scale that result from the collective investment. China is one of the countries with robust
economic factors that favour massive investment. As revealed in the continuous increase in
return on assets, pooling resources in China open gate way for profitability from investment
(Jalil & Feridun 2011, pp. 284-291). This is different in the case of India that has varied business
environment that is more riskier than China. Secondly, there is the possibility of diversifying
assets as it point towards improvement. The countries assets return shows projection of profit
that may the result in a good portfolio for the investment. The economic growth that is evident
by various policies and strategies the country has open the market for investment and should be
included in their portfolio. Thirdly, establishing a country fund of investment mostly in their
Investment Analysis and Portfolio Management 12
portfolio draw pool of investment managers that manage the investment reduces risk and
maximizing return on investment (Xiangyan 2015).
Disadvantages of establishing fund investment in China and India
Establishing a country fund of investment in China and India is also coupled with some
disadvantages. Firstly, the cost is most likely to be high given the types of the portfolio that are
in the country especially assets. The investment will require the investors to hire managers that
have the capability to monitor the changes in the value of the assets depending on the market
fluctuation (Hsu & Hasmath 2013, p. 124). The costly nature of investment applies to both China
and India as both countries share many business environmental factors. Secondly, diversification
of investments follows the prevailing assets in the market and therefore restricts investors to
certain market characteristics giving investor limited choice. The current prevailing market
return on investment in China shows is advantageous than India given the regulatory policies in
an India are a striker (Investment Options 2017). Finally, collective investment reduces the
individual right over the investment since the pool of investors controls of the investment.
Conclusion
In conclusion, based on the investment analysis and portfolio management analysis the
two emerging economies of India and China presents different market environment for
investment. Based on the economic growth China remains the good country to invest in its
policies and marketing environment favor foreign investment. Over the past years China has
experienced an increasing return on the capital investment, especially on the assets. For instance,
over the third quarter of the year 2016 a witnessed increase of 41.7% in the total turnover as
⊘ This is a preview!⊘
Do you want full access?
Subscribe today to unlock all pages.
Trusted by 1+ million students worldwide
1 out of 16
Related Documents


Your All-in-One AI-Powered Toolkit for Academic Success.
+13062052269
info@desklib.com
Available 24*7 on WhatsApp / Email
![[object Object]](/_next/static/media/star-bottom.7253800d.svg)
Unlock your academic potential
Copyright © 2020–2026 A2Z Services. All Rights Reserved. Developed and managed by ZUCOL.