Investment Portfolio Project

Verified

Added on  2019/09/18

|7
|424
|234
Project
AI Summary
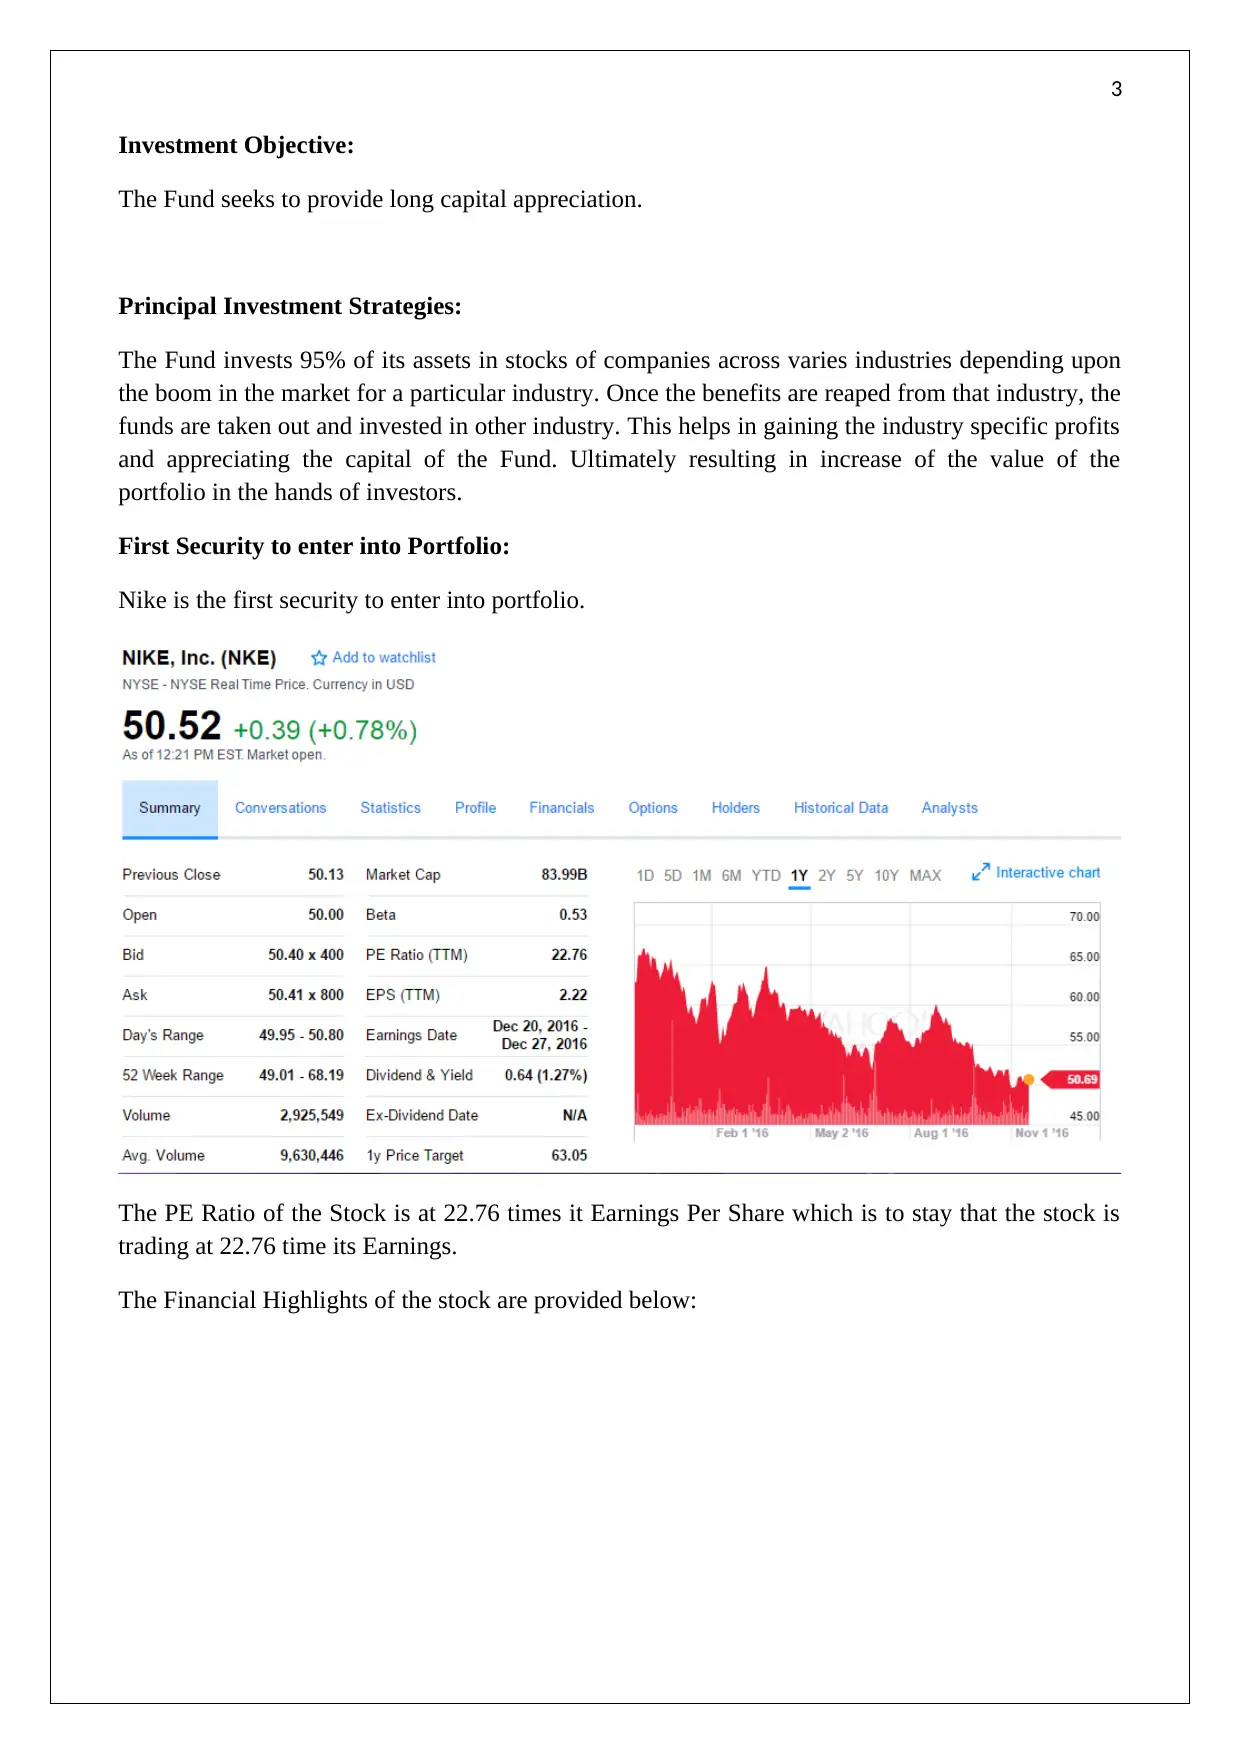
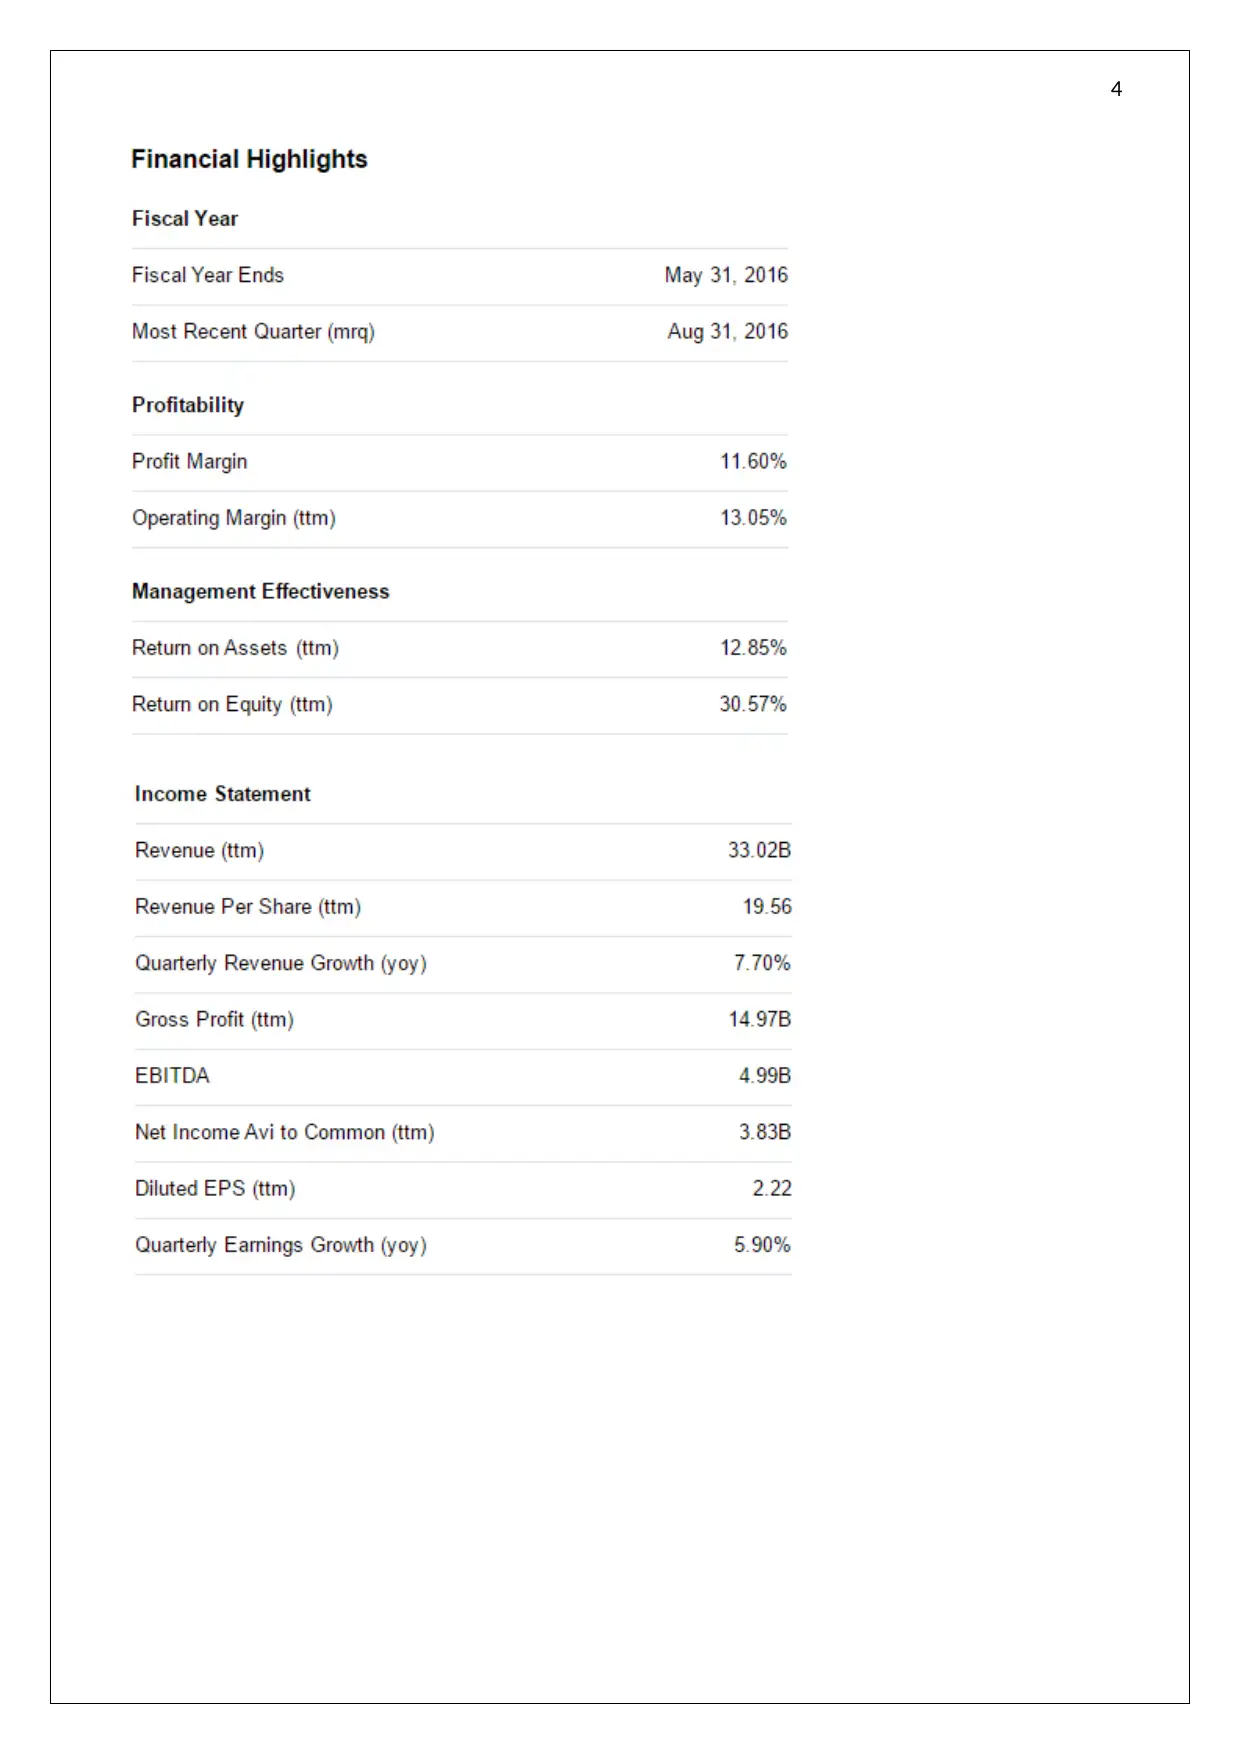
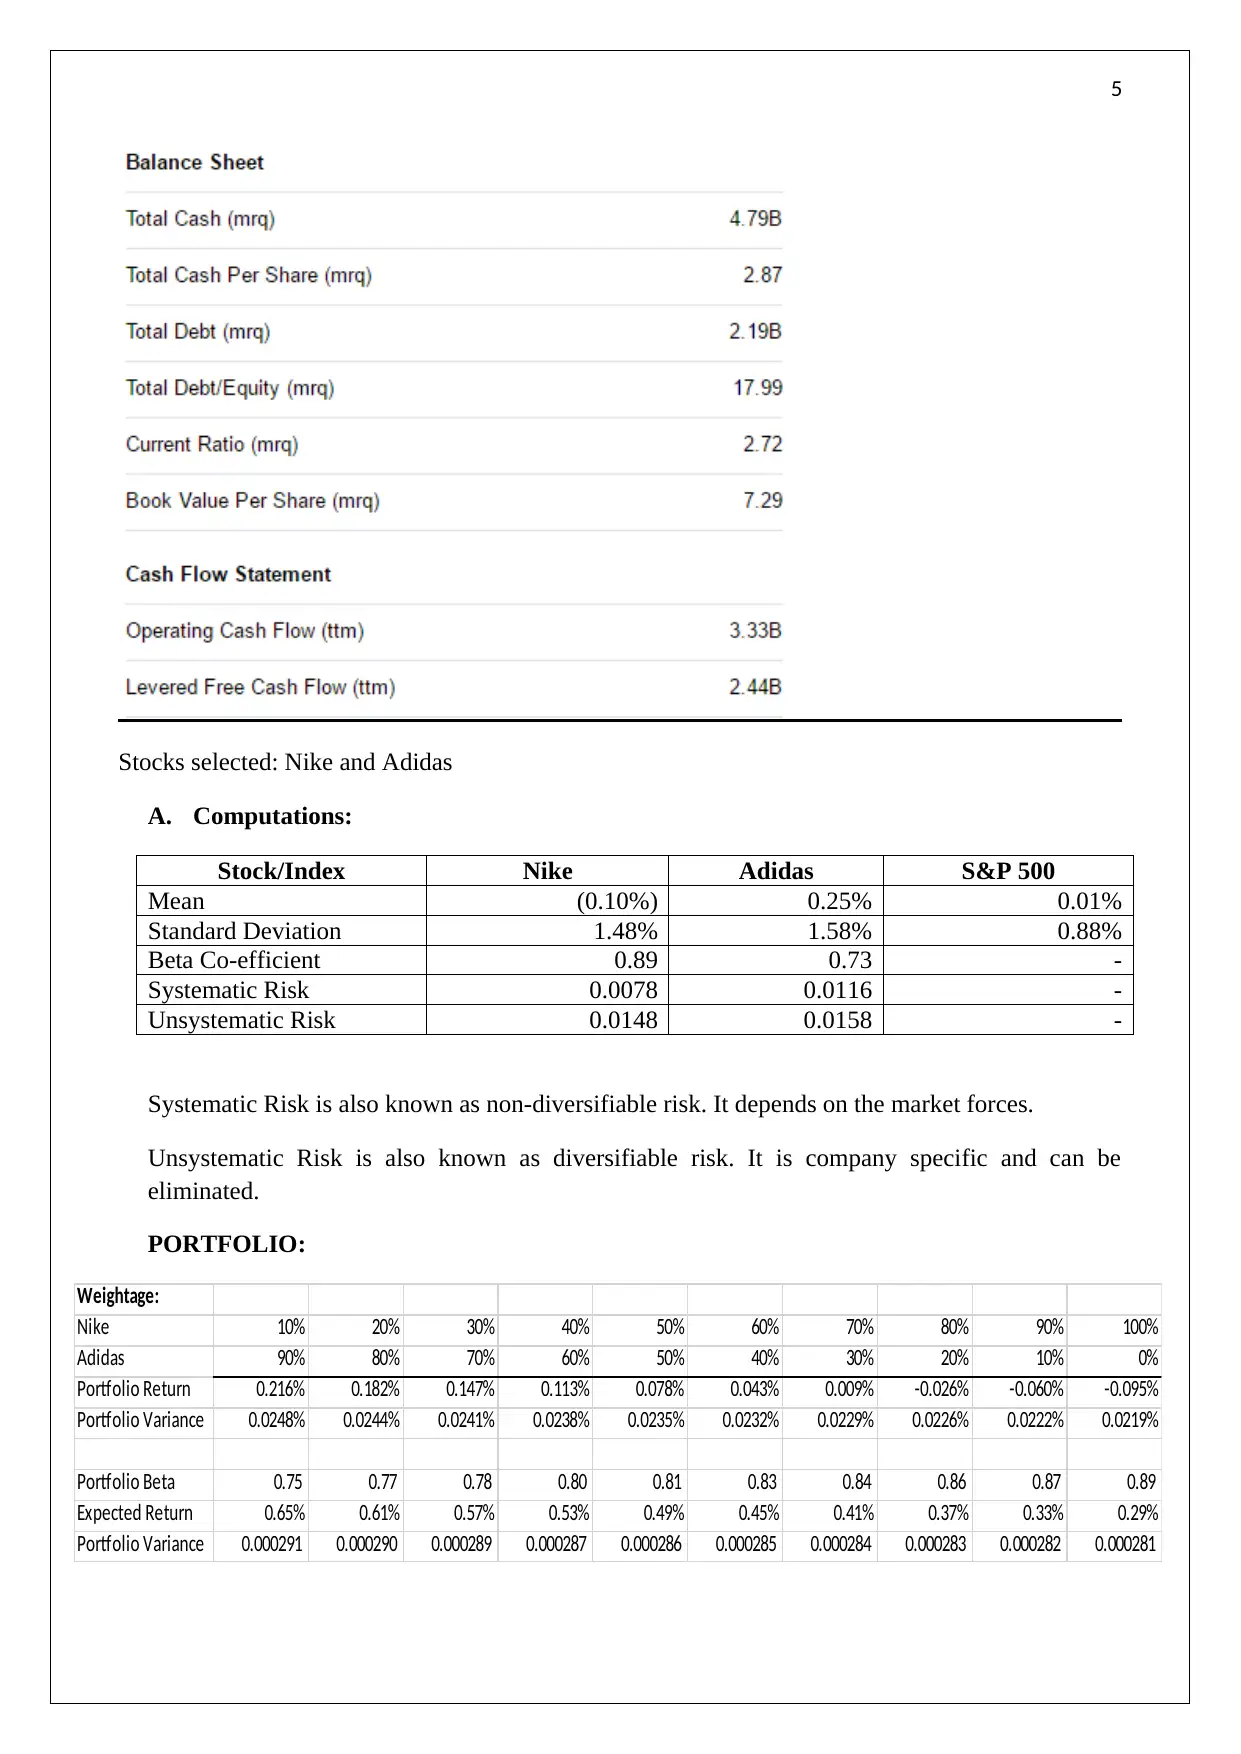
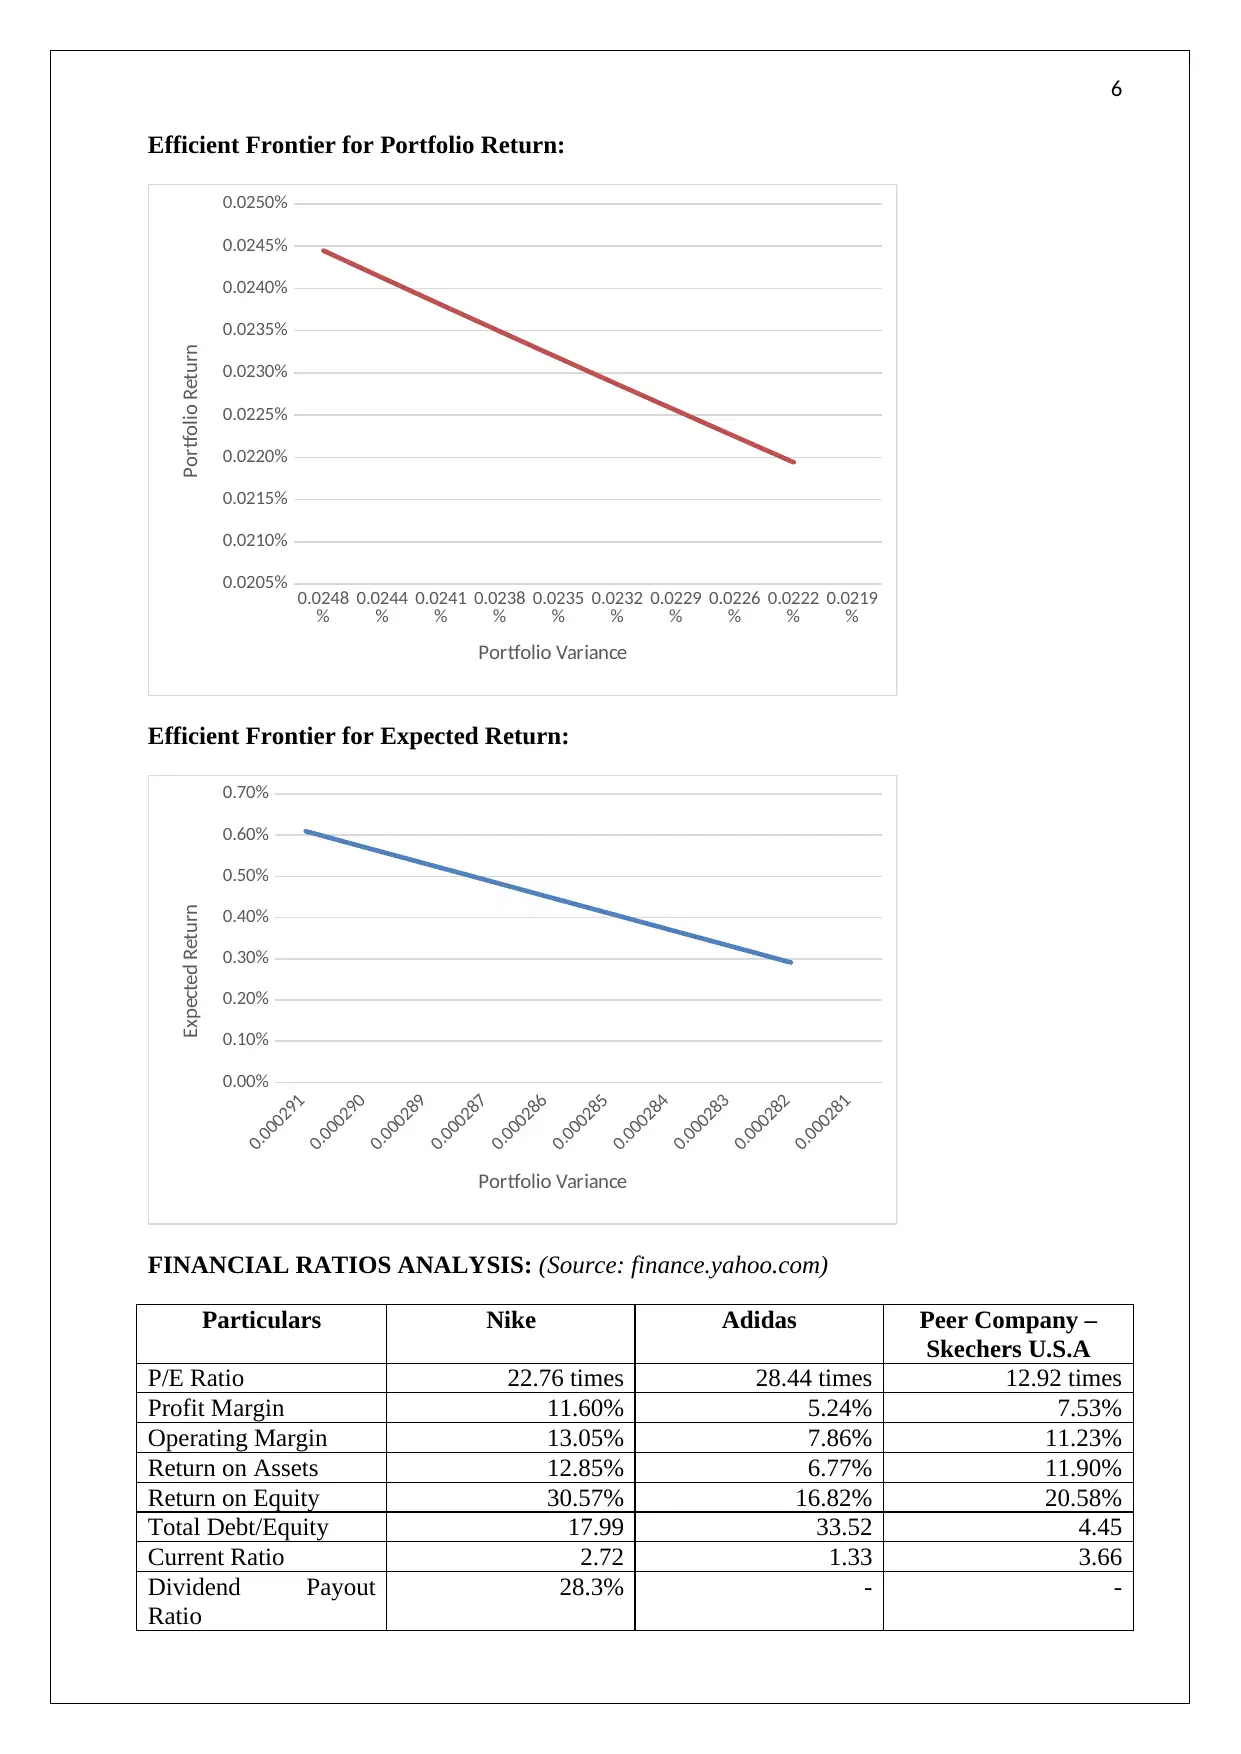
This document presents an investment portfolio project focused on long-term capital appreciation. The strategy involves investing in stocks across various industries, capitalizing on market booms, and reallocating funds for optimal returns. The portfolio initially includes Nike, with a detailed analysis of its financial highlights, followed by computations of mean, standard deviation, beta coefficient, systematic risk, and unsystematic risk for Nike and Adidas. The project also includes a financial ratio analysis comparing Nike, Adidas, and Skechers, evaluating P/E ratio, profit margin, operating margin, return on assets, return on equity, debt-to-equity ratio, current ratio, dividend payout ratio, and beta. The analysis concludes that while Adidas has a higher P/E ratio, Nike demonstrates better performance in profitability and returns, with Adidas being more leveraged.
Document Page
1
INVESTMENT PORTFOLIO PROJECT
tabler-icon-diamond-filled.svg

Paraphrase This Document

Need a fresh take? Get an instant paraphrase of this document with our AI Paraphraser
Document Page
2
Table of Contents
INVESTMENT STRATEGY 3
FIRST SECURITY TO ENTER THE PORTFOLIO 3-5
COMPUTATIONS 5-6
FINANCIAL RATIOS ANALYSIS 6-7
Document Page
3
Investment Objective:
The Fund seeks to provide long capital appreciation.
Principal Investment Strategies:
The Fund invests 95% of its assets in stocks of companies across varies industries depending upon
the boom in the market for a particular industry. Once the benefits are reaped from that industry, the
funds are taken out and invested in other industry. This helps in gaining the industry specific profits
and appreciating the capital of the Fund. Ultimately resulting in increase of the value of the
portfolio in the hands of investors.
First Security to enter into Portfolio:
Nike is the first security to enter into portfolio.
The PE Ratio of the Stock is at 22.76 times it Earnings Per Share which is to stay that the stock is
trading at 22.76 time its Earnings.
The Financial Highlights of the stock are provided below:
Document Page
4
tabler-icon-diamond-filled.svg

Paraphrase This Document

Need a fresh take? Get an instant paraphrase of this document with our AI Paraphraser
Document Page
5
Stocks selected: Nike and Adidas
A. Computations:
Stock/Index Nike Adidas S&P 500
Mean (0.10%) 0.25% 0.01%
Standard Deviation 1.48% 1.58% 0.88%
Beta Co-efficient 0.89 0.73 -
Systematic Risk 0.0078 0.0116 -
Unsystematic Risk 0.0148 0.0158 -
Systematic Risk is also known as non-diversifiable risk. It depends on the market forces.
Unsystematic Risk is also known as diversifiable risk. It is company specific and can be
eliminated.
PORTFOLIO:
Weightage:
Nike 10% 20% 30% 40% 50% 60% 70% 80% 90% 100%
Adidas 90% 80% 70% 60% 50% 40% 30% 20% 10% 0%
Portfolio Return 0.216% 0.182% 0.147% 0.113% 0.078% 0.043% 0.009% -0.026% -0.060% -0.095%
Portfolio Variance 0.0248% 0.0244% 0.0241% 0.0238% 0.0235% 0.0232% 0.0229% 0.0226% 0.0222% 0.0219%
Portfolio Beta 0.75 0.77 0.78 0.80 0.81 0.83 0.84 0.86 0.87 0.89
Expected Return 0.65% 0.61% 0.57% 0.53% 0.49% 0.45% 0.41% 0.37% 0.33% 0.29%
Portfolio Variance 0.000291 0.000290 0.000289 0.000287 0.000286 0.000285 0.000284 0.000283 0.000282 0.000281
Document Page
6
Efficient Frontier for Portfolio Return:
0.0248
% 0.0244
% 0.0241
% 0.0238
% 0.0235
% 0.0232
% 0.0229
% 0.0226
% 0.0222
% 0.0219
%
0.0205%
0.0210%
0.0215%
0.0220%
0.0225%
0.0230%
0.0235%
0.0240%
0.0245%
0.0250%
Portfolio Variance
Portfolio Return
Efficient Frontier for Expected Return:
0.000291
0.000290
0.000289
0.000287
0.000286
0.000285
0.000284
0.000283
0.000282
0.000281
0.00%
0.10%
0.20%
0.30%
0.40%
0.50%
0.60%
0.70%
Portfolio Variance
Expected Return
FINANCIAL RATIOS ANALYSIS: (Source: finance.yahoo.com)
Particulars Nike Adidas Peer Company –
Skechers U.S.A
P/E Ratio 22.76 times 28.44 times 12.92 times
Profit Margin 11.60% 5.24% 7.53%
Operating Margin 13.05% 7.86% 11.23%
Return on Assets 12.85% 6.77% 11.90%
Return on Equity 30.57% 16.82% 20.58%
Total Debt/Equity 17.99 33.52 4.45
Current Ratio 2.72 1.33 3.66
Dividend Payout
Ratio
28.3% - -
Document Page
7
Beta 0.53 - 0.2
In terms of P/E Ratio, Adidas is trading at highest multiple of its Earnings, however Nike is a
better performer in terms of Profit and Operating Margin. Also Nike has a better edger over other
peers in terms of Return earned on the Assets and Equity introduced. Adidas is highly levered as
its debt component is huge. This might be one of the reasons for lower profits as debt involves
fixed interest payments.
chevron_up_icon
1 out of 7
circle_padding
hide_on_mobile
zoom_out_icon
[object Object]