Investment Portfolio Project: Analysis and Financial Ratios

Verified

Added on  2019/09/13

|7
|474
|312
Project
AI Summary
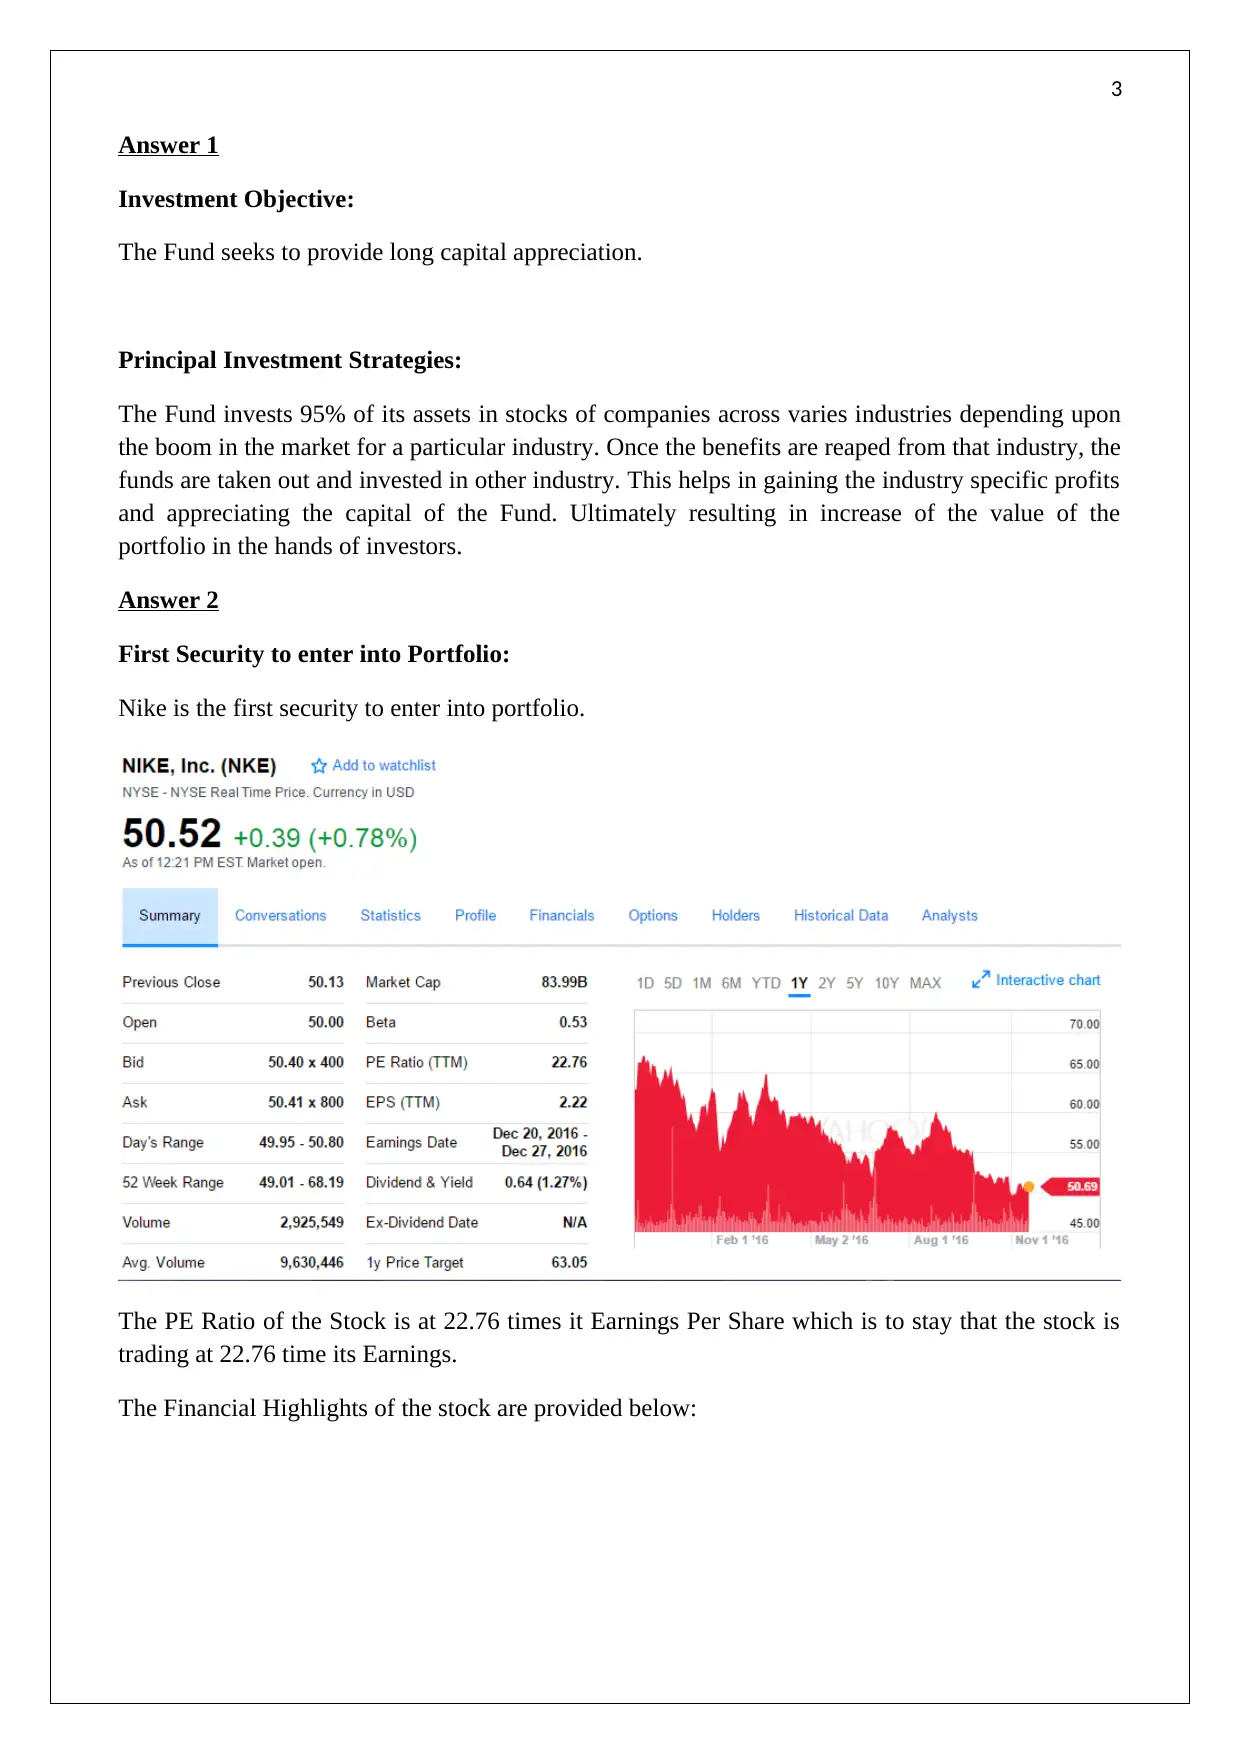
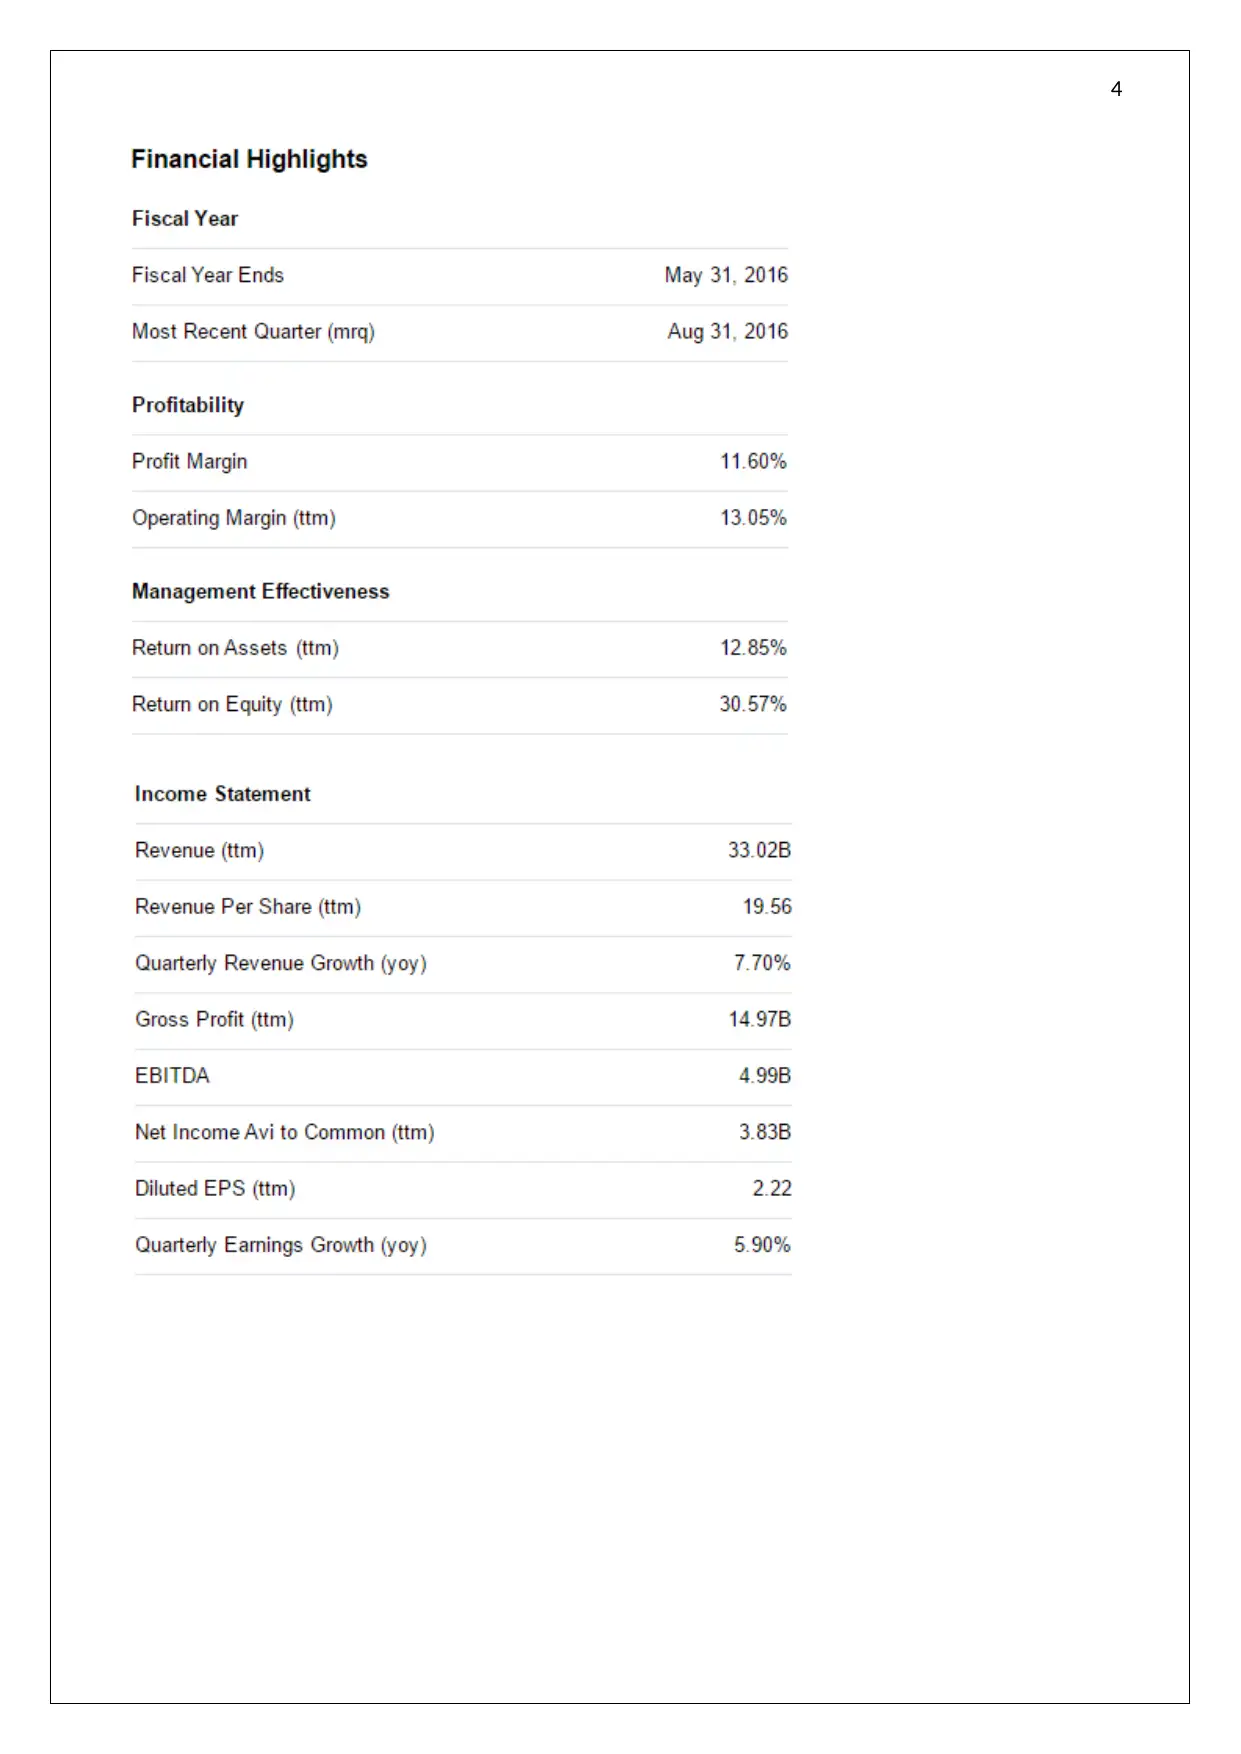
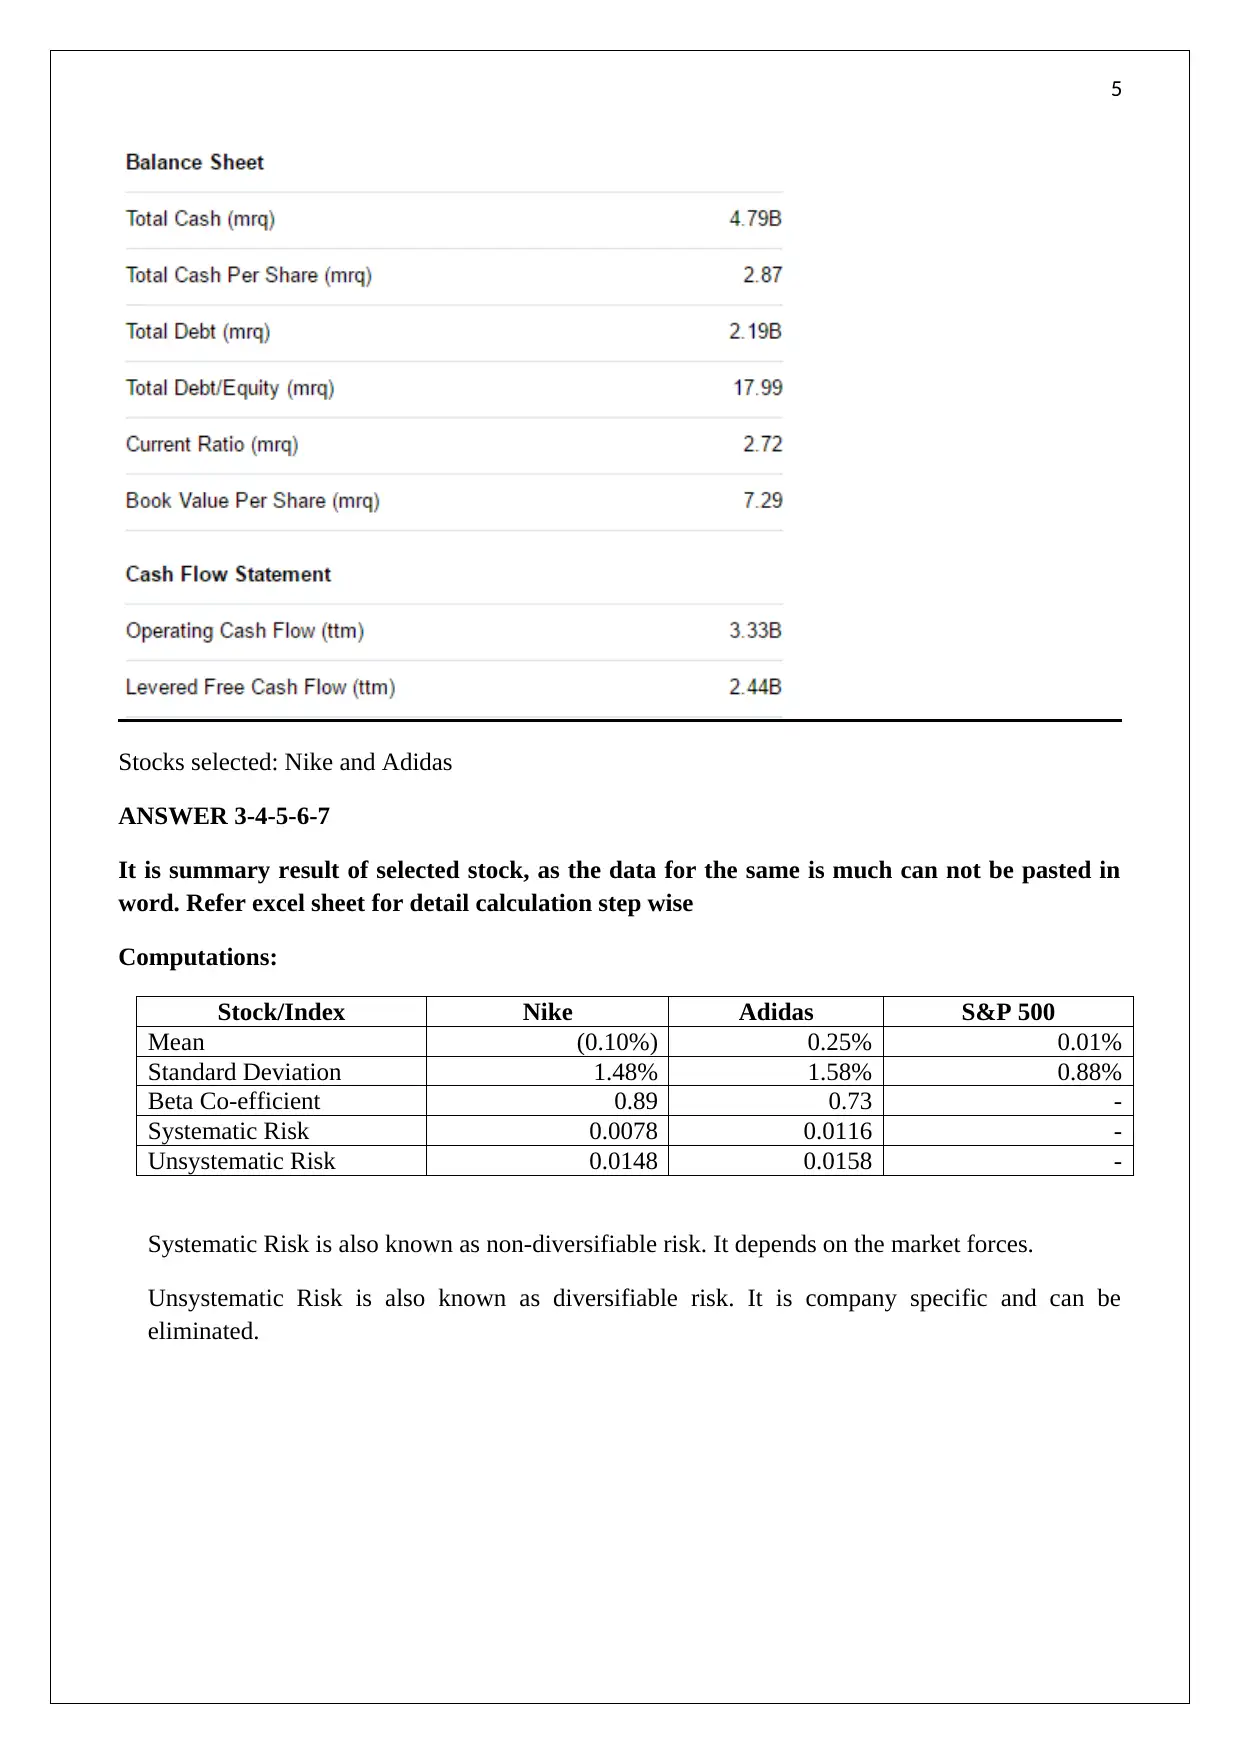
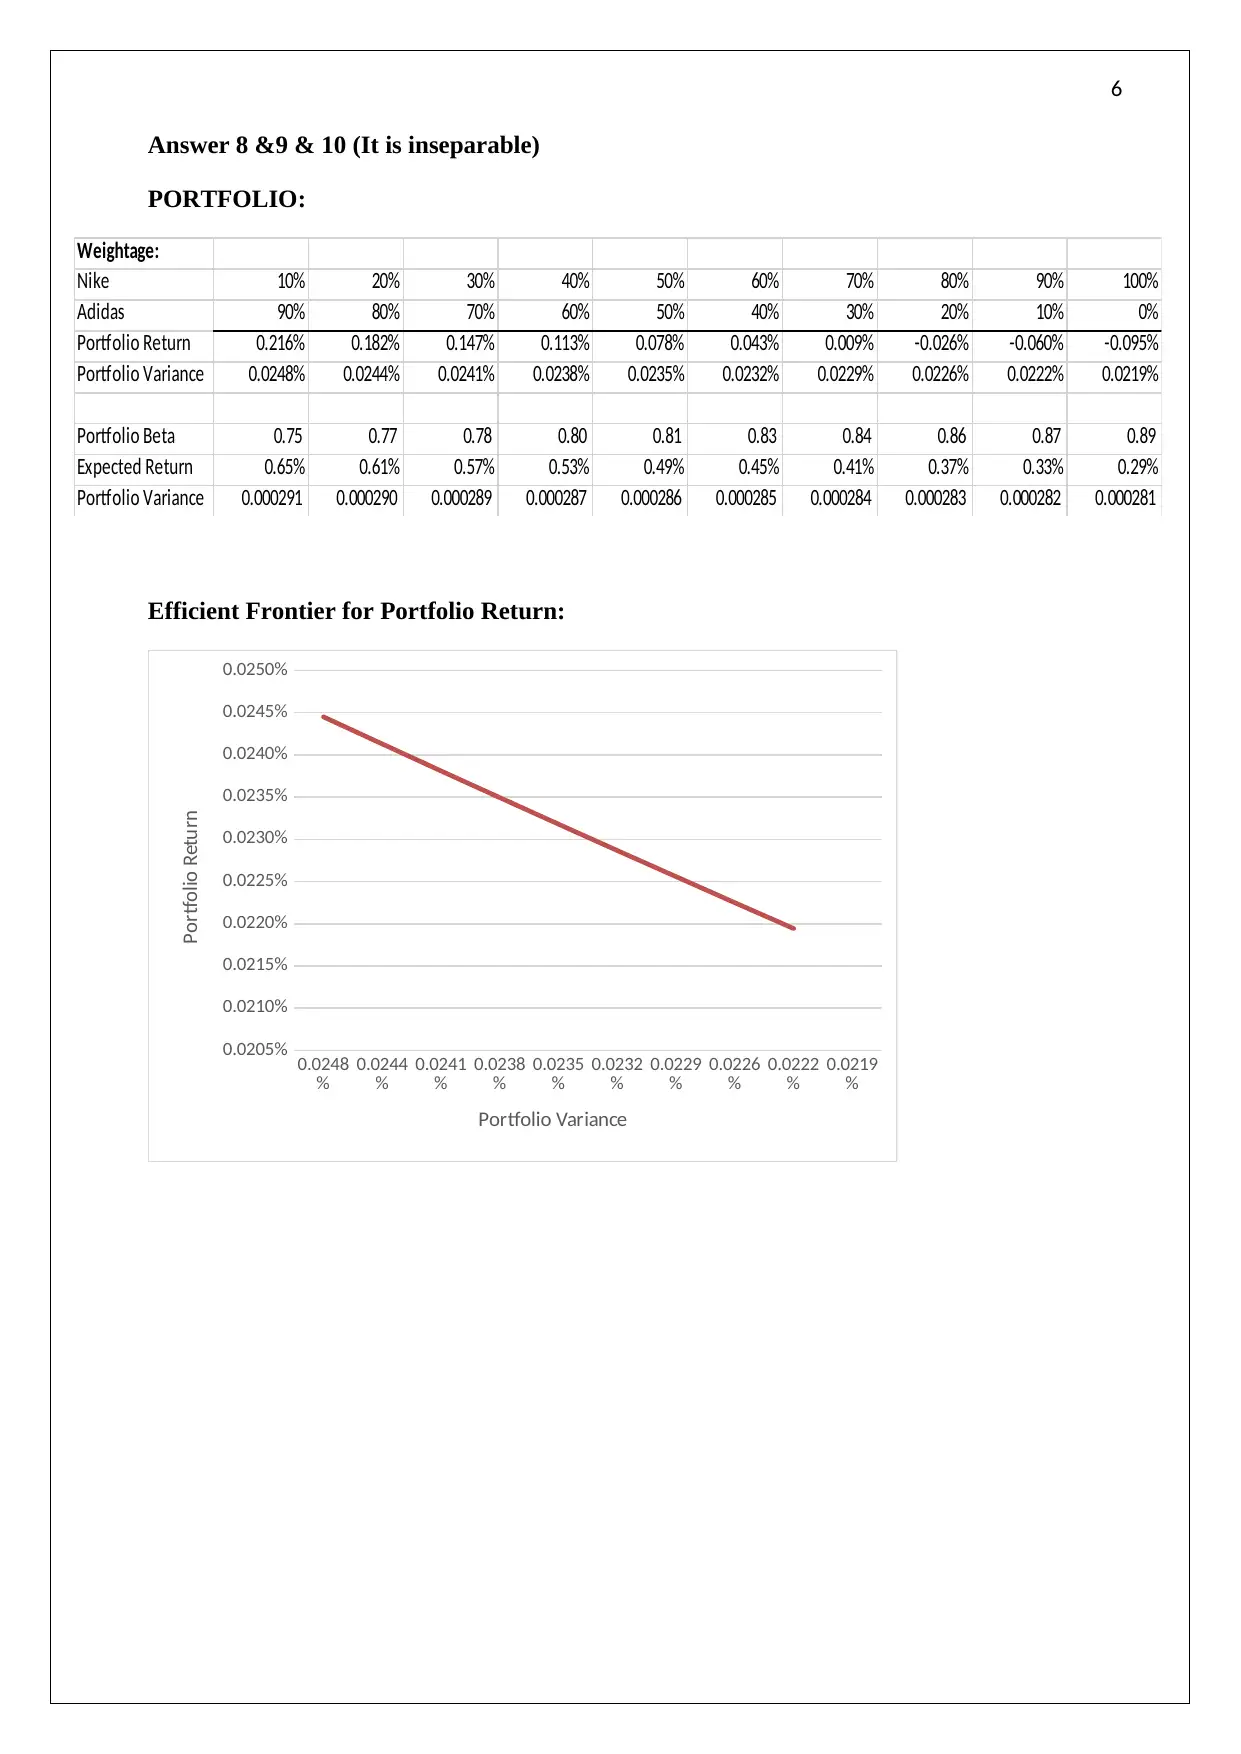
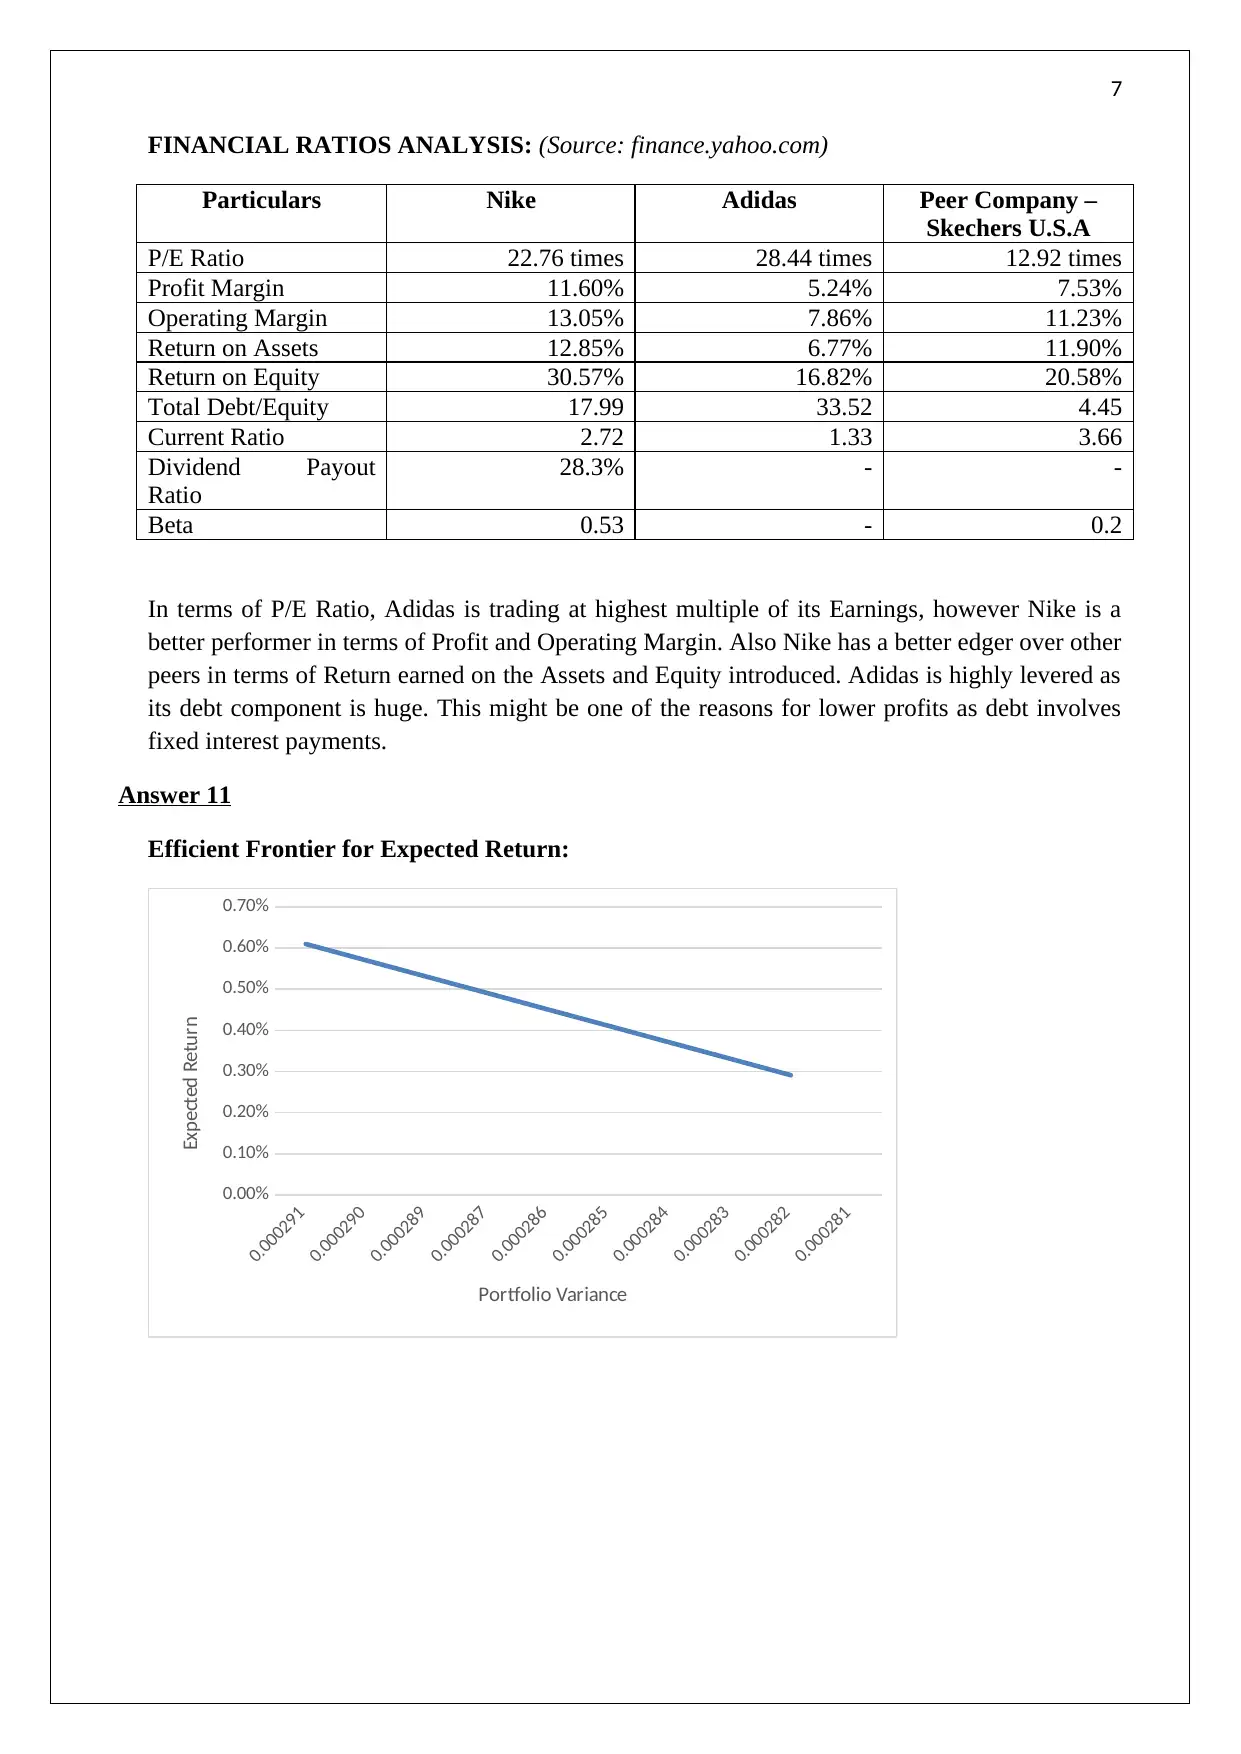
This investment portfolio project focuses on analyzing investment strategies and financial ratios. The project begins by outlining an investment objective focused on capital appreciation and describes the initial investment in Nike stock. The analysis includes financial highlights, computations of stock performance (Nike and Adidas), and a discussion of systematic and unsystematic risk. The project further explores financial ratios for Nike, Adidas, and a peer company, Skechers, evaluating P/E ratio, profit and operating margins, return on assets and equity, debt/equity, current ratio, and dividend payout. The comparison highlights the strengths and weaknesses of each company based on these metrics. The project also touches on the efficient frontier for portfolio return and expected return, though detailed calculations are not fully presented within the provided text. This project offers insights into investment decision-making and portfolio construction.
Document Page
1
INVESTMENT PORTFOLIO PROJECT
tabler-icon-diamond-filled.svg

Paraphrase This Document

Need a fresh take? Get an instant paraphrase of this document with our AI Paraphraser
Document Page
2
Table of Contents
INVESTMENT STRATEGY 3
FIRST SECURITY TO ENTER THE PORTFOLIO 3-5
COMPUTATIONS 5-6
FINANCIAL RATIOS ANALYSIS 6-7
Document Page
3
Answer 1
Investment Objective:
The Fund seeks to provide long capital appreciation.
Principal Investment Strategies:
The Fund invests 95% of its assets in stocks of companies across varies industries depending upon
the boom in the market for a particular industry. Once the benefits are reaped from that industry, the
funds are taken out and invested in other industry. This helps in gaining the industry specific profits
and appreciating the capital of the Fund. Ultimately resulting in increase of the value of the
portfolio in the hands of investors.
Answer 2
First Security to enter into Portfolio:
Nike is the first security to enter into portfolio.
The PE Ratio of the Stock is at 22.76 times it Earnings Per Share which is to stay that the stock is
trading at 22.76 time its Earnings.
The Financial Highlights of the stock are provided below:
Document Page
4
tabler-icon-diamond-filled.svg

Paraphrase This Document

Need a fresh take? Get an instant paraphrase of this document with our AI Paraphraser
Document Page
5
Stocks selected: Nike and Adidas
ANSWER 3-4-5-6-7
It is summary result of selected stock, as the data for the same is much can not be pasted in
word. Refer excel sheet for detail calculation step wise
Computations:
Stock/Index Nike Adidas S&P 500
Mean (0.10%) 0.25% 0.01%
Standard Deviation 1.48% 1.58% 0.88%
Beta Co-efficient 0.89 0.73 -
Systematic Risk 0.0078 0.0116 -
Unsystematic Risk 0.0148 0.0158 -
Systematic Risk is also known as non-diversifiable risk. It depends on the market forces.
Unsystematic Risk is also known as diversifiable risk. It is company specific and can be
eliminated.
Document Page
6
Answer 8 &9 & 10 (It is inseparable)
PORTFOLIO:
Weightage:
Nike 10% 20% 30% 40% 50% 60% 70% 80% 90% 100%
Adidas 90% 80% 70% 60% 50% 40% 30% 20% 10% 0%
Portfolio Return 0.216% 0.182% 0.147% 0.113% 0.078% 0.043% 0.009% -0.026% -0.060% -0.095%
Portfolio Variance 0.0248% 0.0244% 0.0241% 0.0238% 0.0235% 0.0232% 0.0229% 0.0226% 0.0222% 0.0219%
Portfolio Beta 0.75 0.77 0.78 0.80 0.81 0.83 0.84 0.86 0.87 0.89
Expected Return 0.65% 0.61% 0.57% 0.53% 0.49% 0.45% 0.41% 0.37% 0.33% 0.29%
Portfolio Variance 0.000291 0.000290 0.000289 0.000287 0.000286 0.000285 0.000284 0.000283 0.000282 0.000281
Efficient Frontier for Portfolio Return:
0.0248
% 0.0244
% 0.0241
% 0.0238
% 0.0235
% 0.0232
% 0.0229
% 0.0226
% 0.0222
% 0.0219
%
0.0205%
0.0210%
0.0215%
0.0220%
0.0225%
0.0230%
0.0235%
0.0240%
0.0245%
0.0250%
Portfolio Variance
Portfolio Return
Document Page
7
FINANCIAL RATIOS ANALYSIS: (Source: finance.yahoo.com)
Particulars Nike Adidas Peer Company –
Skechers U.S.A
P/E Ratio 22.76 times 28.44 times 12.92 times
Profit Margin 11.60% 5.24% 7.53%
Operating Margin 13.05% 7.86% 11.23%
Return on Assets 12.85% 6.77% 11.90%
Return on Equity 30.57% 16.82% 20.58%
Total Debt/Equity 17.99 33.52 4.45
Current Ratio 2.72 1.33 3.66
Dividend Payout
Ratio
28.3% - -
Beta 0.53 - 0.2
In terms of P/E Ratio, Adidas is trading at highest multiple of its Earnings, however Nike is a
better performer in terms of Profit and Operating Margin. Also Nike has a better edger over other
peers in terms of Return earned on the Assets and Equity introduced. Adidas is highly levered as
its debt component is huge. This might be one of the reasons for lower profits as debt involves
fixed interest payments.
Answer 11
Efficient Frontier for Expected Return:
0.000291
0.000290
0.000289
0.000287
0.000286
0.000285
0.000284
0.000283
0.000282
0.000281
0.00%
0.10%
0.20%
0.30%
0.40%
0.50%
0.60%
0.70%
Portfolio Variance
Expected Return
chevron_up_icon
1 out of 7
circle_padding
hide_on_mobile
zoom_out_icon
[object Object]