Capital Markets and Investment Analysis Report - Finance
VerifiedAdded on 2020/06/05
|22
|3727
|56
Report
AI Summary
This report provides a comprehensive analysis of capital markets and investment strategies. It begins with an introduction to the volatile market conditions and the need for rationalized investment decisions. The report then delves into asset selection, focusing on five stocks from the FTSE 100 Index, along with two bonds, considering factors like P/E ratio, market capitalization, and beta values. Investment theories, including the Capital Assets Pricing Model (CAPM) and Modern Portfolio Theory (MPT), are examined to understand their relevance in portfolio creation and risk management. The report evaluates the portfolio's expected return and risk, concluding that the chosen investment approach aligns with a moderate to aggressive risk tolerance. Appendices include historical returns, average FTSE index returns, coupon returns, CAPM calculations, and portfolio expected return calculations.

Capital Markets and Investment
Paraphrase This Document
Need a fresh take? Get an instant paraphrase of this document with our AI Paraphraser

TABLE OF CONTENTS
1. INTRODUCTION.......................................................................................................................1
2. ASSETS SELECTION................................................................................................................1
2.1 VO25......................................................................................................................................2
2.2 TR28.......................................................................................................................................2
2.3 British Petroleum...................................................................................................................2
2.4 Admiral Group Plc.................................................................................................................3
2.5 Royal Dutch Shell Plc...........................................................................................................4
3. INVESTMENT THEORIES.......................................................................................................4
3.1 Capital Assets Pricing Model.................................................................................................4
3.2 Modern Portfolio Theory (MPT)...........................................................................................5
3.3 Investment style and assets allocation...................................................................................6
4. EVALUATION...........................................................................................................................8
5. CONCLUSION............................................................................................................................9
REFERENCES..............................................................................................................................10
APPENDICES...............................................................................................................................12
7.1 Historical Returns of the equities and bonds.......................................................................12
7.2 Average return of FTSE index during the period of five weeks:.........................................13
7.3 Coupon returns for bond......................................................................................................14
7.4 Capital assets pricing model................................................................................................15
7.5 Portfolio expected return......................................................................................................16
⊘ This is a preview!⊘
Do you want full access?
Subscribe today to unlock all pages.
Trusted by 1+ million students worldwide

Figure 1: British Petroleum.............................................................................................................3
Figure 2: Admiral Group Plc...........................................................................................................3
Figure 2: Admiral Group Plc...........................................................................................................3
Paraphrase This Document
Need a fresh take? Get an instant paraphrase of this document with our AI Paraphraser
1. INTRODUCTION
In volatile market, it is too tough to create a balanced portfolio as
market changes frequently. In order to make rationalized investment,
investors require examining risk-return relationship of various securities and
use various theories and strategies for creating the optimum portfolio that
delivers them greater return. Current research paper investigatesvarious
theories such as Capital Assets Pricing Model (CAPM) and Efficient Market
Hypothesis (EMH) that are helpful for driving efficiency. For the purpose of
portfolio creation, five stocks listed on London Stock Exchange as
constituents of FTSE 100 Index had been selected. The aim of the portfolio is
to achieve maximum return. Total available fund of £150,000 is allocated to
stock belong to different industries following diversification strategy so as to
spread out the risk. Investment favors accepting a moderate level of risks so
as to generate better return. He is concerned mainly with the capital growth
but at the same time, safety of fund is also important. Good portfolio return,
with moderate level of risks suits moderate to aggressive risks tolerance
attitude of investor. The study emphasized on how investment theories are
relevant to such investment style. Historical prices of all the chosen 5-stocks
will be gathered from the period of 27th February 2017 to 3rd April 2018 for
determining stock return, index return and track the performance.
2. ASSETS SELECTION
As now market is highly volatile and return fluctuates continuously,
therefore, considering such up and down changes prevalent in the market, it
is decided to invest total capital in different assets rather than choosing a
particular one. All the chosen companies are London-based companies and
operate internationally. All the chosen stocks are listed on LSE as FTSE 100
constituents.The diversification strategy within assets aimed to spread out
risks with the target to avoid extreme loss and manage average return. The
1
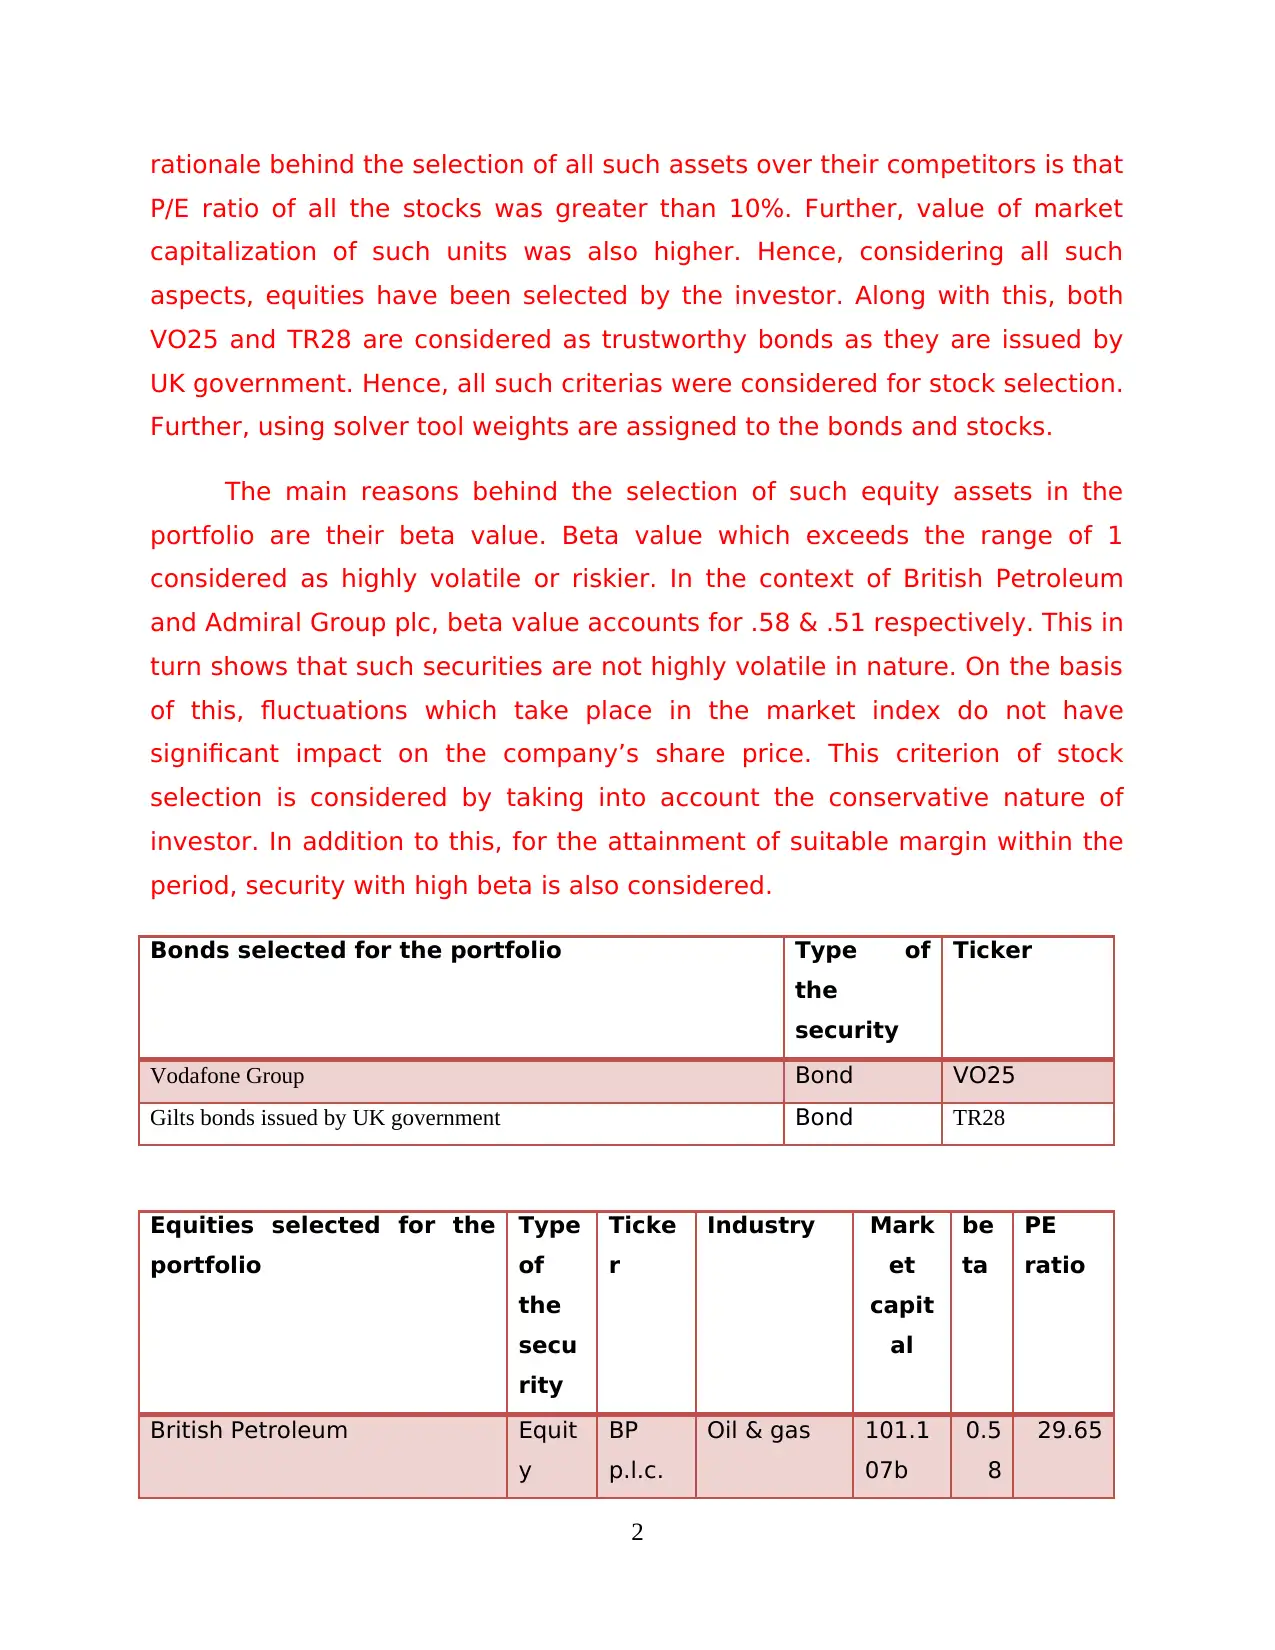
rationale behind the selection of all such assets over their competitors is that
P/E ratio of all the stocks was greater than 10%. Further, value of market
capitalization of such units was also higher. Hence, considering all such
aspects, equities have been selected by the investor. Along with this, both
VO25 and TR28 are considered as trustworthy bonds as they are issued by
UK government. Hence, all such criterias were considered for stock selection.
Further, using solver tool weights are assigned to the bonds and stocks.
The main reasons behind the selection of such equity assets in the
portfolio are their beta value. Beta value which exceeds the range of 1
considered as highly volatile or riskier. In the context of British Petroleum
and Admiral Group plc, beta value accounts for .58 & .51 respectively. This in
turn shows that such securities are not highly volatile in nature. On the basis
of this, fluctuations which take place in the market index do not have
significant impact on the company’s share price. This criterion of stock
selection is considered by taking into account the conservative nature of
investor. In addition to this, for the attainment of suitable margin within the
period, security with high beta is also considered.
Bonds selected for the portfolio Type of
the
security
Ticker
Vodafone Group Bond VO25
Gilts bonds issued by UK government Bond TR28
Equities selected for the
portfolio
Type
of
the
secu
rity
Ticke
r
Industry Mark
et
capit
al
be
ta
PE
ratio
British Petroleum Equit
y
BP
p.l.c.
Oil & gas 101.1
07b
0.5
8
29.65
2
⊘ This is a preview!⊘
Do you want full access?
Subscribe today to unlock all pages.
Trusted by 1+ million students worldwide
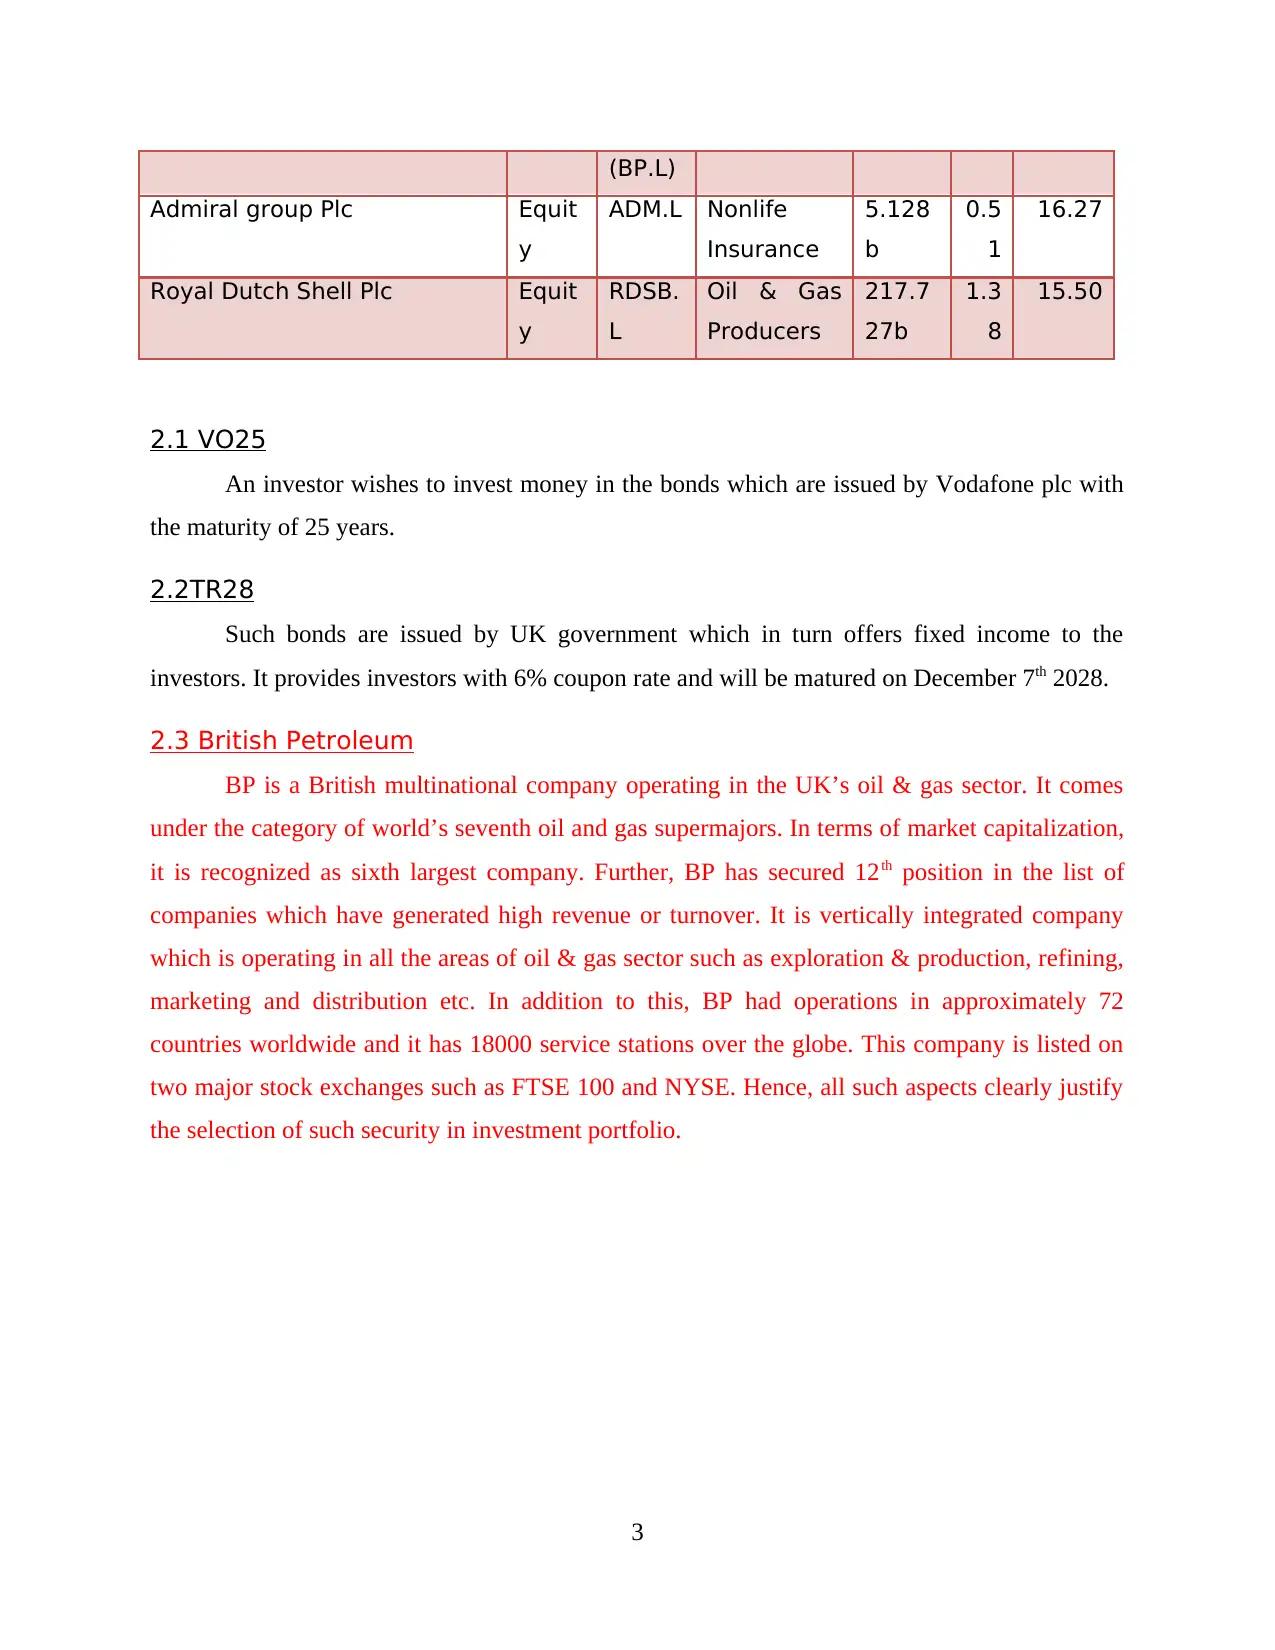
(BP.L)
Admiral group Plc Equit
y
ADM.L Nonlife
Insurance
5.128
b
0.5
1
16.27
Royal Dutch Shell Plc Equit
y
RDSB.
L
Oil & Gas
Producers
217.7
27b
1.3
8
15.50
2.1 VO25
An investor wishes to invest money in the bonds which are issued by Vodafone plc with
the maturity of 25 years.
2.2TR28
Such bonds are issued by UK government which in turn offers fixed income to the
investors. It provides investors with 6% coupon rate and will be matured on December 7th 2028.
2.3 British Petroleum
BP is a British multinational company operating in the UK’s oil & gas sector. It comes
under the category of world’s seventh oil and gas supermajors. In terms of market capitalization,
it is recognized as sixth largest company. Further, BP has secured 12th position in the list of
companies which have generated high revenue or turnover. It is vertically integrated company
which is operating in all the areas of oil & gas sector such as exploration & production, refining,
marketing and distribution etc. In addition to this, BP had operations in approximately 72
countries worldwide and it has 18000 service stations over the globe. This company is listed on
two major stock exchanges such as FTSE 100 and NYSE. Hence, all such aspects clearly justify
the selection of such security in investment portfolio.
3
Paraphrase This Document
Need a fresh take? Get an instant paraphrase of this document with our AI Paraphraser
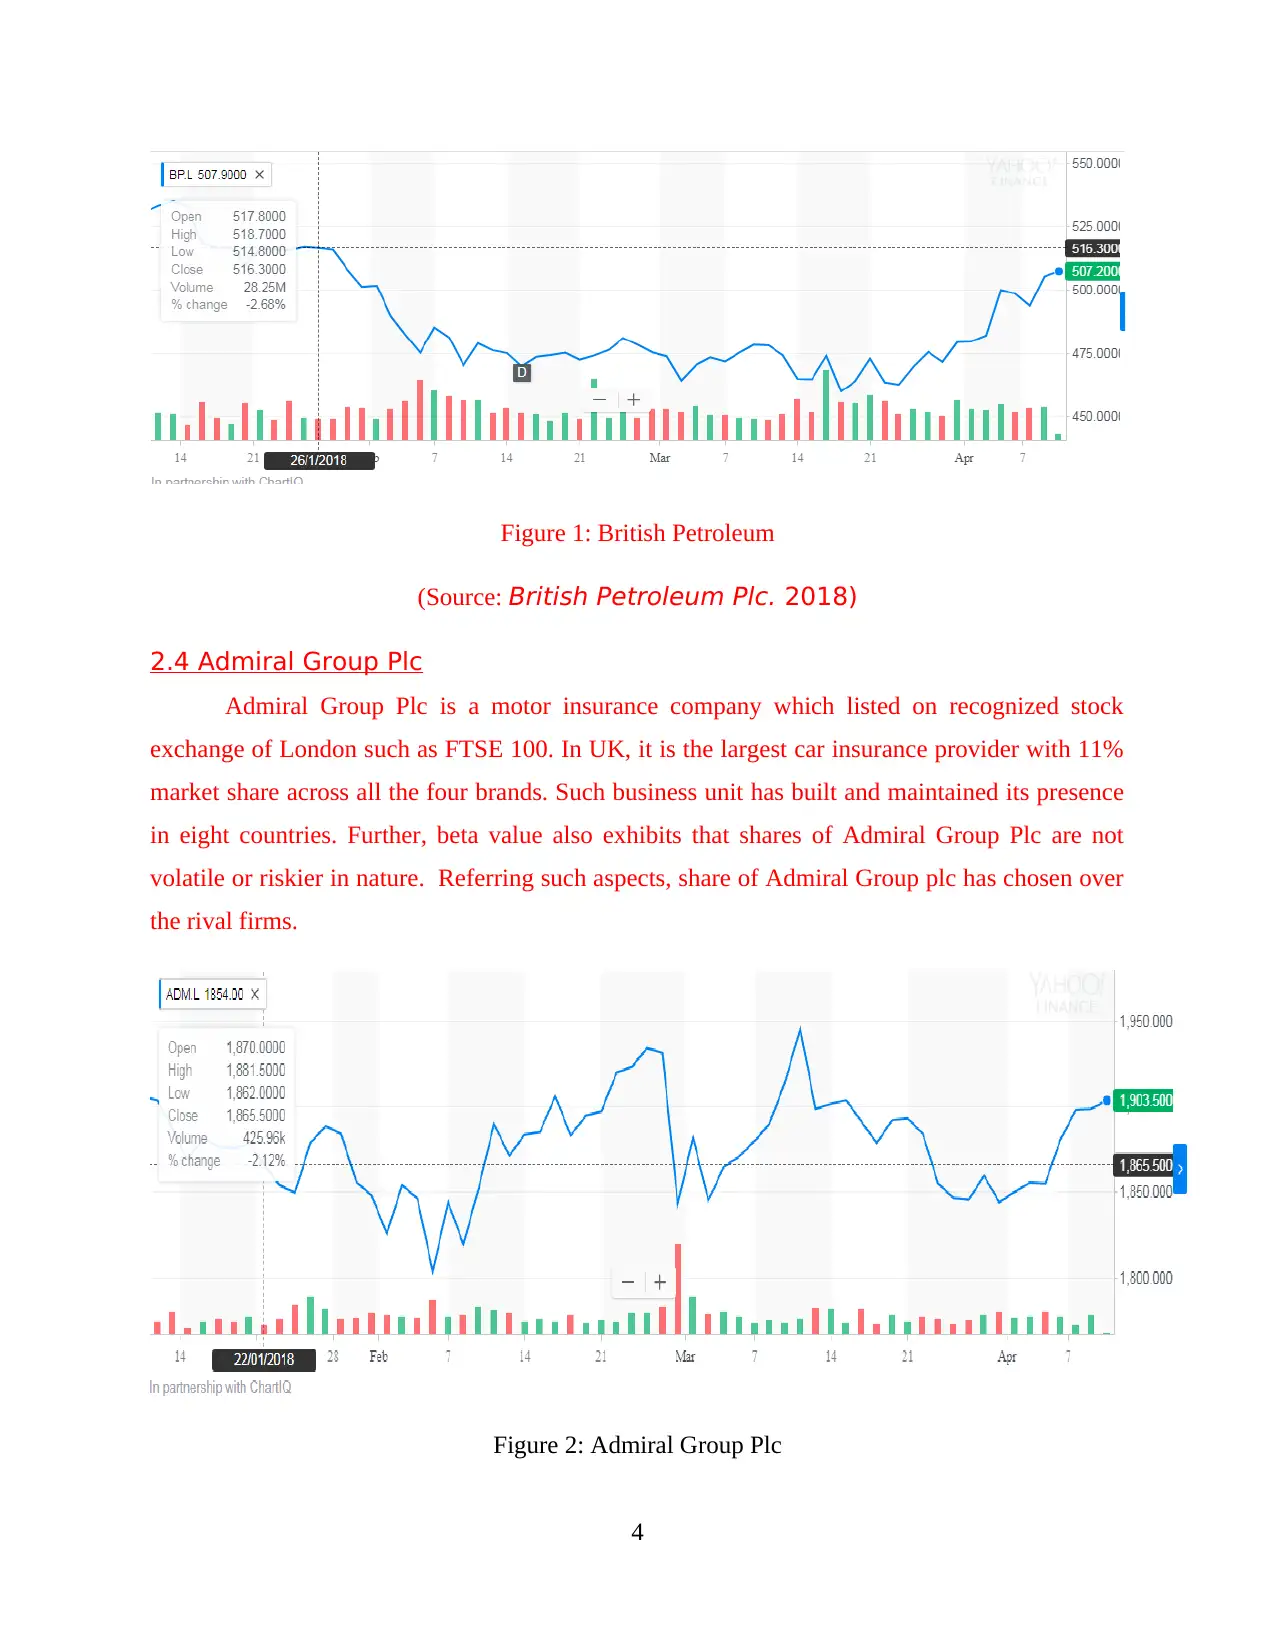
Figure 1: British Petroleum
(Source: British Petroleum Plc. 2018)
2.4 Admiral Group Plc
Admiral Group Plc is a motor insurance company which listed on recognized stock
exchange of London such as FTSE 100. In UK, it is the largest car insurance provider with 11%
market share across all the four brands. Such business unit has built and maintained its presence
in eight countries. Further, beta value also exhibits that shares of Admiral Group Plc are not
volatile or riskier in nature. Referring such aspects, share of Admiral Group plc has chosen over
the rival firms.
Figure 2: Admiral Group Plc
4
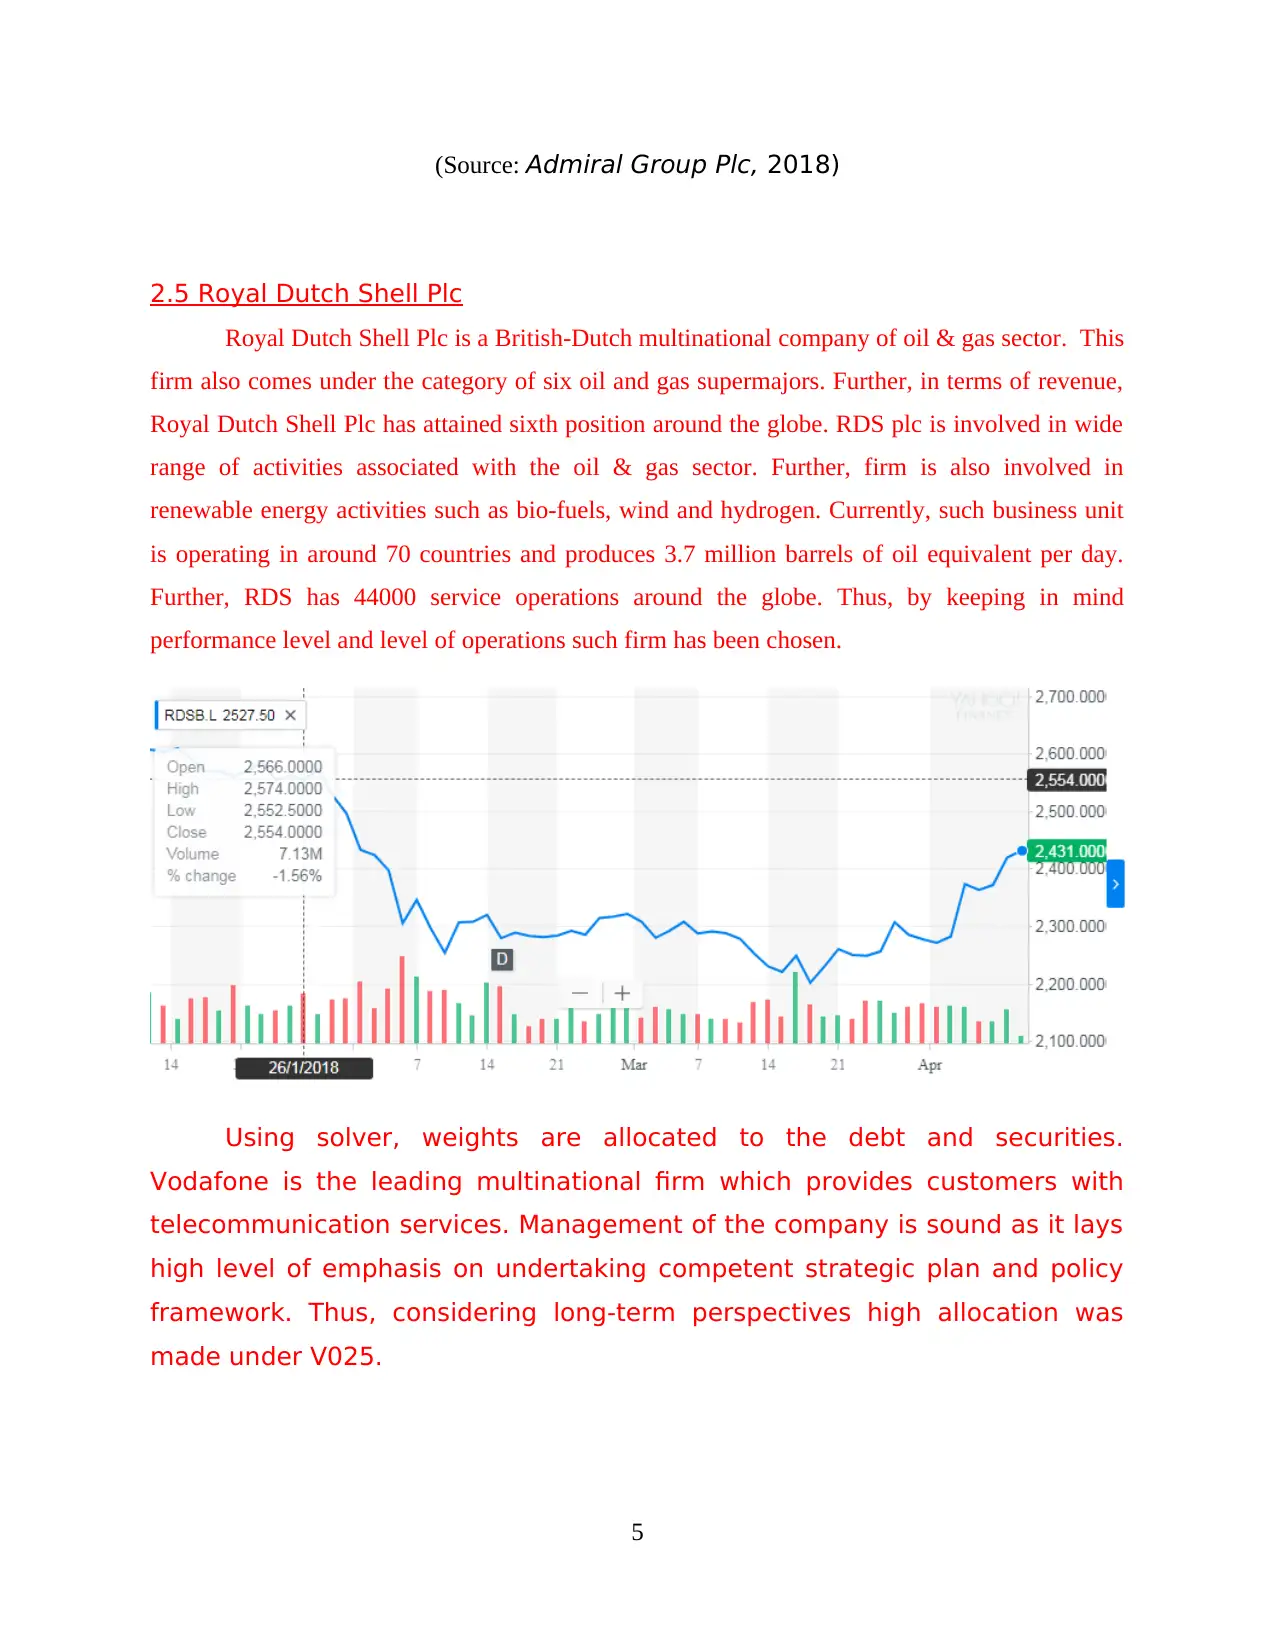
(Source: Admiral Group Plc, 2018)
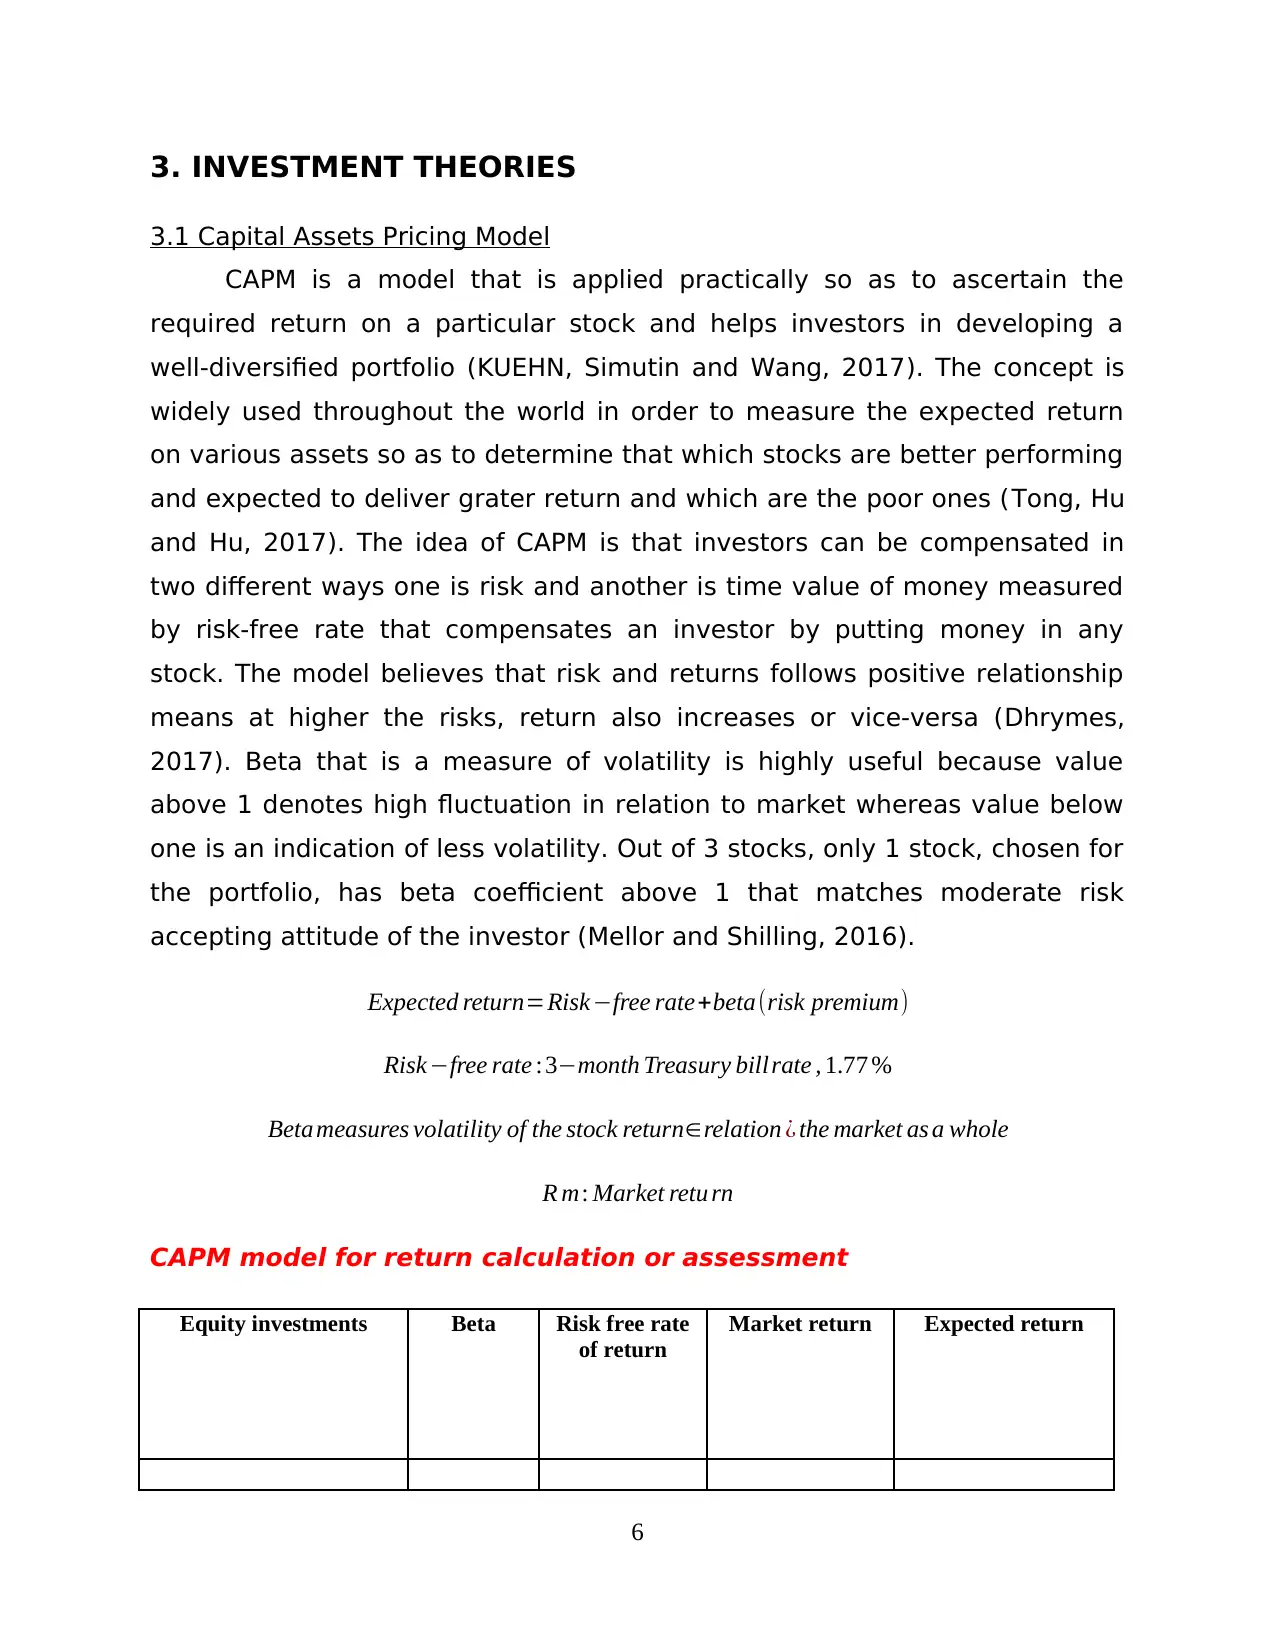
2.5 Royal Dutch Shell Plc
Royal Dutch Shell Plc is a British-Dutch multinational company of oil & gas sector. This
firm also comes under the category of six oil and gas supermajors. Further, in terms of revenue,
Royal Dutch Shell Plc has attained sixth position around the globe. RDS plc is involved in wide
range of activities associated with the oil & gas sector. Further, firm is also involved in
renewable energy activities such as bio-fuels, wind and hydrogen. Currently, such business unit
is operating in around 70 countries and produces 3.7 million barrels of oil equivalent per day.
Further, RDS has 44000 service operations around the globe. Thus, by keeping in mind
performance level and level of operations such firm has been chosen.
Using solver, weights are allocated to the debt and securities.
Vodafone is the leading multinational firm which provides customers with
telecommunication services. Management of the company is sound as it lays
high level of emphasis on undertaking competent strategic plan and policy
framework. Thus, considering long-term perspectives high allocation was
made under V025.
5
⊘ This is a preview!⊘
Do you want full access?
Subscribe today to unlock all pages.
Trusted by 1+ million students worldwide
3. INVESTMENT THEORIES
3.1 Capital Assets Pricing Model
CAPM is a model that is applied practically so as to ascertain the
required return on a particular stock and helps investors in developing a
well-diversified portfolio (KUEHN, Simutin and Wang, 2017). The concept is
widely used throughout the world in order to measure the expected return
on various assets so as to determine that which stocks are better performing
and expected to deliver grater return and which are the poor ones (Tong, Hu
and Hu, 2017). The idea of CAPM is that investors can be compensated in
two different ways one is risk and another is time value of money measured
by risk-free rate that compensates an investor by putting money in any
stock. The model believes that risk and returns follows positive relationship
means at higher the risks, return also increases or vice-versa (Dhrymes,
2017). Beta that is a measure of volatility is highly useful because value
above 1 denotes high fluctuation in relation to market whereas value below
one is an indication of less volatility. Out of 3 stocks, only 1 stock, chosen for
the portfolio, has beta coefficient above 1 that matches moderate risk
accepting attitude of the investor (Mellor and Shilling, 2016).
Expected return=Risk−free rate+beta(risk premium)
Risk−free rate :3−month Treasury billrate , 1.77 %
Beta measures volatility of the stock return∈relation ¿ the market as a whole
R m: Market retu rn
CAPM model for return calculation or assessment
Equity investments Beta Risk free rate
of return
Market return Expected return
6
Paraphrase This Document
Need a fresh take? Get an instant paraphrase of this document with our AI Paraphraser
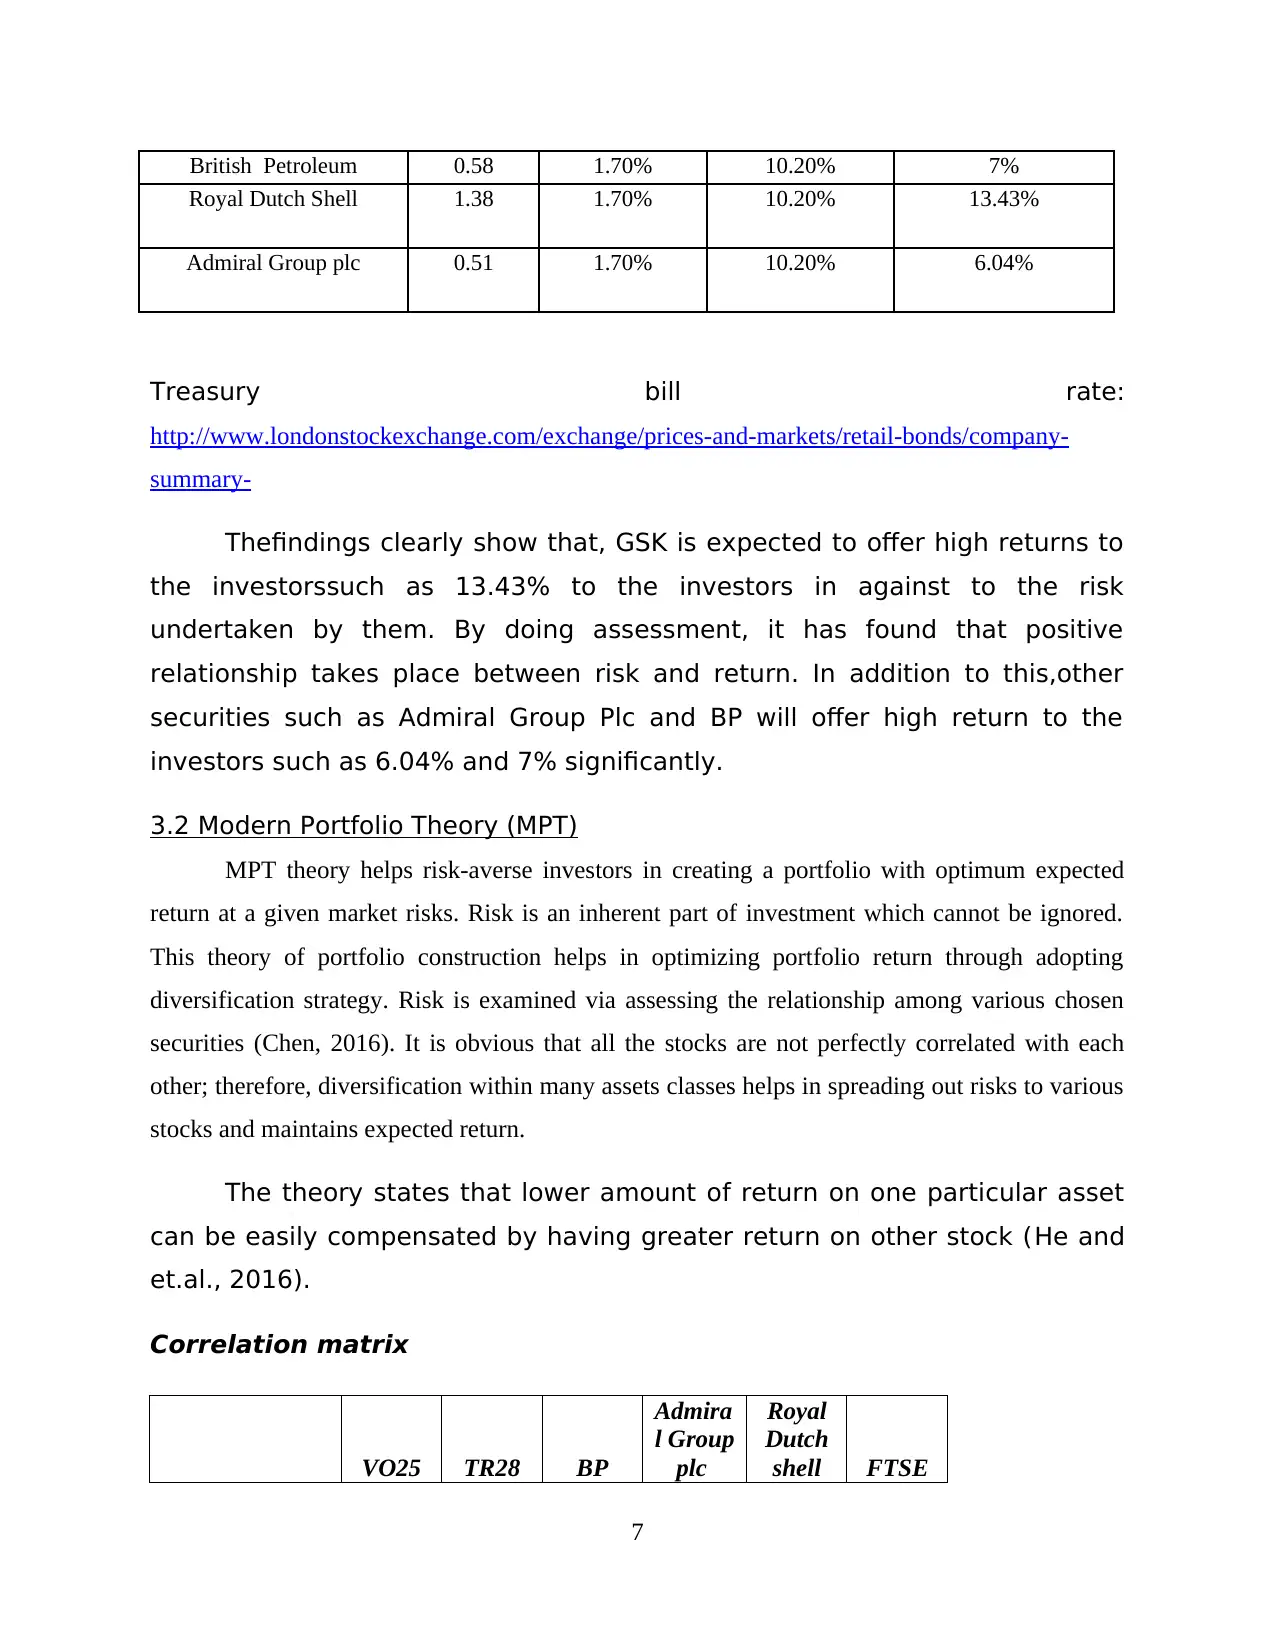
British Petroleum 0.58 1.70% 10.20% 7%
Royal Dutch Shell 1.38 1.70% 10.20% 13.43%
Admiral Group plc 0.51 1.70% 10.20% 6.04%
Treasury bill rate:
http://www.londonstockexchange.com/exchange/prices-and-markets/retail-bonds/company-
summary-
Thefindings clearly show that, GSK is expected to offer high returns to
the investorssuch as 13.43% to the investors in against to the risk
undertaken by them. By doing assessment, it has found that positive
relationship takes place between risk and return. In addition to this,other
securities such as Admiral Group Plc and BP will offer high return to the
investors such as 6.04% and 7% significantly.
3.2 Modern Portfolio Theory (MPT)
MPT theory helps risk-averse investors in creating a portfolio with optimum expected
return at a given market risks. Risk is an inherent part of investment which cannot be ignored.
This theory of portfolio construction helps in optimizing portfolio return through adopting
diversification strategy. Risk is examined via assessing the relationship among various chosen
securities (Chen, 2016). It is obvious that all the stocks are not perfectly correlated with each
other; therefore, diversification within many assets classes helps in spreading out risks to various
stocks and maintains expected return.
The theory states that lower amount of return on one particular asset
can be easily compensated by having greater return on other stock (He and
et.al., 2016).
Correlation matrix
VO25 TR28 BP
Admira
l Group
plc
Royal
Dutch
shell FTSE
7
VO25 1
0.8574
8 -0.4492 -0.1195 -0.3977 -0.1413
TR28
0.8574
8 1 -0.4363 -0.143 -0.2593 -0.0903
BP -0.4492 -0.4363 1 0.23991 0.7967
0.6596
7
Admiral Group
plc -0.1195 -0.143
0.2399
1 1
0.1019
2
0.6450
1
Royal Dutch
shell -0.3977 -0.2593 0.7967 0.10192 1
0.6450
1
FTSE -0.1413 -0.0903
0.6596
7 0.42782
0.6450
1 1
Above correlation matrix shows that bond VO25 is negatively related
with equities but still evident weak relationship. However, BP reported
positive and higher relationship with other equities and FTSE index. All the
other assets include equities and bonds had exhibit weak relationship.
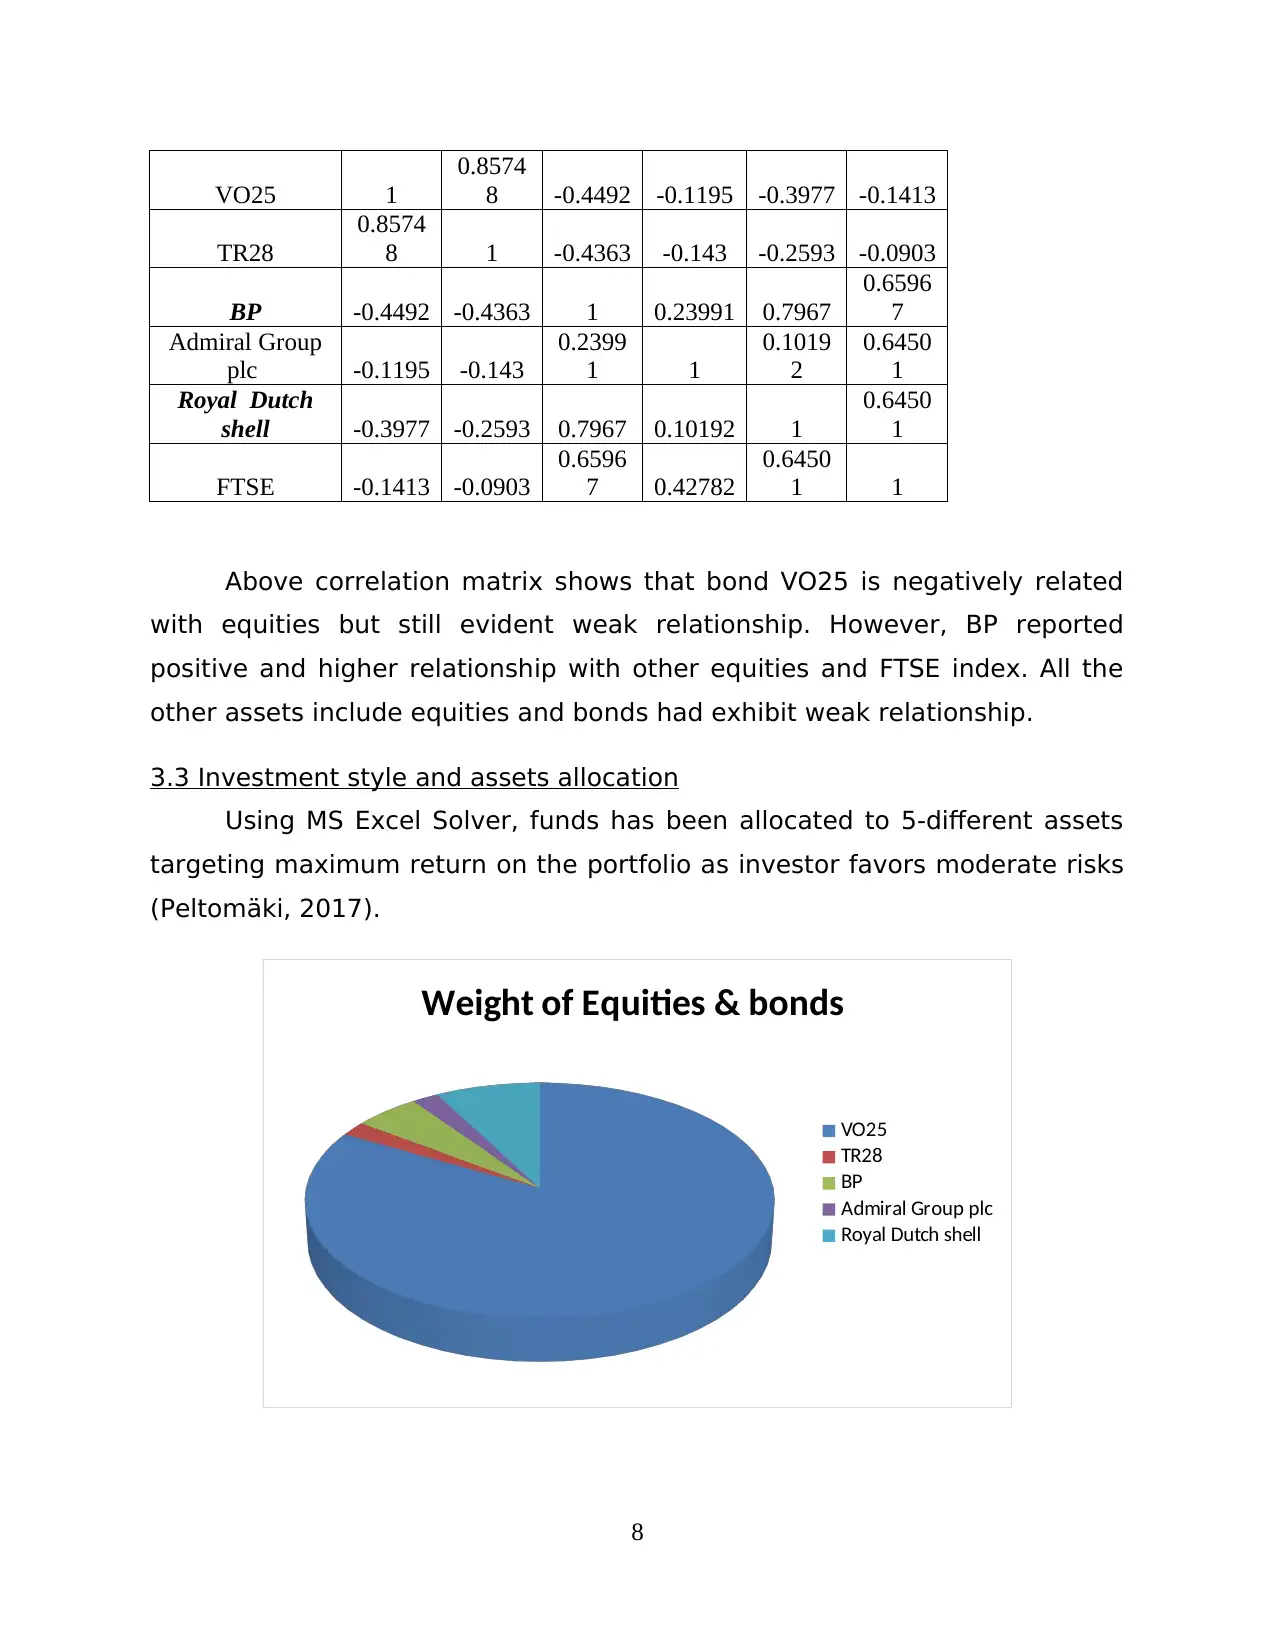
3.3 Investment style and assets allocation
Using MS Excel Solver, funds has been allocated to 5-different assets
targeting maximum return on the portfolio as investor favors moderate risks
(Peltomäki, 2017).
Weight of Equities & bonds
VO25
TR28
BP
Admiral Group plc
Royal Dutch shell
8
0.8574
8 -0.4492 -0.1195 -0.3977 -0.1413
TR28
0.8574
8 1 -0.4363 -0.143 -0.2593 -0.0903
BP -0.4492 -0.4363 1 0.23991 0.7967
0.6596
7
Admiral Group
plc -0.1195 -0.143
0.2399
1 1
0.1019
2
0.6450
1
Royal Dutch
shell -0.3977 -0.2593 0.7967 0.10192 1
0.6450
1
FTSE -0.1413 -0.0903
0.6596
7 0.42782
0.6450
1 1
Above correlation matrix shows that bond VO25 is negatively related
with equities but still evident weak relationship. However, BP reported
positive and higher relationship with other equities and FTSE index. All the
other assets include equities and bonds had exhibit weak relationship.
3.3 Investment style and assets allocation
Using MS Excel Solver, funds has been allocated to 5-different assets
targeting maximum return on the portfolio as investor favors moderate risks
(Peltomäki, 2017).
Weight of Equities & bonds
VO25
TR28
BP
Admiral Group plc
Royal Dutch shell
8
⊘ This is a preview!⊘
Do you want full access?
Subscribe today to unlock all pages.
Trusted by 1+ million students worldwide
1 out of 22
Related Documents


Your All-in-One AI-Powered Toolkit for Academic Success.
+13062052269
info@desklib.com
Available 24*7 on WhatsApp / Email
![[object Object]](/_next/static/media/star-bottom.7253800d.svg)
Unlock your academic potential
Copyright © 2020–2026 A2Z Services. All Rights Reserved. Developed and managed by ZUCOL.