RMIT University BAFI1042 Investment Portfolio Analysis Report, S1 2018
VerifiedAdded on 2023/06/08
|42
|6067
|290
Report
AI Summary
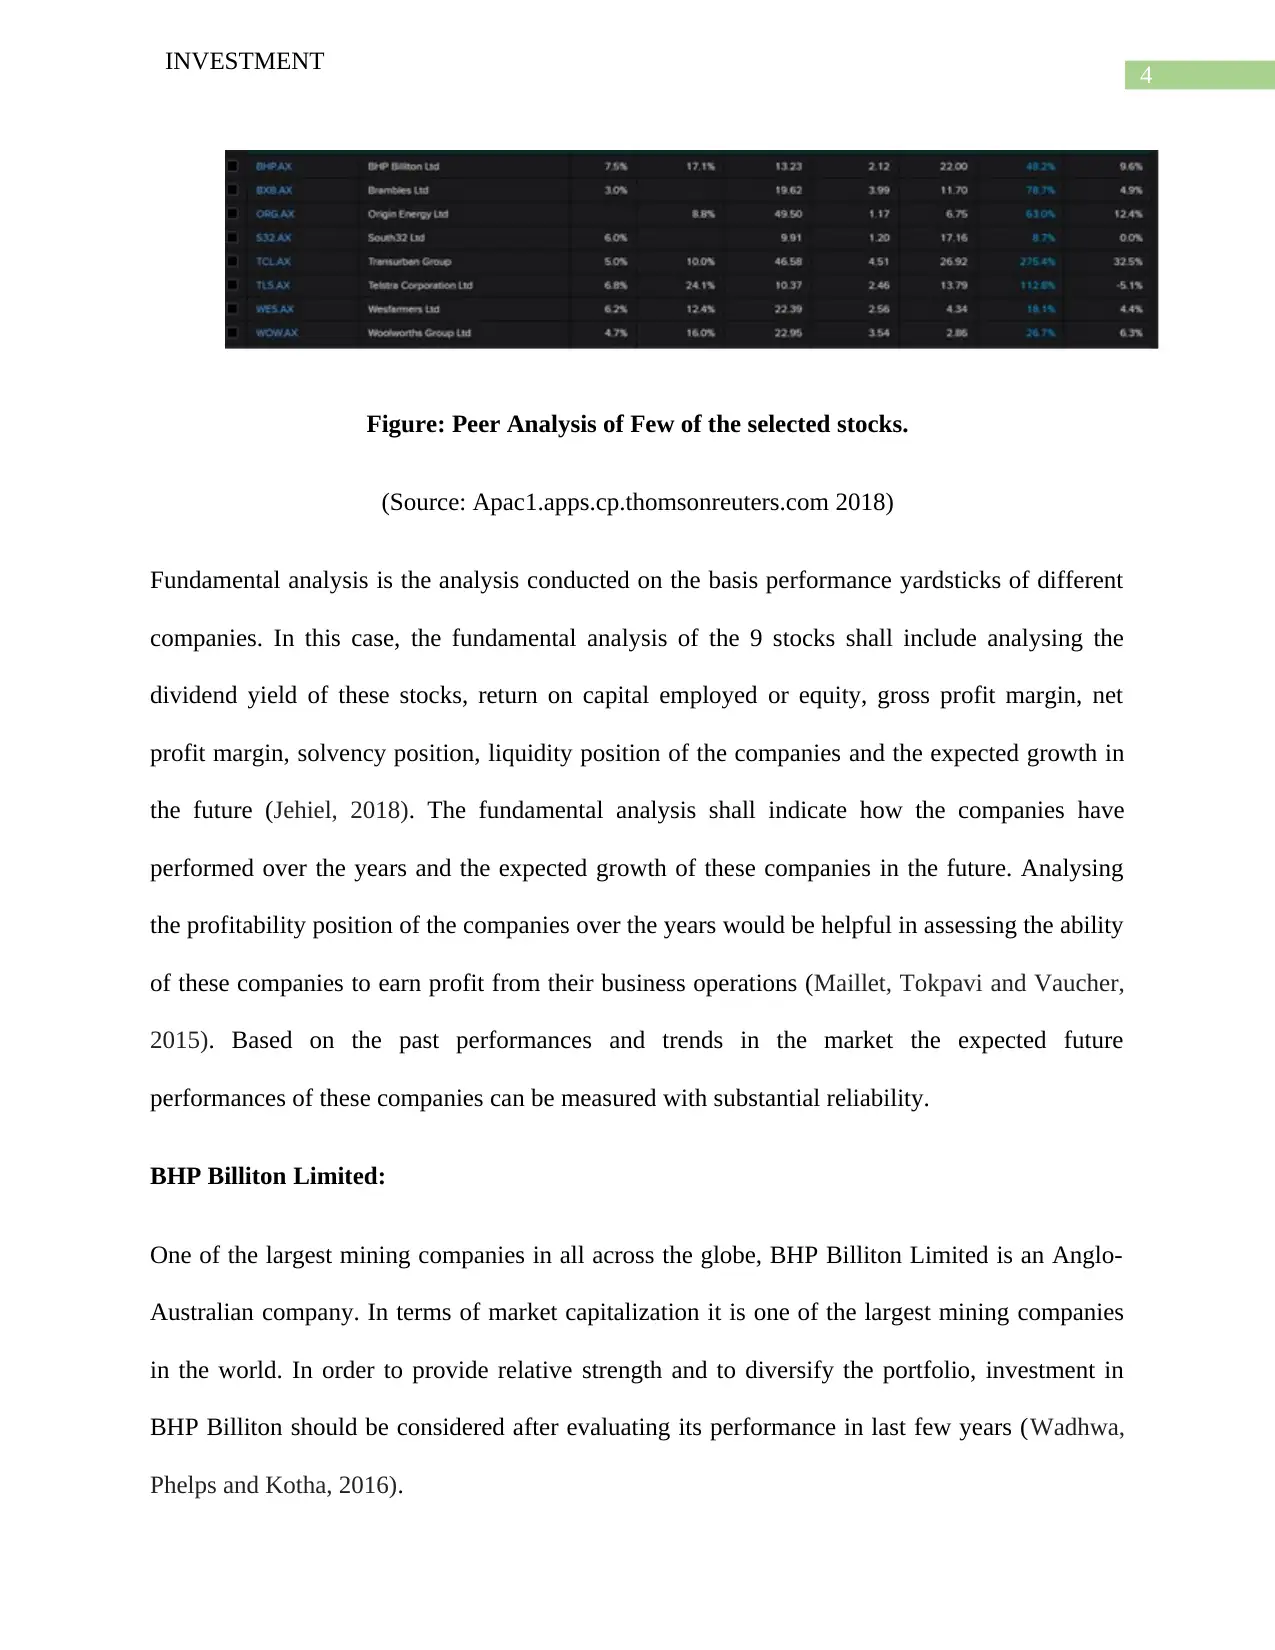
This report presents a comprehensive analysis of an investment portfolio, focusing on stocks listed on the Australian Securities Exchange (ASX). The report begins with an introduction outlining the objective of constructing a balanced portfolio incorporating both growth and value stocks. A detailed stock evaluation process is undertaken, considering industry and economic growth factors, particularly within the banking, mining, and telecommunications sectors. The core of the report involves fundamental analysis, examining key financial metrics such as dividend yields, return on capital employed, and profit margins for nine selected stocks, including BHP Billiton, Commonwealth Bank, and Flight Centre. Technical analysis is also employed to assess stock performance and predict future trends. The Du Pont analysis is then used to further evaluate the companies. The report concludes with recommendations on stock selection and portfolio weightings, aiming to maximize returns and manage risk. The report is a result of a BAFI1042 assignment.

Running head: INVESTMENT
Investment
Name of the Student:
Name of the University:
Authors Note:
Investment
Name of the Student:
Name of the University:
Authors Note:
Paraphrase This Document
Need a fresh take? Get an instant paraphrase of this document with our AI Paraphraser

1
INVESTMENT
Contents
Introduction:....................................................................................................................................2
Evaluation of stocks:........................................................................................................................2
Fundamental analysis:.................................................................................................................3
Technical analysis:.....................................................................................................................23
Du Pont Analysis:......................................................................................................................28
Conclusion:....................................................................................................................................36
References:....................................................................................................................................37

2
INVESTMENT
Introduction:
The objective of the assessment is to find a suitable combination of stocks of companies
listed in Australian Securities Exchange (ASX) to develop a robust portfolio. The portfolio must
have a balanced combination between growth and value stocks to ensure maximum possible
return to the portfolio holder / holders. Fundamental analysis of these stocks along with technical
evolution on the expected returns from the stocks shall be provided in the document to
understand the recommendations and justifications behind selection of particulars stocks. Based
on the historic returns and expected growth of selected 9 stocks the weightage of different stocks
in the portfolio shall be decided to maximize the return and growth from the portfolio.
Evaluation of stocks:
The stocks shall be selected on the basis of industrial and economic growth in the
country. Often it has been seen that a particular industry in a country has more potential of
growth in comparison to other industry or industries in the country. In Australia, Banking,
mining and materials, energy, consumer staples and telecommunication industry have huge
potential of growth and has grown extensively over the years as compared other industries.
Effective Government rules and regulations have led to the immense growth of these industries
as compared to other industry (Weber, Alfen, and Staub-Bisang, 2016). The increased amount of
government regulations and political interference in many countries have restricted the growth of
the Banking industry in those countries whereas Australia has always been a country with strong
banking industry. Thus, in selecting stocks for the portfolio in this document, the industry and
economic growths attached to the industries have been in mind. It is important to conduct a
detailed analysis, both fundamental and technical, before taking investment decisions to
minimize the risk of incurring loss on investments (Liu, Zhang and Tang, 2015). Hence, a
⊘ This is a preview!⊘
Do you want full access?
Subscribe today to unlock all pages.

Trusted by 1+ million students worldwide

3
INVESTMENT
portfolio must be created after adequate calculation to reduce the risk of losses from such
portfolio. As already measured that the portfolio shall be mainly divided into two components,
value and growth components. Accordingly, the following nine stocks have been selected for the
portfolio purpose.
Value components in the portfolio` Growth components in the portfolio
BHP Billiton Limited (BHP) Bellamy’s Australia Limited (Bellamy)
Commonwealth Bank (Commonwealth) Altium Limited
Woolworths Group Ltd (Woolworths)
Flight Centre Travel Group Limited (Flight
Centre)
Wesfarmers Ltd (Wesfarmers) A2 Milk Company (A2)
Telstra Corporation (Telstra)
Fundamental analysis:
Fundamental facts and information are provided by The Thomson Reuters Eikon online.
Taking into consideration the financial performance and other aspects of the above nine stocks a
detailed discussion shall be made to evaluate the recommendations made by the Thomson
Reuters Eikon online.
Paraphrase This Document
Need a fresh take? Get an instant paraphrase of this document with our AI Paraphraser

4
INVESTMENT
Figure: Peer Analysis of Few of the selected stocks.
(Source: Apac1.apps.cp.thomsonreuters.com 2018)
Fundamental analysis is the analysis conducted on the basis performance yardsticks of different
companies. In this case, the fundamental analysis of the 9 stocks shall include analysing the
dividend yield of these stocks, return on capital employed or equity, gross profit margin, net
profit margin, solvency position, liquidity position of the companies and the expected growth in
the future (Jehiel, 2018). The fundamental analysis shall indicate how the companies have
performed over the years and the expected growth of these companies in the future. Analysing
the profitability position of the companies over the years would be helpful in assessing the ability
of these companies to earn profit from their business operations (Maillet, Tokpavi and Vaucher,
2015). Based on the past performances and trends in the market the expected future
performances of these companies can be measured with substantial reliability.
BHP Billiton Limited:
One of the largest mining companies in all across the globe, BHP Billiton Limited is an Anglo-
Australian company. In terms of market capitalization it is one of the largest mining companies
in the world. In order to provide relative strength and to diversify the portfolio, investment in
BHP Billiton should be considered after evaluating its performance in last few years (Wadhwa,
Phelps and Kotha, 2016).

5
INVESTMENT
BHP Billiton Ltd
Except per share items all amounts are in $' million
2013-06 2014-06 2015-06 2016-06 2017-06 2018-06
Gross revenue 53,860.
00
56,762.
00
44,636.
00
28,567.
00
36,135.
00
43,638.
00
Gross profit % 68.
90
75
.30
72.
50
66.
30
76.
30
75.
00
Operating
profit
19,702.
00
21,437.
00
11,684.
00
4,941.
00
12,578.
00
16,089.
00
Operating
profit %
36.
60
37
.80
26.
20
17.
30
34.
80
36.
90
Net profit 11,223.
00
13,832.
00
1,910.
00
(6,385.0
0)
5,890.
00
3,705.
00
EPS 2.
10
2
.59
0.
35
(1.
20)
1.
10
0.
69
Dividend per
share
1.
13
1
.15
1.
24
0.
78
0.
55
0.
96
⊘ This is a preview!⊘
Do you want full access?
Subscribe today to unlock all pages.

Trusted by 1+ million students worldwide

6
INVESTMENT
Despite being one of the largest mining companies in the world, the ability of the company to
perform efficiently is clearly visible in the table above. The gross revenue line in the chart below
indicates that the company is very stable in its business life cycle.
2013-06 2014-06 2015-06 2016-06 2017-06 2018-06
-
10,000.00
20,000.00
30,000.00
40,000.00
50,000.00
60,000.00
Revenue and operating profit
Gross revenue Operating profit
There has been slight ups and downs in revenue and operating profit which is quite
understandable considering the size and scope of operations of the company. The net profit line
of the company as can be seen in the chart below once dropped to negatives has again recover to
indicate the strengths of the company in earning profit from business.
Paraphrase This Document
Need a fresh take? Get an instant paraphrase of this document with our AI Paraphraser

7
INVESTMENT
2013-06 2014-06 2015-06 2016-06 2017-06 2018-06
(10,000.00)
(5,000.00)
-
5,000.00
10,000.00
15,000.00
20,000.00
Net profit
Recommendation: Holding the shares of the company will increase the strength of the portfolio.
Commonwealth Bank:
Commonwealth Bank
Amounts are in $'million
2013-06 2014-06 2015-06 2016-06 2017-06 2018-06
Revenue 21,389.
00
22,873.
00
23,805.
00
24,225.
00
25,089.
00
25,630.
00
Net income 7,677.
00
8,631.
00
9,063.
00
9,227.
00
9,928.
00
9,329.
00
EPS 4 5 5 5 5 5

8
INVESTMENT
.62 .19 .29 .29 .59 .17
Dividend per share 1
.64
3
.92
3
.99
4
.32
4
.22
4
.24
Gross Margin 30
.83
30
.67
30
.94
31
.85
30
.86
29
.18
Earnings before tax
margin
37
.87
40
.44
39
.93
39
.88
42
.59
53
.09
Commonwealth has continuously managed as sustainable growth over the last 10 years, the
information in the table contains only of last 6 years. Thus, the bank is a prime entity to invest
one’s money. The following graph clearly explains the ability of the bank to keep on growing
despite huge competition in the banking industry (Kolm, Tütüncü and Fabozzi, 2014).
2013-06 2014-06 2015-06 2016-06 2017-06 2018-06
-
5,000.00
10,000.00
15,000.00
20,000.00
25,000.00
30,000.00
Revenue and profits
Revenue Net income
⊘ This is a preview!⊘
Do you want full access?
Subscribe today to unlock all pages.

Trusted by 1+ million students worldwide

9
INVESTMENT
The ever growing EPS and dividend per share of the bank is another important factor that would
inspire investors to invest on the stock of the company.
1 2 3 4 5 6
-
1.00
2.00
3.00
4.00
5.00
6.00
EPS and Dividend
EPS Dividend per share 2013-06
Recommendation: To invest in the shares of the bank by buying additional shares.
Woolworths Group:
The table below contains important financial data about the performance of the company since
2013.
Woolworths Group Ltd
All amounts are in $' millions
2013-06 2014-06 2015-06 2016-06 2017-06 2018-06
Gross Revenue 58,674 60,952 60,868 58,276 55,668 56,965
Gross Margin % 26.9 27 27.1 26.8 28.6 29.3
Paraphrase This Document
Need a fresh take? Get an instant paraphrase of this document with our AI Paraphraser

10
INVESTMENT
Net Income 2,259 2,451 2,146 -1,234 1,534 1,724
Earnings Per Share AUD 1.82 1.95 1.7 -0.98 1.19 1.32
Dividends AUD 1.29 1.36 1.39 1.16 0.67 0.93
The company has more or less managed to hold on to its market share and have paid dividend to
the shareholders without failing a year. There is definitely room for improvement in the
performance however, the company’s robust performance over the years makes it one of the
companies to keep in mind while investing (Zeng, Li and Gu, 2016).
The ever improving gross margin of the company along with its regularity in paying dividends to
the shareholders are certainly two key aspects to be kept in mind.
Recommendation: The investors should hold on to the investment made in the company.
Wesfarmers Limited:
Again the financial information about the company in the table below will explain how the
company has performed over the years to decide the future course of action in relation to buy,
hold or dispose of the shares of the company (Berutich et. al. 2016).
Wesfarmers Ltd
All amounts are in $' millions except per share amount
2013- 2014- 2015- 2016- 2017- 2018-

11
INVESTMENT
06 06 06 06 06 06
Gross Revenue 59,422 59,893 62,102 65,512 68,015 66,594
Gross profit margin % 33.3 30.8 30.7 30.5 31.8 31.3
Operating profit 4,043 4,080 4,162 3,778 4,683 4,570
Operating Margin % 6.8 6.8 6.7 5.8 6.9 6.9
Net Income 2,261 2,689 2,440 407 2,873 1,197
Earnings Per Share 2.02 2.38 2.16 0.36 2.54 1.06
Dividends 1.77 1.93 2.21 2.02 1.98 2.23
2013-06 2014-06 2015-06 2016-06 2017-06 2018-06
0
10,000
20,000
30,000
40,000
50,000
60,000
70,000
80,000
Revenue and profit
Gross Revenue Operating profit
⊘ This is a preview!⊘
Do you want full access?
Subscribe today to unlock all pages.

Trusted by 1+ million students worldwide
1 out of 42

Your All-in-One AI-Powered Toolkit for Academic Success.
+13062052269
info@desklib.com
Available 24*7 on WhatsApp / Email
Unlock your academic potential
Copyright © 2020–2025 A2Z Services. All Rights Reserved. Developed and managed by ZUCOL.