FIN3CSF: Investment Portfolio Construction Report, SP2 2019
VerifiedAdded on 2022/11/13
|20
|4177
|101
Project
AI Summary
This report is an investment proposal prepared for a client, a software developer, who has allocated $2 million for portfolio creation. The report begins with an analysis of the economic and investment environment, including recent market trends, global and Australian outlooks, and the impact of factors like trade wars and central bank policies. It then recommends an investment strategy based on a fundamental screening approach, focusing on value and growth companies within the S&P/ASX 200 index, and includes exposure to the US tech sector. The core of the report is the recommended initial portfolio, detailing specific equity share purchases and the rationale behind the selections, aiming to meet the client's risk profile and investment objectives. The report also considers the client's preference to limit investment in US and China markets due to trade war concerns. It offers a diversified portfolio with an overweight in Australian equities and limited international exposure, emphasizing long-term capital appreciation.

Running Head: Investment Proposal Report
Investment Proposal Report
Investment Proposal Report
Paraphrase This Document
Need a fresh take? Get an instant paraphrase of this document with our AI Paraphraser
Investment Proposal Report
Contents
1) Economic and Investment Environment Summary........................................................................4
Recent Market Trend and Performance:............................................................................................4
Global Outlook..................................................................................................................................6
Australian Outlook............................................................................................................................7
2) Recommended Investment Strategy...............................................................................................8
Fundamental screening strategy.........................................................................................................9
3) Recommended Initial Portfolio using above strategy and screening:..............................................10
Brief description of the securities in the recommended investment portfolio..................................12
References...........................................................................................................................................18
1
Investment Proposal Report
Dear Client,
This report is regarding the investment portfolio proposal based upon your investment
requirements and objectives in accordance with your risk profile. We are providing you the
following details after analysing the condition of financial markets in accordance with your
requirements.
Brief summary of the economic conditions and current investment environment.
Investment strategy based upon above summary and your investment guidelines.
Presentation of the recommended initial investment portfolio based upon above
investment strategy to meet your risk and return objectives.
2
⊘ This is a preview!⊘
Do you want full access?
Subscribe today to unlock all pages.
Trusted by 1+ million students worldwide
Investment Proposal Report
1) Economic and Investment Environment Summary
Recent Market Trend and Performance:
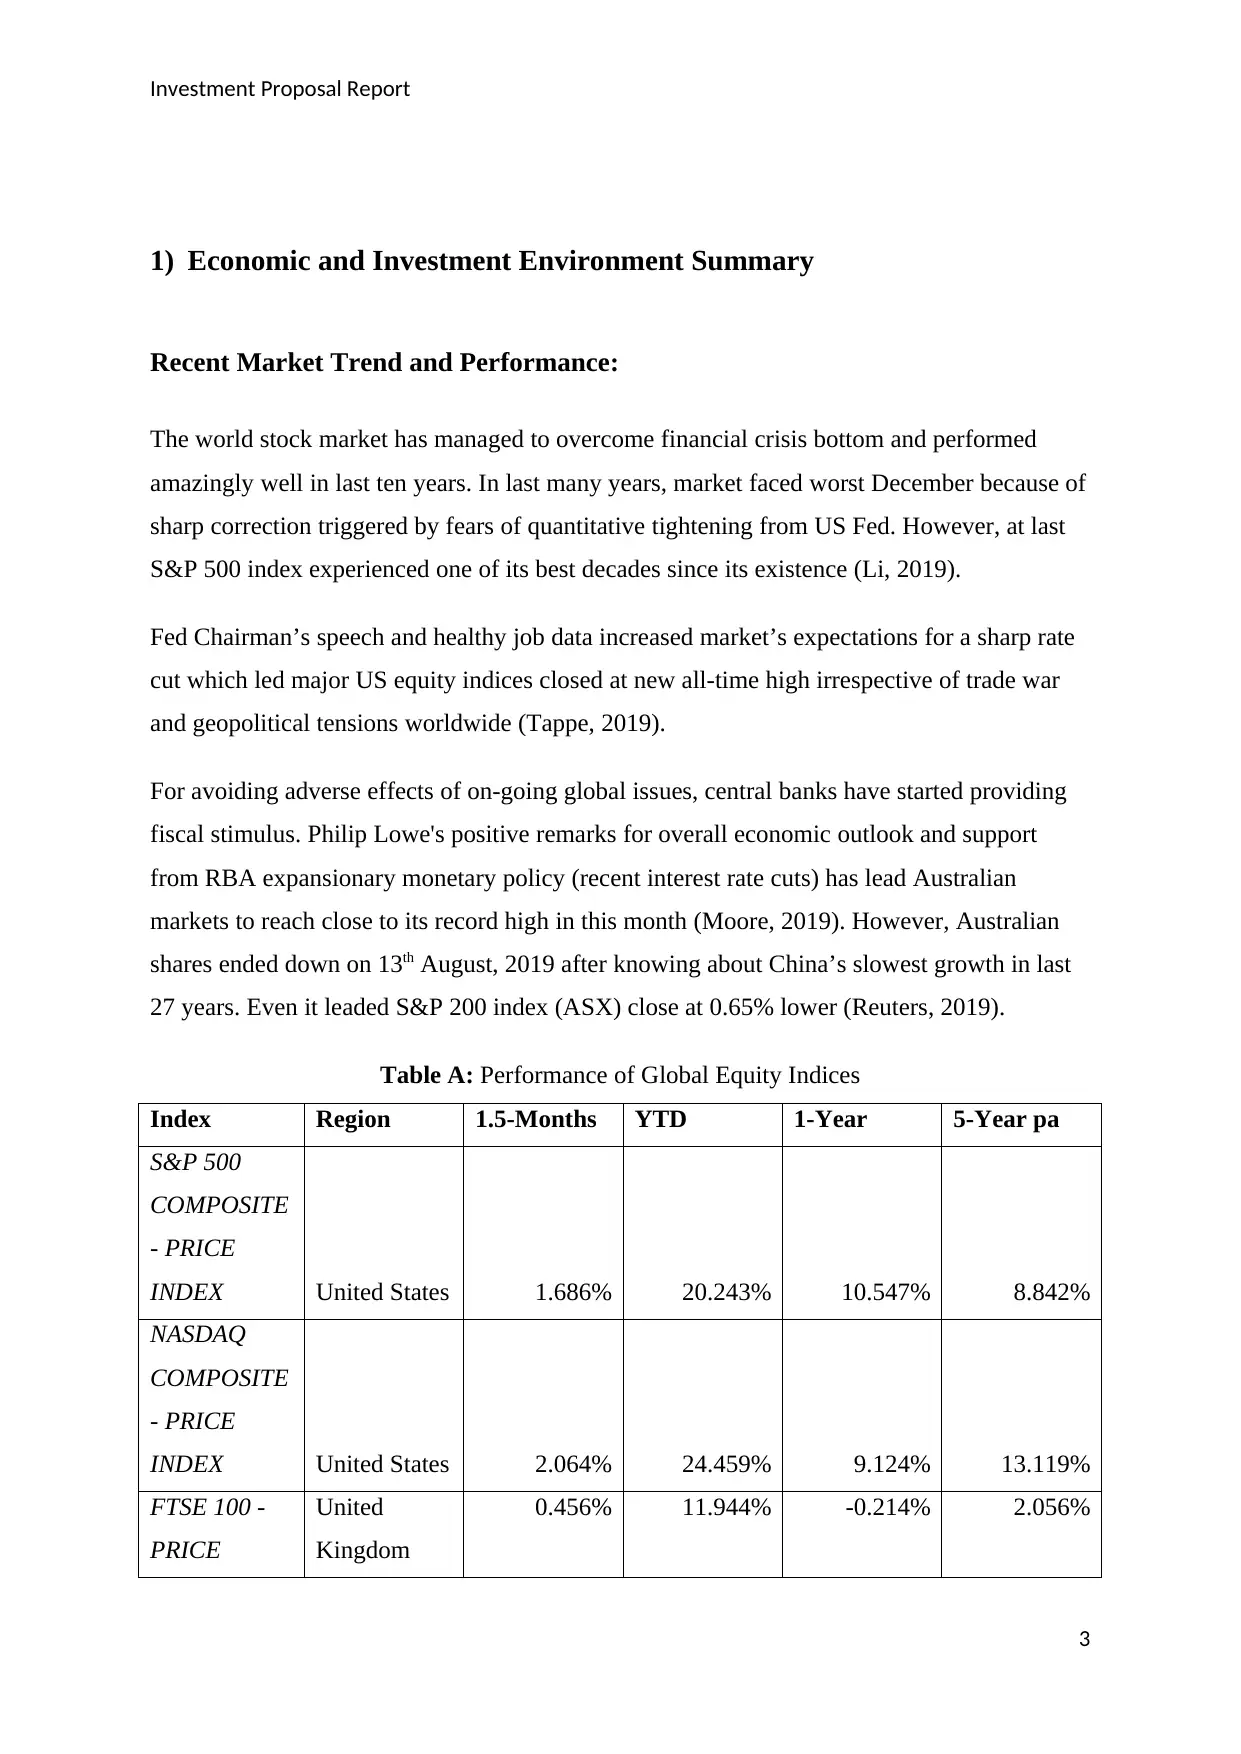
The world stock market has managed to overcome financial crisis bottom and performed
amazingly well in last ten years. In last many years, market faced worst December because of
sharp correction triggered by fears of quantitative tightening from US Fed. However, at last
S&P 500 index experienced one of its best decades since its existence (Li, 2019).
Fed Chairman’s speech and healthy job data increased market’s expectations for a sharp rate
cut which led major US equity indices closed at new all-time high irrespective of trade war
and geopolitical tensions worldwide (Tappe, 2019).
For avoiding adverse effects of on-going global issues, central banks have started providing
fiscal stimulus. Philip Lowe's positive remarks for overall economic outlook and support
from RBA expansionary monetary policy (recent interest rate cuts) has lead Australian
markets to reach close to its record high in this month (Moore, 2019). However, Australian
shares ended down on 13th August, 2019 after knowing about China’s slowest growth in last
27 years. Even it leaded S&P 200 index (ASX) close at 0.65% lower (Reuters, 2019).
Table A: Performance of Global Equity Indices
Index Region 1.5-Months YTD 1-Year 5-Year pa
S&P 500
COMPOSITE
- PRICE
INDEX United States 1.686% 20.243% 10.547% 8.842%
NASDAQ
COMPOSITE
- PRICE
INDEX United States 2.064% 24.459% 9.124% 13.119%
FTSE 100 -
PRICE
United
Kingdom
0.456% 11.944% -0.214% 2.056%
3
1) Economic and Investment Environment Summary
Recent Market Trend and Performance:
The world stock market has managed to overcome financial crisis bottom and performed
amazingly well in last ten years. In last many years, market faced worst December because of
sharp correction triggered by fears of quantitative tightening from US Fed. However, at last
S&P 500 index experienced one of its best decades since its existence (Li, 2019).
Fed Chairman’s speech and healthy job data increased market’s expectations for a sharp rate
cut which led major US equity indices closed at new all-time high irrespective of trade war
and geopolitical tensions worldwide (Tappe, 2019).
For avoiding adverse effects of on-going global issues, central banks have started providing
fiscal stimulus. Philip Lowe's positive remarks for overall economic outlook and support
from RBA expansionary monetary policy (recent interest rate cuts) has lead Australian
markets to reach close to its record high in this month (Moore, 2019). However, Australian
shares ended down on 13th August, 2019 after knowing about China’s slowest growth in last
27 years. Even it leaded S&P 200 index (ASX) close at 0.65% lower (Reuters, 2019).
Table A: Performance of Global Equity Indices
Index Region 1.5-Months YTD 1-Year 5-Year pa
S&P 500
COMPOSITE
- PRICE
INDEX United States 1.686% 20.243% 10.547% 8.842%
NASDAQ
COMPOSITE
- PRICE
INDEX United States 2.064% 24.459% 9.124% 13.119%
FTSE 100 -
PRICE
United
Kingdom
0.456% 11.944% -0.214% 2.056%
3
Paraphrase This Document
Need a fresh take? Get an instant paraphrase of this document with our AI Paraphraser
Investment Proposal Report
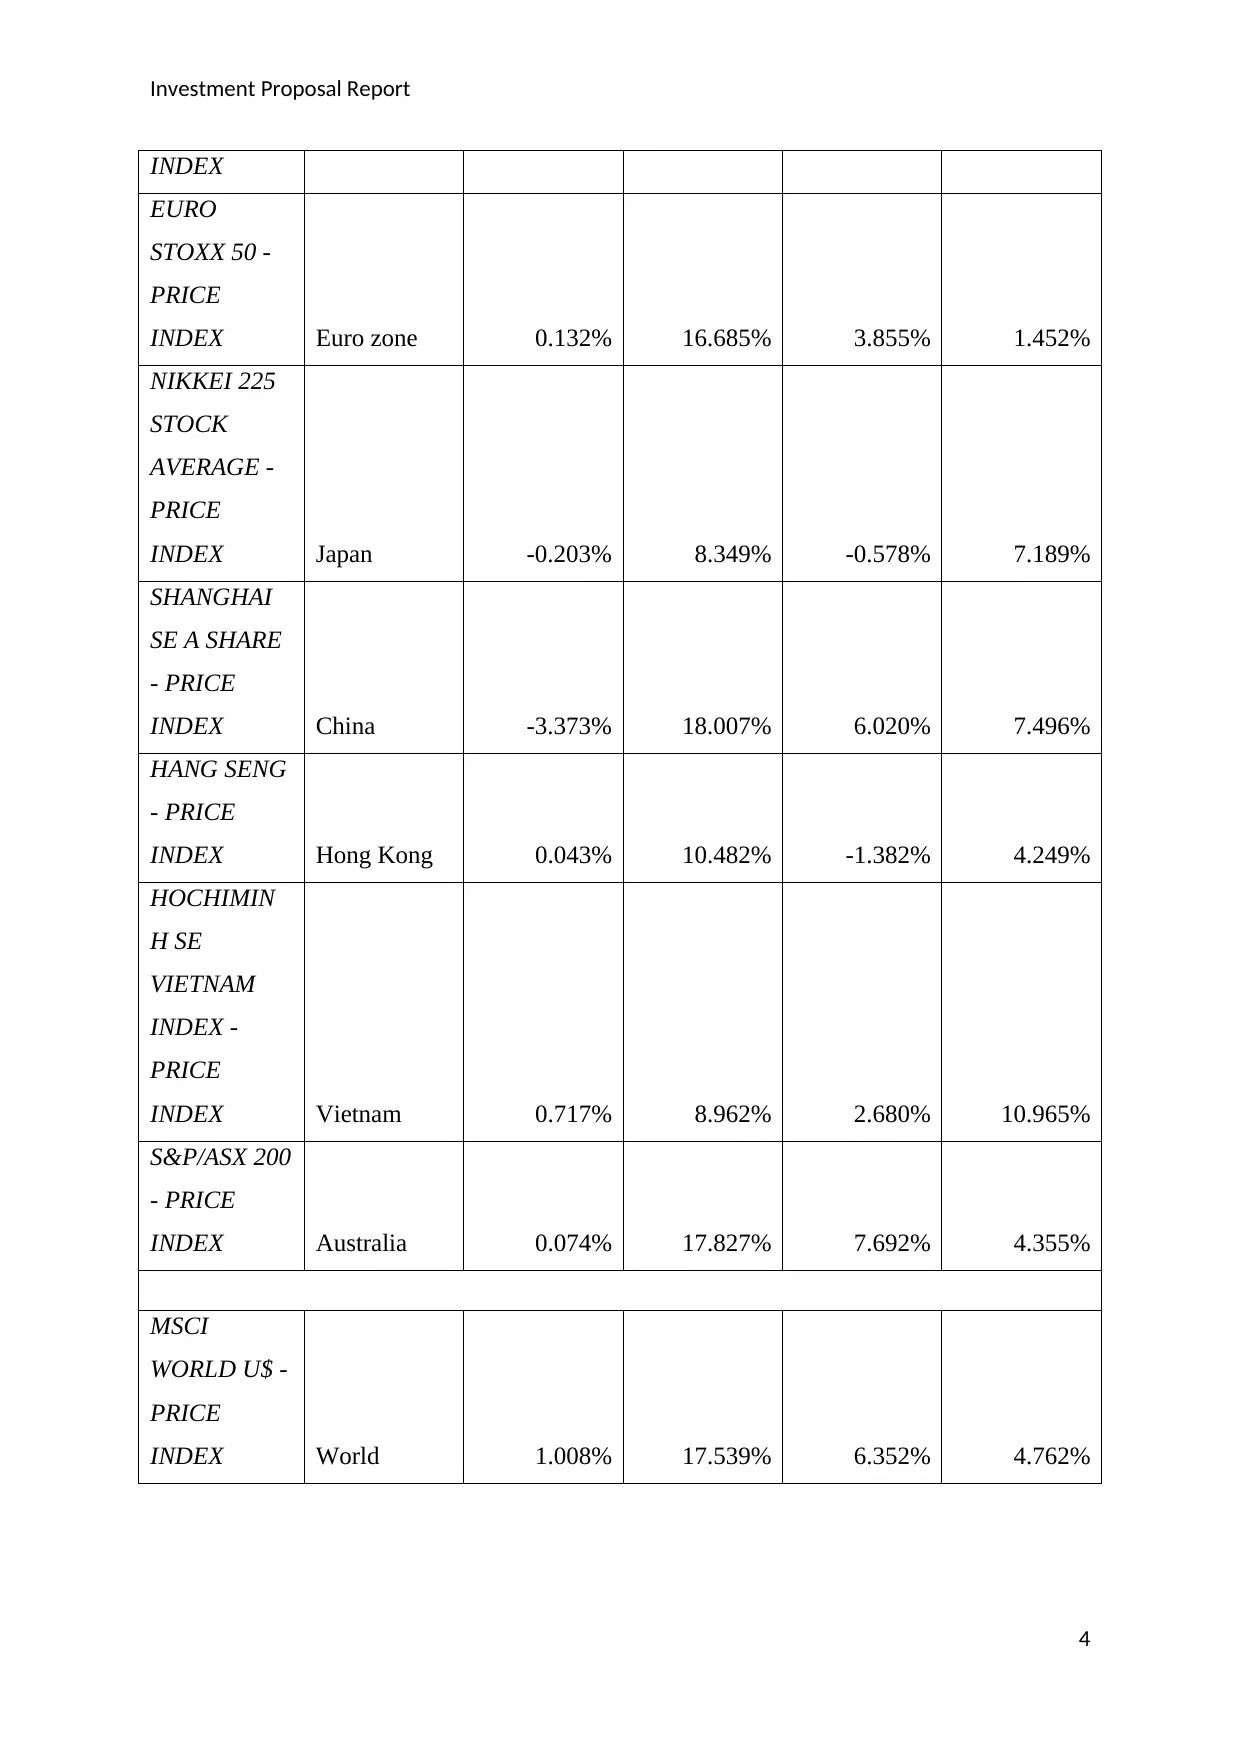
INDEX
EURO
STOXX 50 -
PRICE
INDEX Euro zone 0.132% 16.685% 3.855% 1.452%
NIKKEI 225
STOCK
AVERAGE -
PRICE
INDEX Japan -0.203% 8.349% -0.578% 7.189%
SHANGHAI
SE A SHARE
- PRICE
INDEX China -3.373% 18.007% 6.020% 7.496%
HANG SENG
- PRICE
INDEX Hong Kong 0.043% 10.482% -1.382% 4.249%
HOCHIMIN
H SE
VIETNAM
INDEX -
PRICE
INDEX Vietnam 0.717% 8.962% 2.680% 10.965%
S&P/ASX 200
- PRICE
INDEX Australia 0.074% 17.827% 7.692% 4.355%
MSCI
WORLD U$ -
PRICE
INDEX World 1.008% 17.539% 6.352% 4.762%
4
Investment Proposal Report
MSCI EM U$
- PRICE
INDEX
Emerging
markets -0.596% 9.493% -0.148% 0.121%
S&P/ASX 200
RESOURCES
- PRICE
INDEX Australia -0.592% 22.759% 12.185% 4.080%
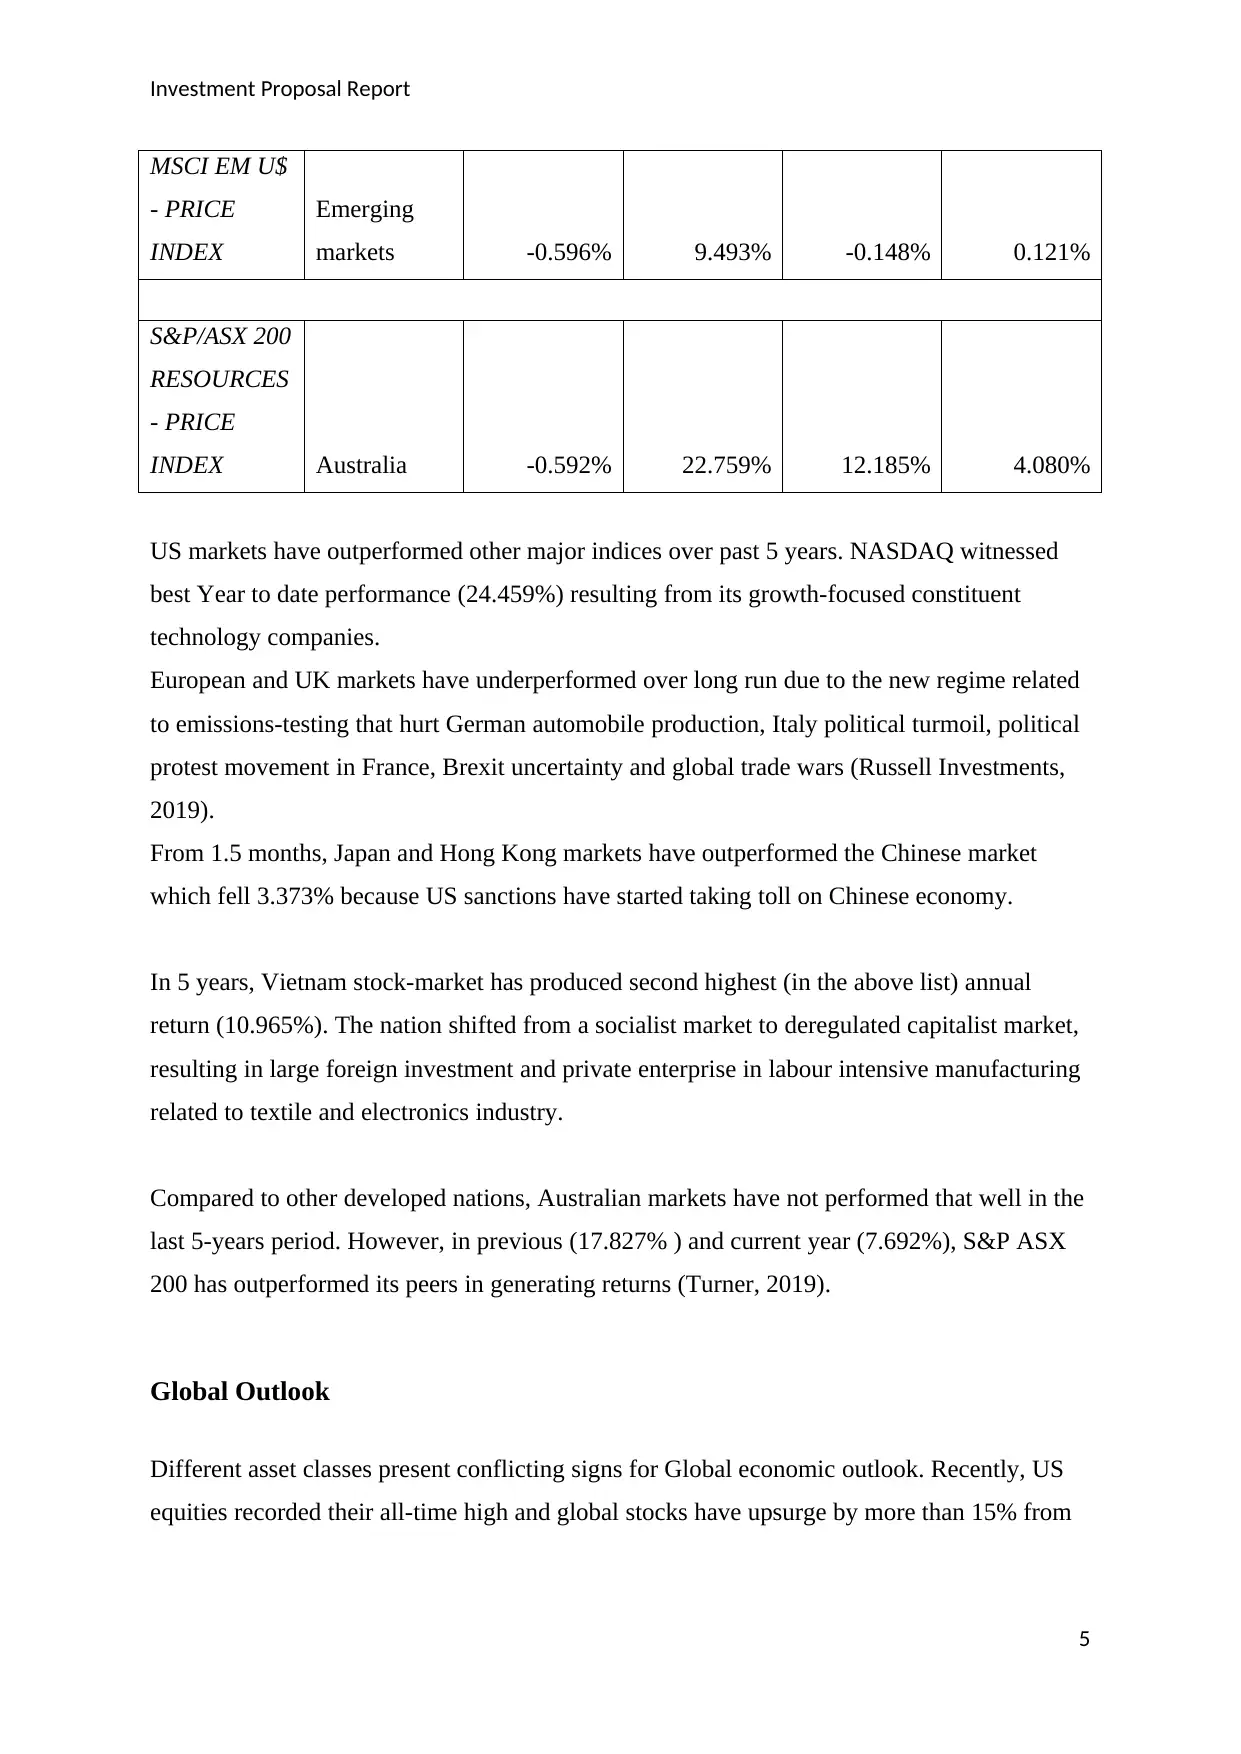
US markets have outperformed other major indices over past 5 years. NASDAQ witnessed
best Year to date performance (24.459%) resulting from its growth-focused constituent
technology companies.
European and UK markets have underperformed over long run due to the new regime related
to emissions-testing that hurt German automobile production, Italy political turmoil, political
protest movement in France, Brexit uncertainty and global trade wars (Russell Investments,
2019).
From 1.5 months, Japan and Hong Kong markets have outperformed the Chinese market
which fell 3.373% because US sanctions have started taking toll on Chinese economy.
In 5 years, Vietnam stock-market has produced second highest (in the above list) annual
return (10.965%). The nation shifted from a socialist market to deregulated capitalist market,
resulting in large foreign investment and private enterprise in labour intensive manufacturing
related to textile and electronics industry.
Compared to other developed nations, Australian markets have not performed that well in the
last 5-years period. However, in previous (17.827% ) and current year (7.692%), S&P ASX
200 has outperformed its peers in generating returns (Turner, 2019).
Global Outlook
Different asset classes present conflicting signs for Global economic outlook. Recently, US
equities recorded their all-time high and global stocks have upsurge by more than 15% from
5
MSCI EM U$
- PRICE
INDEX
Emerging
markets -0.596% 9.493% -0.148% 0.121%
S&P/ASX 200
RESOURCES
- PRICE
INDEX Australia -0.592% 22.759% 12.185% 4.080%
US markets have outperformed other major indices over past 5 years. NASDAQ witnessed
best Year to date performance (24.459%) resulting from its growth-focused constituent
technology companies.
European and UK markets have underperformed over long run due to the new regime related
to emissions-testing that hurt German automobile production, Italy political turmoil, political
protest movement in France, Brexit uncertainty and global trade wars (Russell Investments,
2019).
From 1.5 months, Japan and Hong Kong markets have outperformed the Chinese market
which fell 3.373% because US sanctions have started taking toll on Chinese economy.
In 5 years, Vietnam stock-market has produced second highest (in the above list) annual
return (10.965%). The nation shifted from a socialist market to deregulated capitalist market,
resulting in large foreign investment and private enterprise in labour intensive manufacturing
related to textile and electronics industry.
Compared to other developed nations, Australian markets have not performed that well in the
last 5-years period. However, in previous (17.827% ) and current year (7.692%), S&P ASX
200 has outperformed its peers in generating returns (Turner, 2019).
Global Outlook
Different asset classes present conflicting signs for Global economic outlook. Recently, US
equities recorded their all-time high and global stocks have upsurge by more than 15% from
5
⊘ This is a preview!⊘
Do you want full access?
Subscribe today to unlock all pages.
Trusted by 1+ million students worldwide
Investment Proposal Report
starting of year. Since May 22, US 10-year Treasury yield is trading below fed rates which
inverted yield curve resulting bond market giving recessionary signals.
The reason behind mixed signs is consideration of negative impacts of escalating trade
tensions and weakening global data along with declining expectations of inflation by bond
markets but equity markets are seeing positive effects of Central banks easing, China
stimulus and end of trade war between US and China. Global economic data displayed a
slowdown in global growth in first half of this year. This slowdown is synchronised around
the world as impact is noticeable in US, China, Europe, Asia and Latin America. Still, as per
leading economic indicators, risk of full blown recession is low for the major economies
except UK and Brazil due to BREXIT uncertainty and lagging economic reforms respectively
(The Conference Board, n.d.).There are few local geopolitical issues impacting the regional
economies like political uncertainty and movements in Europe (Italy and France) can cause
slow-down in Eurozone to linger on, US sanctions on automobiles can negatively impact
Japan and Germany, expected corporate tax laws in Japan can further slowdown its economy,
increase tensions because of revocation of special status of Jammu & Kashmir by Indian
Government can decelerate Indian sub-continent regions’ growth (Russell Investments,
2019). Venezuela’s political issues and growing tensions in Middle East, particularly Iran
nuclear program row has created uncertainties over crude oil supply (Eaton, 2019).
There exist few short run concerns relating to Global economy but China’s economic
stimulus, accommodative stance of the central banks and developments towards free trade
among other countries except US is expected to support equity markets. Majority of nations
are seeing a slower pace growth, lower business confidence and capital spending. Strong
rebound in the global economy could be seen once these geopolitical and trade war issues are
resolved.
Australian Outlook
Last year, Australia’s economy was hit hardly by drought and housing downturn. However,
fiscal and monetary stimulus will increase consumer spending via increased household
income and contribute to the economy’s growth. ASX reached close to the record levels
because of many events held during last few months.
6
Paraphrase This Document
Need a fresh take? Get an instant paraphrase of this document with our AI Paraphraser
Investment Proposal Report
Federal elections’ result boosted market sentiments as return of conservative coalition
government was totally unexpected. RBA cut the benchmark interest rate to 1% which has
been taken positively and it is expected that bank would further support growth. Job creation
to make wage growth move upwards is the other primary reason behind cutting rates. China
is the biggest trading partner for Australia’s resources and commodities and therefore trade
war has also impacted Australia. Increased prices of iron ore due to increased demand have
helped Australian resources companies, in the same way increased Chinese stimulus may
help Australian economy (Moss, 2019). Final report of Royal Commission into banking and
financial services in this year has improved fundamentals of the financial sector in Australia.
Australia may see improvement in the housing market due to Australian Prudential
Regulation Authority’s move towards increasing credit access for house owners and investors
Australian mining sector may contribute towards economic growth and to support corporate
investment and the construction-sector. According to IMF, Australian annual GDP growth
rate will be around 2.8% from 2019 -2023 (highest forecast for major developed nations)
(Sawhny, 2019).
2) Recommended Investment Strategy
According to global outlook and Australian outlook, fundamentals of the nation are strong
and it has potential to outperform in future years. Over long run and recent times US equity
indices has shown a strong performance that creates growth opportunities in US technology
sector. Your investment guidelines recommend a diversified portfolio heavily invested in
Australian market with exposure to international markets and particular exposure to
disruptive business platforms. You have also expressed concern about limiting investments in
US and China markets because of on-going trade war.
So, we recommend a portfolio with an overweight in Australian Equity where scope of
capital appreciation is high due to its good fundamentals and relative price levels.
International exposure will be through limited investment in US technological sector, which
can provide good returns over long-run. Investment in Australian market will be in large cap
companies that provides long term capital appreciation opportunities at lower risk. We expect
higher growth of Australian economy in long run and want portfolio to outperform over this
7
Investment Proposal Report
period. So, we will follow a fundamental screening strategy to construct a diversified
portfolio by choosing high quality value companies with proven track record of long term
capital growth. We will add exposure to growth focused sectors like IT and digital business to
improve the portfolio’s overall return. To further increase portfolio’s value and take benefit
of changing conditions, we will follow an active strategy to invest in companies that are
expected to outperform as per current economic outlook. The initial investment portfolio will
be formed by following above strategy by using various screenings.
Fundamental screening strategy
1) Investing in companies that provide growth at reasonable price with long run profit history
associated with the market growth in S&P/ASX 200 Index to provide additional growth at
reasonable risk: (50% of the total investment in Australian equity shares)
- Stocks with a Historical beta greater than 1.00.
- Stocks with a Price/earnings ratio less than 40.00 times.
- Stocks with PEG (PE to 5-year Earnings growth) ratio less than 1.
- Stocks with Return on equity ratio greater than 10.00%
- Stocks with Price to Book ratio less than 4.
Take long positions in all the stocks that meet above criteria.
2) Investing in value companies with long run profit history associated with the market
growth in S&P/ASX 200 Index to provide low risk long term capital appreciation: (20% of
the total investment in Australian equity shares)
- Stocks with a Historical beta between 1.00 and 2.00.
- Stocks with a Price/earnings ratio less than 20.00 times.
- Stocks with Return on equity ratio greater than 5.00%
- Stocks with Price to Book ratio less than 1.5.
- Stocks with Debt to equity less than 0.8.
Take long positions in all the stocks that meet above criteria.
8
⊘ This is a preview!⊘
Do you want full access?
Subscribe today to unlock all pages.
Trusted by 1+ million students worldwide
Investment Proposal Report
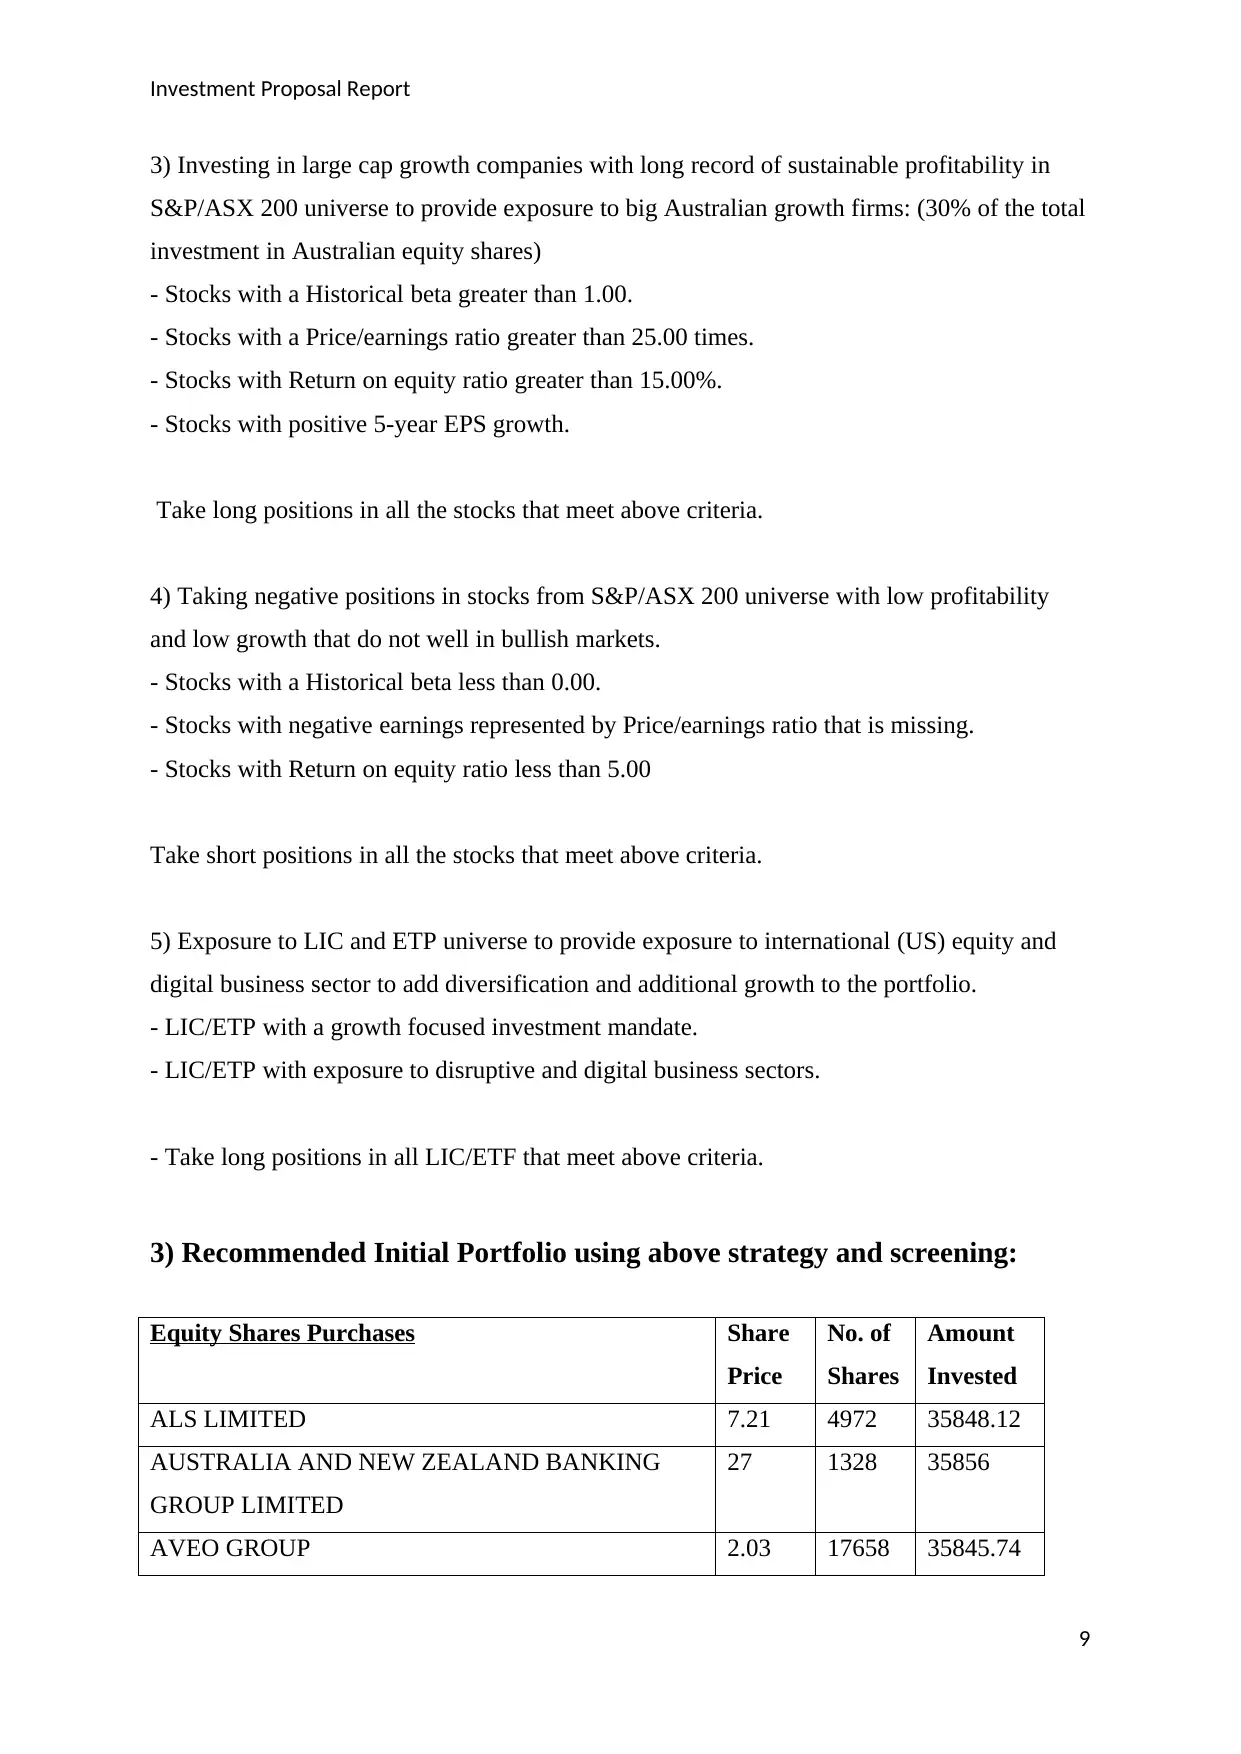
3) Investing in large cap growth companies with long record of sustainable profitability in
S&P/ASX 200 universe to provide exposure to big Australian growth firms: (30% of the total
investment in Australian equity shares)
- Stocks with a Historical beta greater than 1.00.
- Stocks with a Price/earnings ratio greater than 25.00 times.
- Stocks with Return on equity ratio greater than 15.00%.
- Stocks with positive 5-year EPS growth.
Take long positions in all the stocks that meet above criteria.
4) Taking negative positions in stocks from S&P/ASX 200 universe with low profitability
and low growth that do not well in bullish markets.
- Stocks with a Historical beta less than 0.00.
- Stocks with negative earnings represented by Price/earnings ratio that is missing.
- Stocks with Return on equity ratio less than 5.00
Take short positions in all the stocks that meet above criteria.
5) Exposure to LIC and ETP universe to provide exposure to international (US) equity and
digital business sector to add diversification and additional growth to the portfolio.
- LIC/ETP with a growth focused investment mandate.
- LIC/ETP with exposure to disruptive and digital business sectors.
- Take long positions in all LIC/ETF that meet above criteria.
3) Recommended Initial Portfolio using above strategy and screening:
Equity Shares Purchases Share
Price
No. of
Shares
Amount
Invested
ALS LIMITED 7.21 4972 35848.12
AUSTRALIA AND NEW ZEALAND BANKING
GROUP LIMITED
27 1328 35856
AVEO GROUP 2.03 17658 35845.74
9
Paraphrase This Document
Need a fresh take? Get an instant paraphrase of this document with our AI Paraphraser
Investment Proposal Report
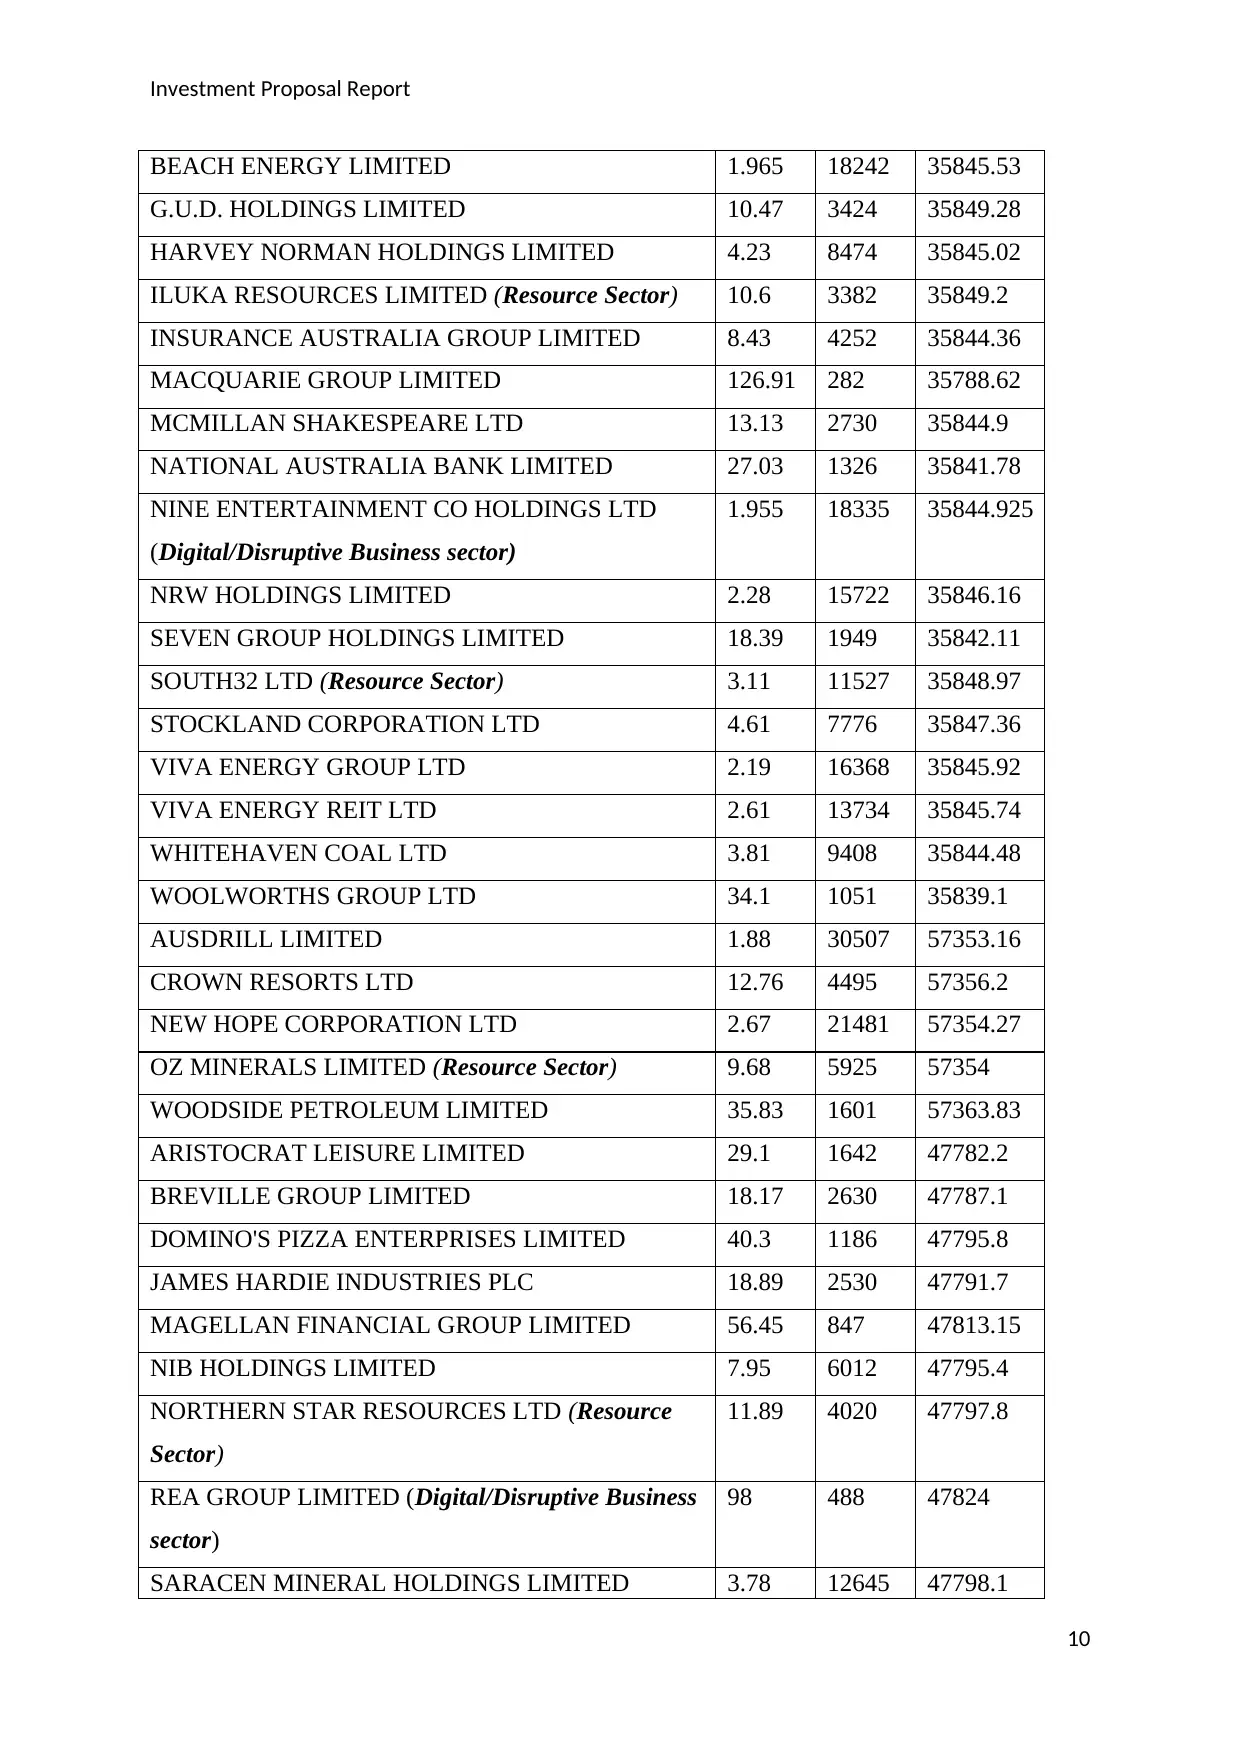
BEACH ENERGY LIMITED 1.965 18242 35845.53
G.U.D. HOLDINGS LIMITED 10.47 3424 35849.28
HARVEY NORMAN HOLDINGS LIMITED 4.23 8474 35845.02
ILUKA RESOURCES LIMITED (Resource Sector) 10.6 3382 35849.2
INSURANCE AUSTRALIA GROUP LIMITED 8.43 4252 35844.36
MACQUARIE GROUP LIMITED 126.91 282 35788.62
MCMILLAN SHAKESPEARE LTD 13.13 2730 35844.9
NATIONAL AUSTRALIA BANK LIMITED 27.03 1326 35841.78
NINE ENTERTAINMENT CO HOLDINGS LTD
(Digital/Disruptive Business sector)
1.955 18335 35844.925
NRW HOLDINGS LIMITED 2.28 15722 35846.16
SEVEN GROUP HOLDINGS LIMITED 18.39 1949 35842.11
SOUTH32 LTD (Resource Sector) 3.11 11527 35848.97
STOCKLAND CORPORATION LTD 4.61 7776 35847.36
VIVA ENERGY GROUP LTD 2.19 16368 35845.92
VIVA ENERGY REIT LTD 2.61 13734 35845.74
WHITEHAVEN COAL LTD 3.81 9408 35844.48
WOOLWORTHS GROUP LTD 34.1 1051 35839.1
AUSDRILL LIMITED 1.88 30507 57353.16
CROWN RESORTS LTD 12.76 4495 57356.2
NEW HOPE CORPORATION LTD 2.67 21481 57354.27
OZ MINERALS LIMITED (Resource Sector) 9.68 5925 57354
WOODSIDE PETROLEUM LIMITED 35.83 1601 57363.83
ARISTOCRAT LEISURE LIMITED 29.1 1642 47782.2
BREVILLE GROUP LIMITED 18.17 2630 47787.1
DOMINO'S PIZZA ENTERPRISES LIMITED 40.3 1186 47795.8
JAMES HARDIE INDUSTRIES PLC 18.89 2530 47791.7
MAGELLAN FINANCIAL GROUP LIMITED 56.45 847 47813.15
NIB HOLDINGS LIMITED 7.95 6012 47795.4
NORTHERN STAR RESOURCES LTD (Resource
Sector)
11.89 4020 47797.8
REA GROUP LIMITED (Digital/Disruptive Business
sector)
98 488 47824
SARACEN MINERAL HOLDINGS LIMITED 3.78 12645 47798.1
10
Investment Proposal Report
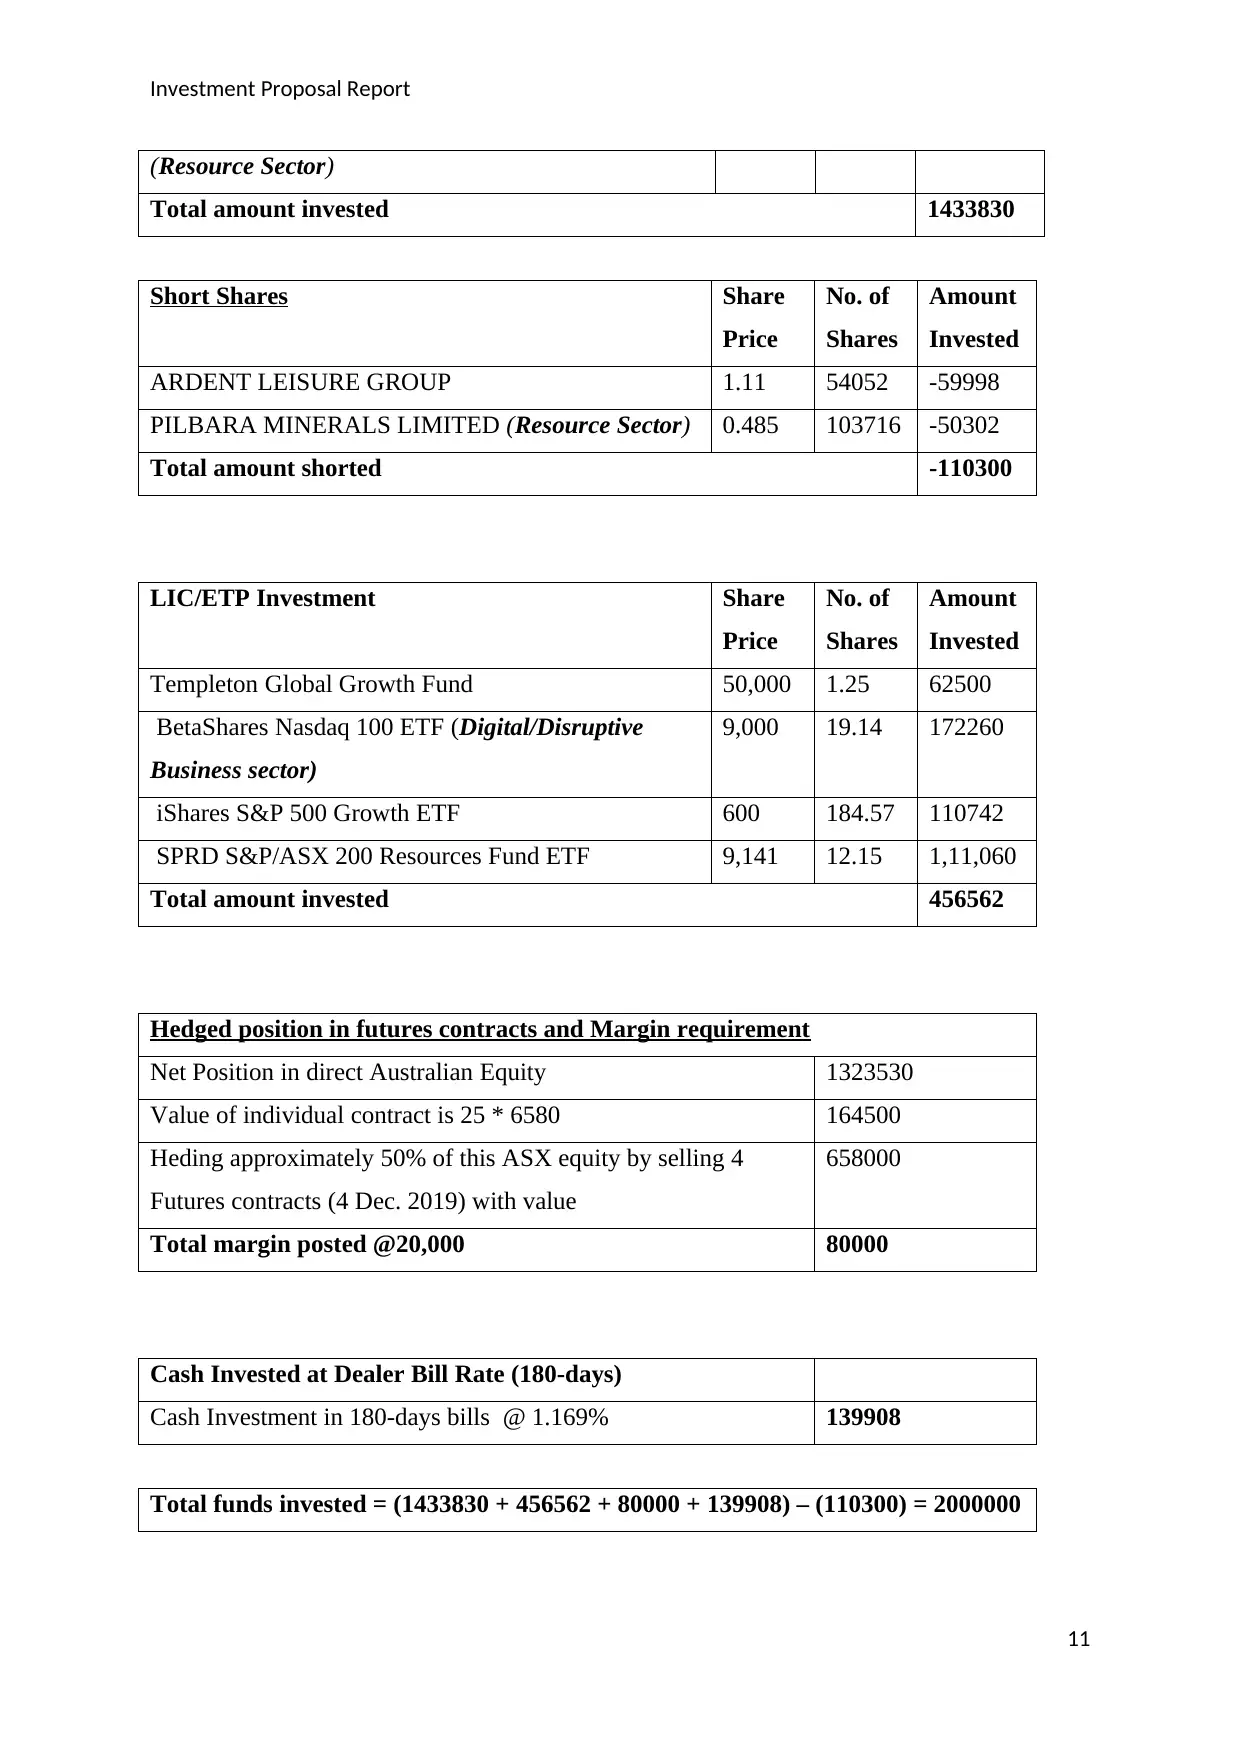
(Resource Sector)
Total amount invested 1433830
Short Shares Share
Price
No. of
Shares
Amount
Invested
ARDENT LEISURE GROUP 1.11 54052 -59998
PILBARA MINERALS LIMITED (Resource Sector) 0.485 103716 -50302
Total amount shorted -110300
LIC/ETP Investment Share
Price
No. of
Shares
Amount
Invested
Templeton Global Growth Fund 50,000 1.25 62500
BetaShares Nasdaq 100 ETF (Digital/Disruptive
Business sector)
9,000 19.14 172260
iShares S&P 500 Growth ETF 600 184.57 110742
SPRD S&P/ASX 200 Resources Fund ETF 9,141 12.15 1,11,060
Total amount invested 456562
Hedged position in futures contracts and Margin requirement
Net Position in direct Australian Equity 1323530
Value of individual contract is 25 * 6580 164500
Heding approximately 50% of this ASX equity by selling 4
Futures contracts (4 Dec. 2019) with value
658000
Total margin posted @20,000 80000
Cash Invested at Dealer Bill Rate (180-days)
Cash Investment in 180-days bills @ 1.169% 139908
Total funds invested = (1433830 + 456562 + 80000 + 139908) – (110300) = 2000000
11
⊘ This is a preview!⊘
Do you want full access?
Subscribe today to unlock all pages.
Trusted by 1+ million students worldwide
1 out of 20
Related Documents


Your All-in-One AI-Powered Toolkit for Academic Success.
+13062052269
info@desklib.com
Available 24*7 on WhatsApp / Email
![[object Object]](/_next/static/media/star-bottom.7253800d.svg)
Unlock your academic potential
Copyright © 2020–2026 A2Z Services. All Rights Reserved. Developed and managed by ZUCOL.