Marks & Spencer PLC: Investment Ratio Analysis and Performance Review

Verified

Added on  2020/01/21

|5
|652
|66
Report
AI Summary
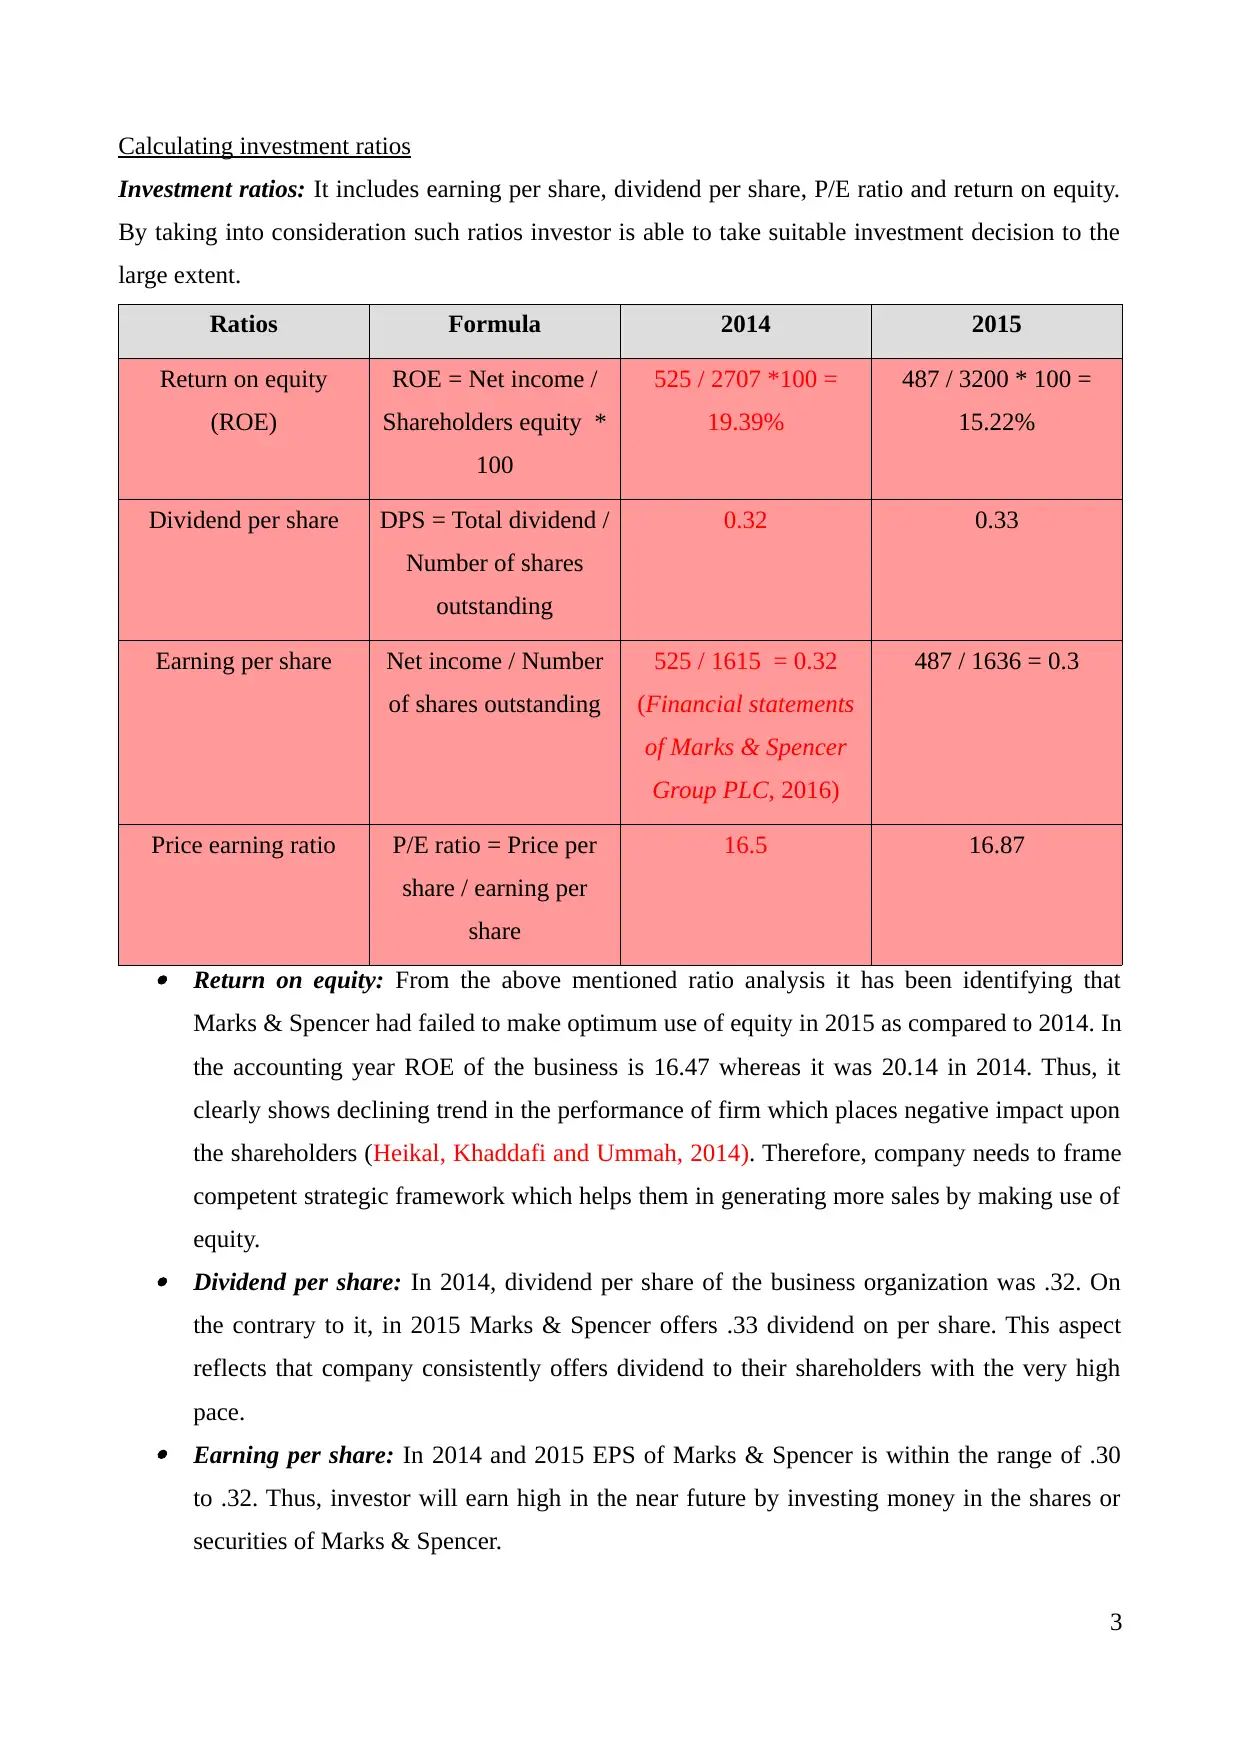
This report provides an analysis of key investment ratios for Marks & Spencer, including Return on Equity (ROE), Dividend Per Share (DPS), Earnings Per Share (EPS), and Price-Earnings (P/E) ratio. The analysis covers the years 2014 and 2015, comparing the performance of the company across these financial metrics. The report highlights trends such as a decline in ROE and an increase in DPS, offering insights into the company's financial health and investment potential. The findings suggest that while the company maintained a consistent dividend payout, its overall equity utilization declined, which may impact shareholder value. The report references relevant financial statements and academic sources to support its conclusions and provides a comprehensive overview of the company's financial performance based on the analyzed investment ratios. The report is available on Desklib for students seeking financial analysis resources.
Document Page
Investment Ratios
1
tabler-icon-diamond-filled.svg

Paraphrase This Document

Need a fresh take? Get an instant paraphrase of this document with our AI Paraphraser
Document Page
Table of Contents
Calculating investment ratios...........................................................................................................3
REFERENCES.....................................................................................................................................5
2
Document Page
Calculating investment ratios
Investment ratios: It includes earning per share, dividend per share, P/E ratio and return on equity.
By taking into consideration such ratios investor is able to take suitable investment decision to the
large extent.
Ratios Formula 2014 2015
Return on equity
(ROE)
ROE = Net income /
Shareholders equity *
100
525 / 2707 *100 =
19.39%
487 / 3200 * 100 =
15.22%
Dividend per share DPS = Total dividend /
Number of shares
outstanding
0.32 0.33
Earning per share Net income / Number
of shares outstanding
525 / 1615 = 0.32
(Financial statements
of Marks & Spencer
Group PLC, 2016)
487 / 1636 = 0.3
Price earning ratio P/E ratio = Price per
share / earning per
share
16.5 16.87
Return on equity: From the above mentioned ratio analysis it has been identifying that
Marks & Spencer had failed to make optimum use of equity in 2015 as compared to 2014. In
the accounting year ROE of the business is 16.47 whereas it was 20.14 in 2014. Thus, it
clearly shows declining trend in the performance of firm which places negative impact upon
the shareholders (Heikal, Khaddafi and Ummah, 2014). Therefore, company needs to frame
competent strategic framework which helps them in generating more sales by making use of
equity. Dividend per share: In 2014, dividend per share of the business organization was .32. On
the contrary to it, in 2015 Marks & Spencer offers .33 dividend on per share. This aspect
reflects that company consistently offers dividend to their shareholders with the very high
pace. Earning per share: In 2014 and 2015 EPS of Marks & Spencer is within the range of .30
to .32. Thus, investor will earn high in the near future by investing money in the shares or
securities of Marks & Spencer.
3
Document Page
Price earning ratio: P/E ratio of Marks & Spencer inclined in the year of 2015 in
comparison to 2014. During the accounting year 2014 P/E ratio of the firm was 16.5
whereas it is 16.87 in the previous year. On the basis of all the above mentioned aspect it can
be stated that investor should invest money in the securities of marks & Spencer and thereby
enjoys the benefit of it (Hu and et.al., 2012).
4
tabler-icon-diamond-filled.svg

Paraphrase This Document

Need a fresh take? Get an instant paraphrase of this document with our AI Paraphraser
Document Page
REFERENCES
Books and Journals
Heikal, M., Khaddafi, M. and Ummah, A., 2014. Influence Analysis of Return on Assets (ROA),
Return on Equity (ROE), Net Profit Margin (NPM), Debt To Equity Ratio (DER), and
current ratio (CR), Against Corporate Profit Growth In Automotive In Indonesia Stock
Exchange. International Journal of Academic Research in Business and Social Sciences.
4(12). p. 101.
Hu, Z. and et.al., 2012. Improved in situ Hf isotope ratio analysis of zircon using newly designed X
skimmer cone and jet sample cone in combination with the addition of nitrogen by laser
ablation multiple collector ICP-MS. Journal of Analytical Atomic Spectrometry. 27(9).
pp.1391-1399.
Online
Financial statements of Marks & Spencer Group PLC, 2016. [Online]. Available through:
<http://financials.morningstar.com/income-statement/is.html?
t=MKS&region=gbr&culture=en-US>. [Accessed on 19th April 2016].
5
chevron_up_icon
1 out of 5
circle_padding
hide_on_mobile
zoom_out_icon
[object Object]