Investment Management: Evaluating SML, CML, CAPM & Portfolio Risk
VerifiedAdded on 2023/06/12
|13
|2801
|330
Essay
AI Summary
This essay provides an in-depth analysis of investment management principles, focusing on the Security Market Line (SML), Capital Market Line (CML), and Capital Asset Pricing Model (CAPM). It explains the differences between SML and CML, highlighting their roles in assessing risk and return. The essay also discusses the importance of minimum portfolio variance in reducing investment risk and maximizing profits, emphasizing its application in safeguarding investment capital. Furthermore, it evaluates the significance of the CAPM equation in calculating the required rate of return compared to other methods, noting its simplicity and widespread use in the financial industry for determining the minimum acceptable return on investment. This analysis aims to provide investors with a comprehensive understanding of these tools for effective investment decision-making.
Running head: INVESTMENT MANAGEMENT
Investment Management
Name of the Student:
Name of the University:
Authors Note:
Investment Management
Name of the Student:
Name of the University:
Authors Note:
Paraphrase This Document
Need a fresh take? Get an instant paraphrase of this document with our AI Paraphraser
INVESTMENT MANAGEMENT
1
Table of Contents
Introduction:...............................................................................................................................2
Explaining and Graphically depicting how SML (Security Market Line) and CML (Capital
Market Line) are different:.........................................................................................................2
Identifying and discussing the importance of minimum portfolio variance:.............................5
Stating the significance of CAPM equation in calculating required rate of return in
comparison to other equations:..................................................................................................8
Conclusion:..............................................................................................................................10
References:...............................................................................................................................11
INVESTMENT MANAGEMENT
2
Introduction:
The overall assessment aims in identifying the significance of SML and CML line,
which could allow investor to maximise their profitability. In addition, the discussion on the
significance of minimum portfolio variance is also conducted, which is used by investor to
maximise their profits and minimise risk from investment. In addition, the assessment aims in
detecting the significance to CAPM formula in deriving the required rate of return in
comparison to other formulas used by investors. This detection of the formula would
eventually help the investors to improve their return generation capacity while reducing any
kind of risk that might incur in their Investments.
Explaining and Graphically depicting how SML (Security Market Line) and CML
(Capital Market Line) are different:
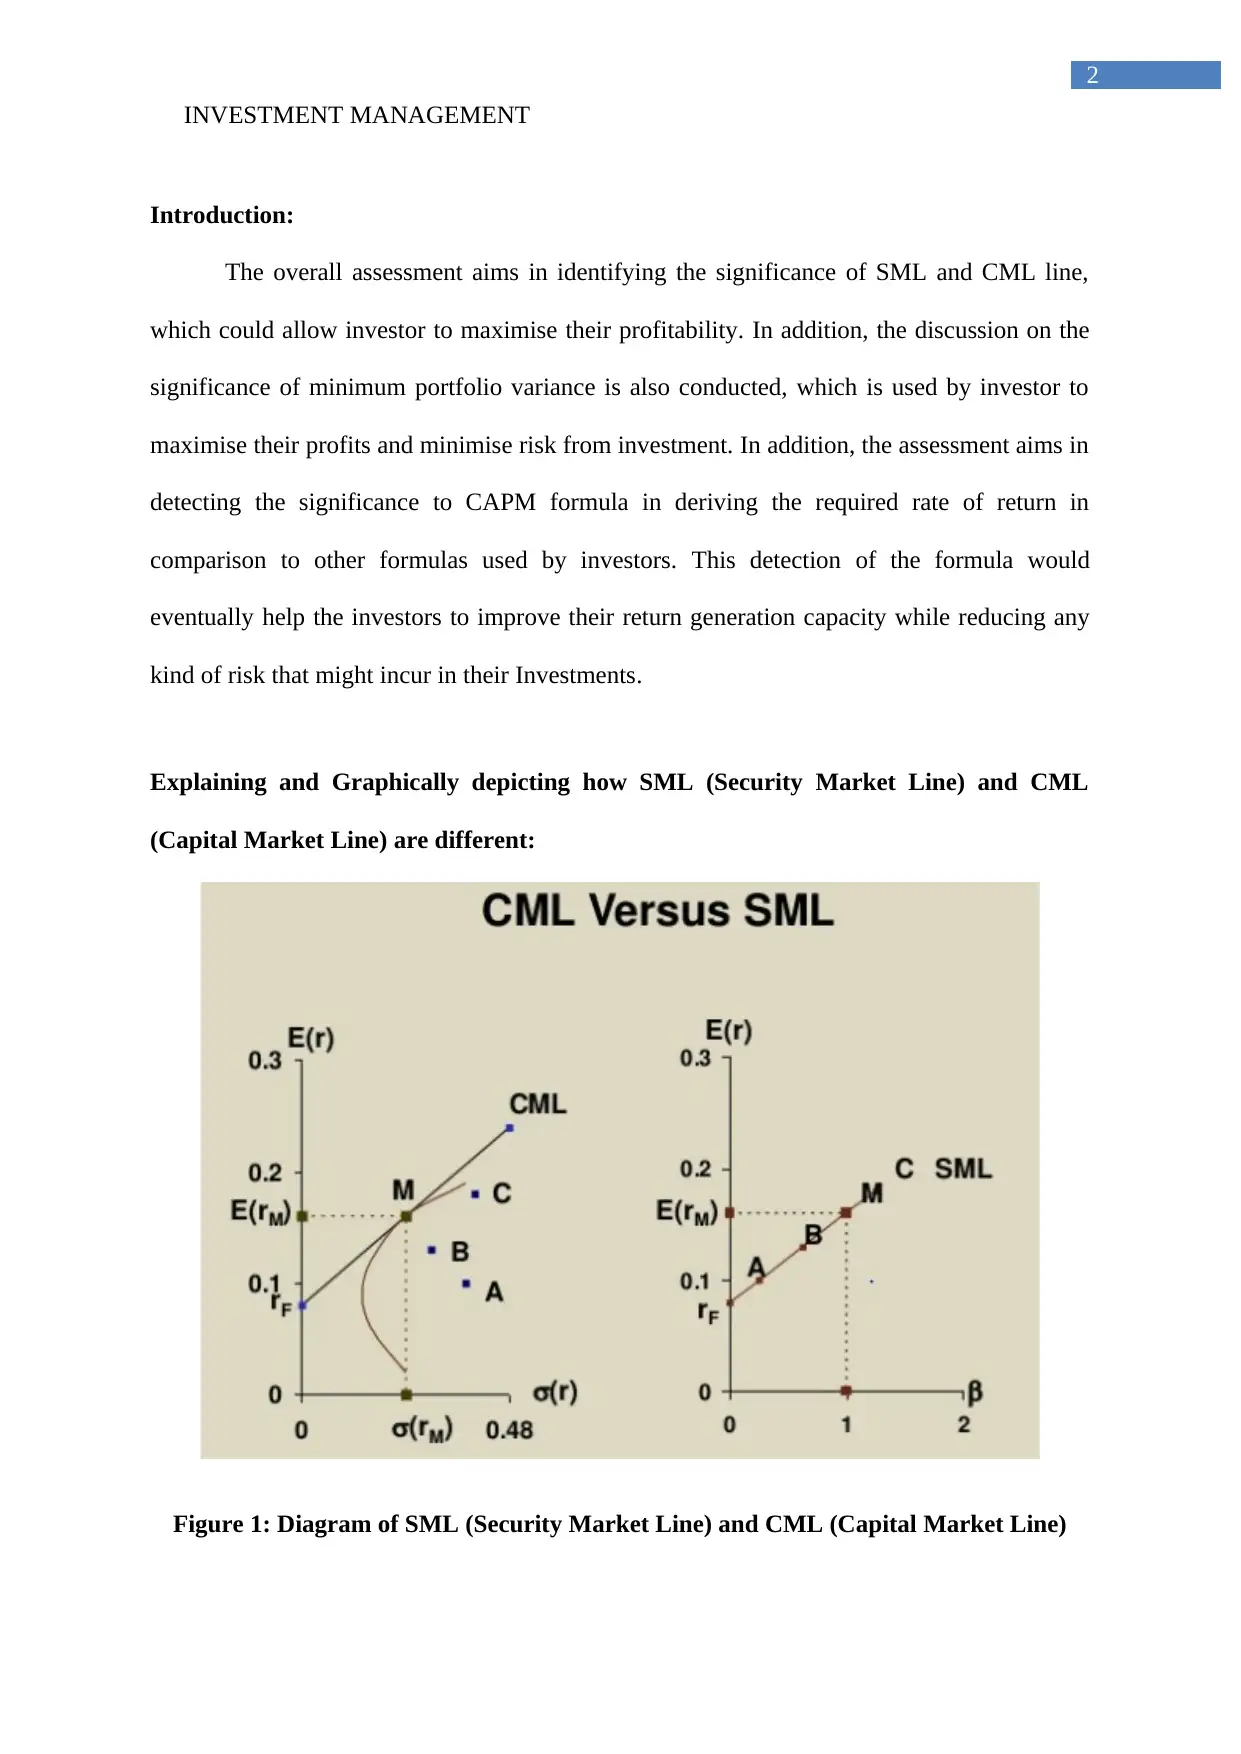
Figure 1: Diagram of SML (Security Market Line) and CML (Capital Market Line)
2
Introduction:
The overall assessment aims in identifying the significance of SML and CML line,
which could allow investor to maximise their profitability. In addition, the discussion on the
significance of minimum portfolio variance is also conducted, which is used by investor to
maximise their profits and minimise risk from investment. In addition, the assessment aims in
detecting the significance to CAPM formula in deriving the required rate of return in
comparison to other formulas used by investors. This detection of the formula would
eventually help the investors to improve their return generation capacity while reducing any
kind of risk that might incur in their Investments.
Explaining and Graphically depicting how SML (Security Market Line) and CML
(Capital Market Line) are different:
Figure 1: Diagram of SML (Security Market Line) and CML (Capital Market Line)
⊘ This is a preview!⊘
Do you want full access?
Subscribe today to unlock all pages.
Trusted by 1+ million students worldwide
INVESTMENT MANAGEMENT
3
(Source: Sharpe 2017)
The above figure mainly helps in identifying the overall difference between security
market line and capital market line which relatively provide the investors with adequate
insights of their investment scope. the function of capital market line and security market line
is the relatively same, as it allows investors to gauge into the level of risk and return provided
from their investment. However, the difference of capital market line and security market line
is relatively immense, which characterizes the level of risk and return attributes of an
investor. Investors using the Capital MarketLine is able to identify stocks which could
provide the maximum returns with minimum risk involved in Investments. On the other hand,
the security market line allows the investors to detect the viability of their Investments and
whether they are within the confinements of the market return and risk. The major difference
between the capital market line and security market line are depicted as follows.
Risk to return relationship:
Capital market line and security market line has different relationships between the
risk and return attributes of relative stocks. The capital market line relatively represents a
graphical diagram, which represents the relationship between expected return an efficient
portfolio and the total risk involved in investment. The graphical representation relatively
allows investors to identify investment scope, which has the least risk and highest rate of
return from investment. However, with the help of security market line investors are only
able to detect the individual risk and return condition orphan investment opportunity. The
function of systematic and non-diversifiable risk is identified with the help of security market
line. In this context, Sembiring et al. (2016) stated that investors by detecting stock returns
and risk are able to identify the maximum returns, which could be provided from the
Paraphrase This Document
Need a fresh take? Get an instant paraphrase of this document with our AI Paraphraser
INVESTMENT MANAGEMENT
4
investment. On the other hand, Williams and Dobelman (2017) argued that risk involvement
in investment relatively increases due to the presence of economic crisis.
Measuring of risk:
Security market line relatively helps in measuring the risk with the help of Beta,
which directly allows the investors to compare its investments with the market return and
risk. The representation of risk with the help of security market line allow the investors to
generate higher rate of return from Investments. On the other hand, the risk attributes of
capital market line are calculated with the help of standard deviation which is calculated on
the basis of total risk factor. The detection of total respective allows the capital market line
identify stocks, which would generate the highest rate of return from investment while having
minimized risk.
Portfolio efficiency:
Portfolio efficiency is a relatively detected with the help of capital market line and
security market line. However, the security market line relatively defines the efficient
portfolios which could generate the highest rate of return while having the risk involved in
investment. The measure allows the investors to change Portfolio weights for deriving the
overall investment option which would generate the highest rate of return from investment.
On the other hand, security market line defines both efficient and non-efficient portfolios,
which could allow investors to obtain high risk and return from Investments.
Equation calculation:
The calculation of security market line is relatively like the CAPM formula, which
relatively helps the investors to detect the return from Investments. Moreover, the calculation
directly allows the investors to take the maximum returns that could be generated from
INVESTMENT MANAGEMENT
5
investments in accordance with the risk attribute of the stock. On the other hand, the
calculation of Capital Market Line directly helps in detecting the highest rate of return
provided from an investment and the in efficient portfolios that lie below the cml line
(Christensen, Hail and Leuz 2016).
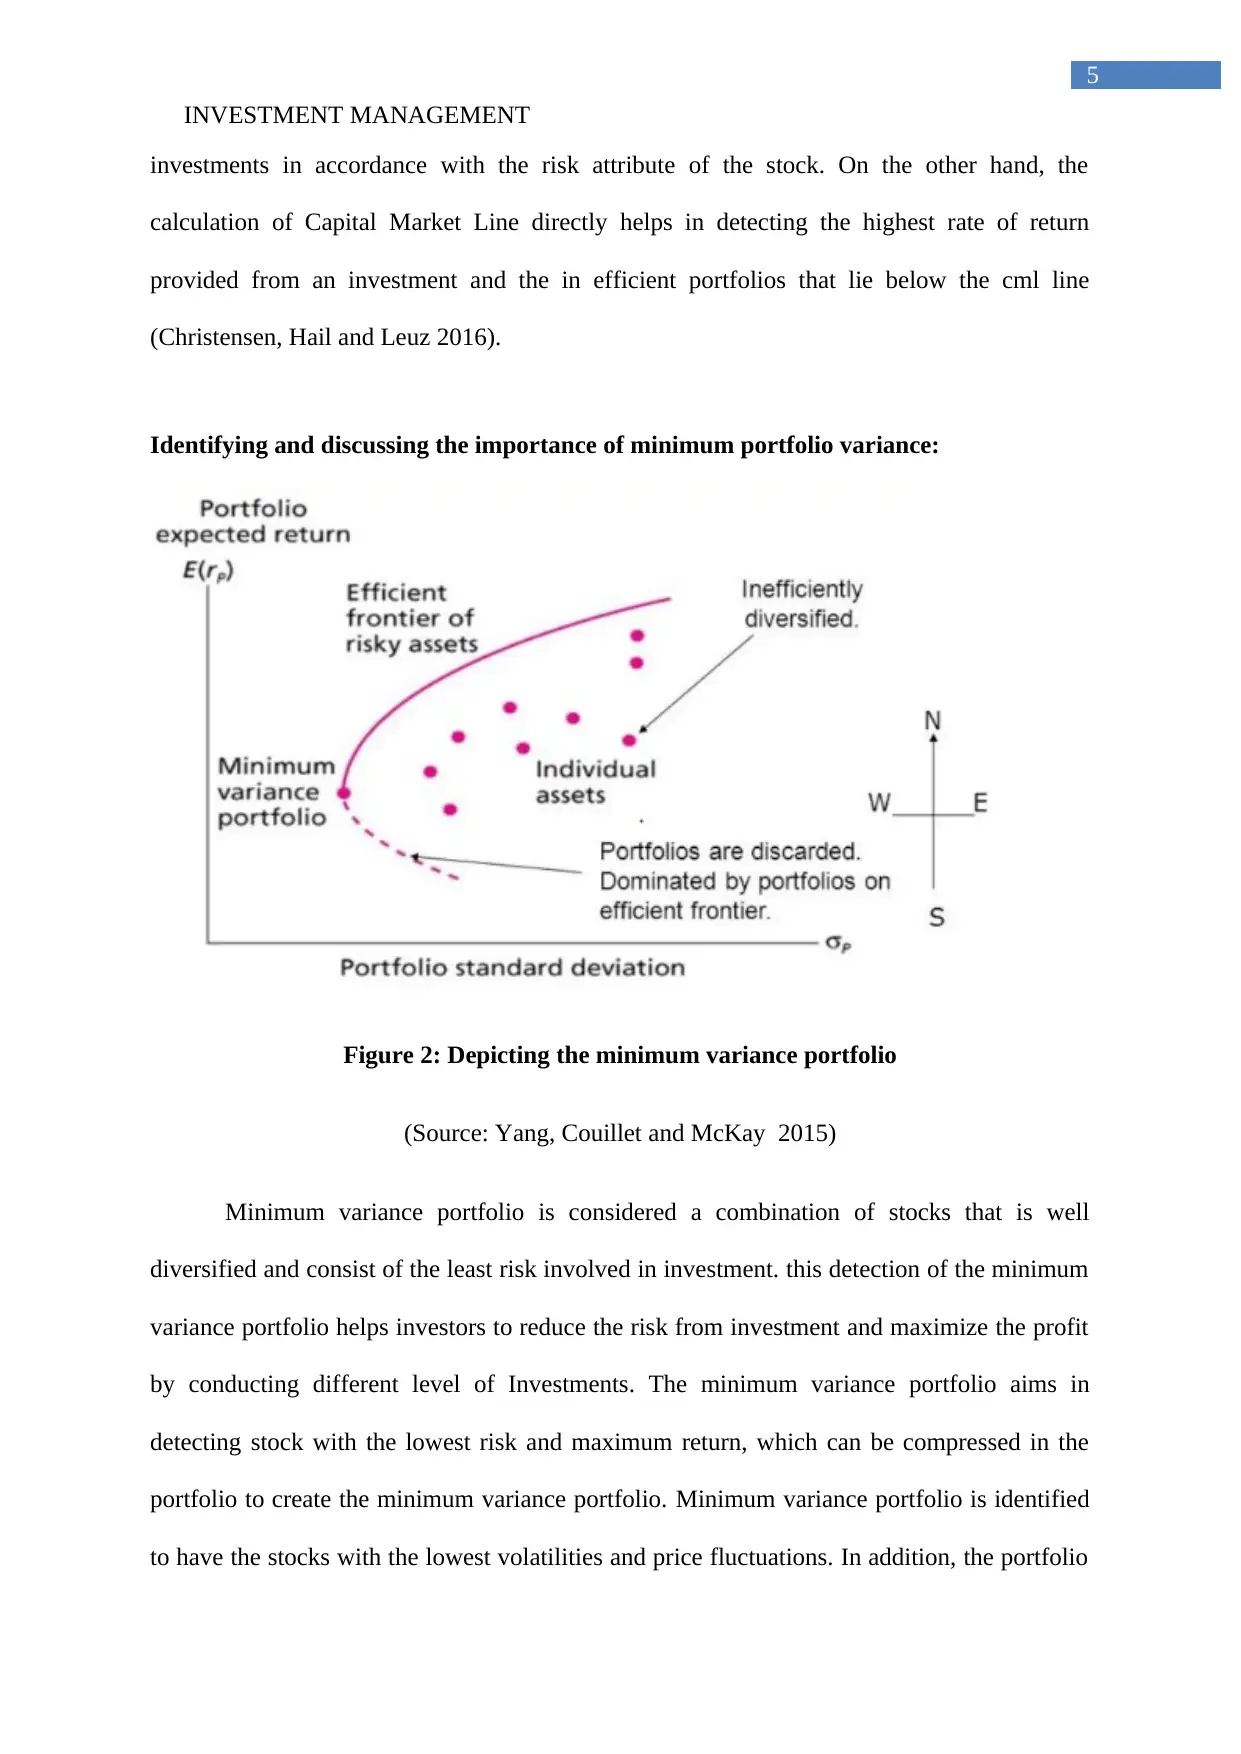
Identifying and discussing the importance of minimum portfolio variance:
Figure 2: Depicting the minimum variance portfolio
(Source: Yang, Couillet and McKay 2015)
Minimum variance portfolio is considered a combination of stocks that is well
diversified and consist of the least risk involved in investment. this detection of the minimum
variance portfolio helps investors to reduce the risk from investment and maximize the profit
by conducting different level of Investments. The minimum variance portfolio aims in
detecting stock with the lowest risk and maximum return, which can be compressed in the
portfolio to create the minimum variance portfolio. Minimum variance portfolio is identified
to have the stocks with the lowest volatilities and price fluctuations. In addition, the portfolio
5
investments in accordance with the risk attribute of the stock. On the other hand, the
calculation of Capital Market Line directly helps in detecting the highest rate of return
provided from an investment and the in efficient portfolios that lie below the cml line
(Christensen, Hail and Leuz 2016).
Identifying and discussing the importance of minimum portfolio variance:
Figure 2: Depicting the minimum variance portfolio
(Source: Yang, Couillet and McKay 2015)
Minimum variance portfolio is considered a combination of stocks that is well
diversified and consist of the least risk involved in investment. this detection of the minimum
variance portfolio helps investors to reduce the risk from investment and maximize the profit
by conducting different level of Investments. The minimum variance portfolio aims in
detecting stock with the lowest risk and maximum return, which can be compressed in the
portfolio to create the minimum variance portfolio. Minimum variance portfolio is identified
to have the stocks with the lowest volatilities and price fluctuations. In addition, the portfolio
⊘ This is a preview!⊘
Do you want full access?
Subscribe today to unlock all pages.
Trusted by 1+ million students worldwide
INVESTMENT MANAGEMENT
6
consists of stocks which has the least risk involved in investment while the combination of
stock would increase the rate of return in the portfolio. The concept of minimum variance
portfolio was derived from mortgage backed securities, where the risk level of the investment
was relatively low (Bodnar and Gupta 2015). However, the returns from investment in the
mortgage backed securities was relatively high due to the combination of payments in a
portfolio.
The importance of minimum variance portfolio is depicted as follows.
Increment in Profits:
The minimum portfolio variance relatively allows investors to maximize the profit
level as there is minimum risk involved in their Investments. The evaluation directly indicates
that constant returns are provided by the minimum portfolio theory as risk involvement is
relatively low. The companies and investors use this minimum variance portfolio to
understand the minimum return that could be generated from a particular portfolio
investment. The detection of minimum portfolio variance allows investors to adjust their risk
value in accordance with their wrists capacity, which would generate the highest rate of
returns from investment.
Reduction in negative impact from Capital market:
The minimum variance portfolio allows investors to identify stocks which has the
least risk involved in Investments. This relatively indicates the reduction in negative impact,
of capital market, on the share price movement of the stock. The stocks having low
correlation and negative correlation are relatively used in the minimum portfolio variance to
minimize or nullify risk involved in Investments. Furthermore, the evaluation also indicates
that stocks having the least risk from capital market able to hedge their portfolio against
Paraphrase This Document
Need a fresh take? Get an instant paraphrase of this document with our AI Paraphraser
INVESTMENT MANAGEMENT
7
volatile capital market. The conservative investors use the minimum portfolio variance to
maximize the profit from the least risk involved in Investments (Maillet, Tokpavi and
Vaucher 2015).
Safeguarding investment capital:
The investors and Portfolio managers are able to safeguard their investment capital
with the help of minimum portfolio variance, as they are able to understand the investment
scope of their portfolios. Investors main aim is to maximize their profits while having the
least to this from Investments, whereas it is not possible for investors to have the least risk
from Investments. The investors relatively have the minimum risk involved in investment, as
the portfolio Evaluate the way on the basis of risk and return attributes.
Using appropriate combination of weights:
The minimum portfolio variance relatively allows investors to use appropriate
combination of waste in the stock investment to generate the maximum returns while having
the least this. The minimum portfolio variance directly indicates the level of investments on a
particular stock that is listed in the portfolio. This allows the investors to identify the
minimum investment on a particular stocks, which is been conducted to maximize profits.
Therefore, minimum portfolio variance has allowed the investors to gauge into the
Investment opportunity and take adequate decisions before conducting any kind of
Investments (Bodnar, Parolya and Schmid 2018).
INVESTMENT MANAGEMENT
8
Stating the significance of CAPM equation in calculating required rate of return in
comparison to other equations:
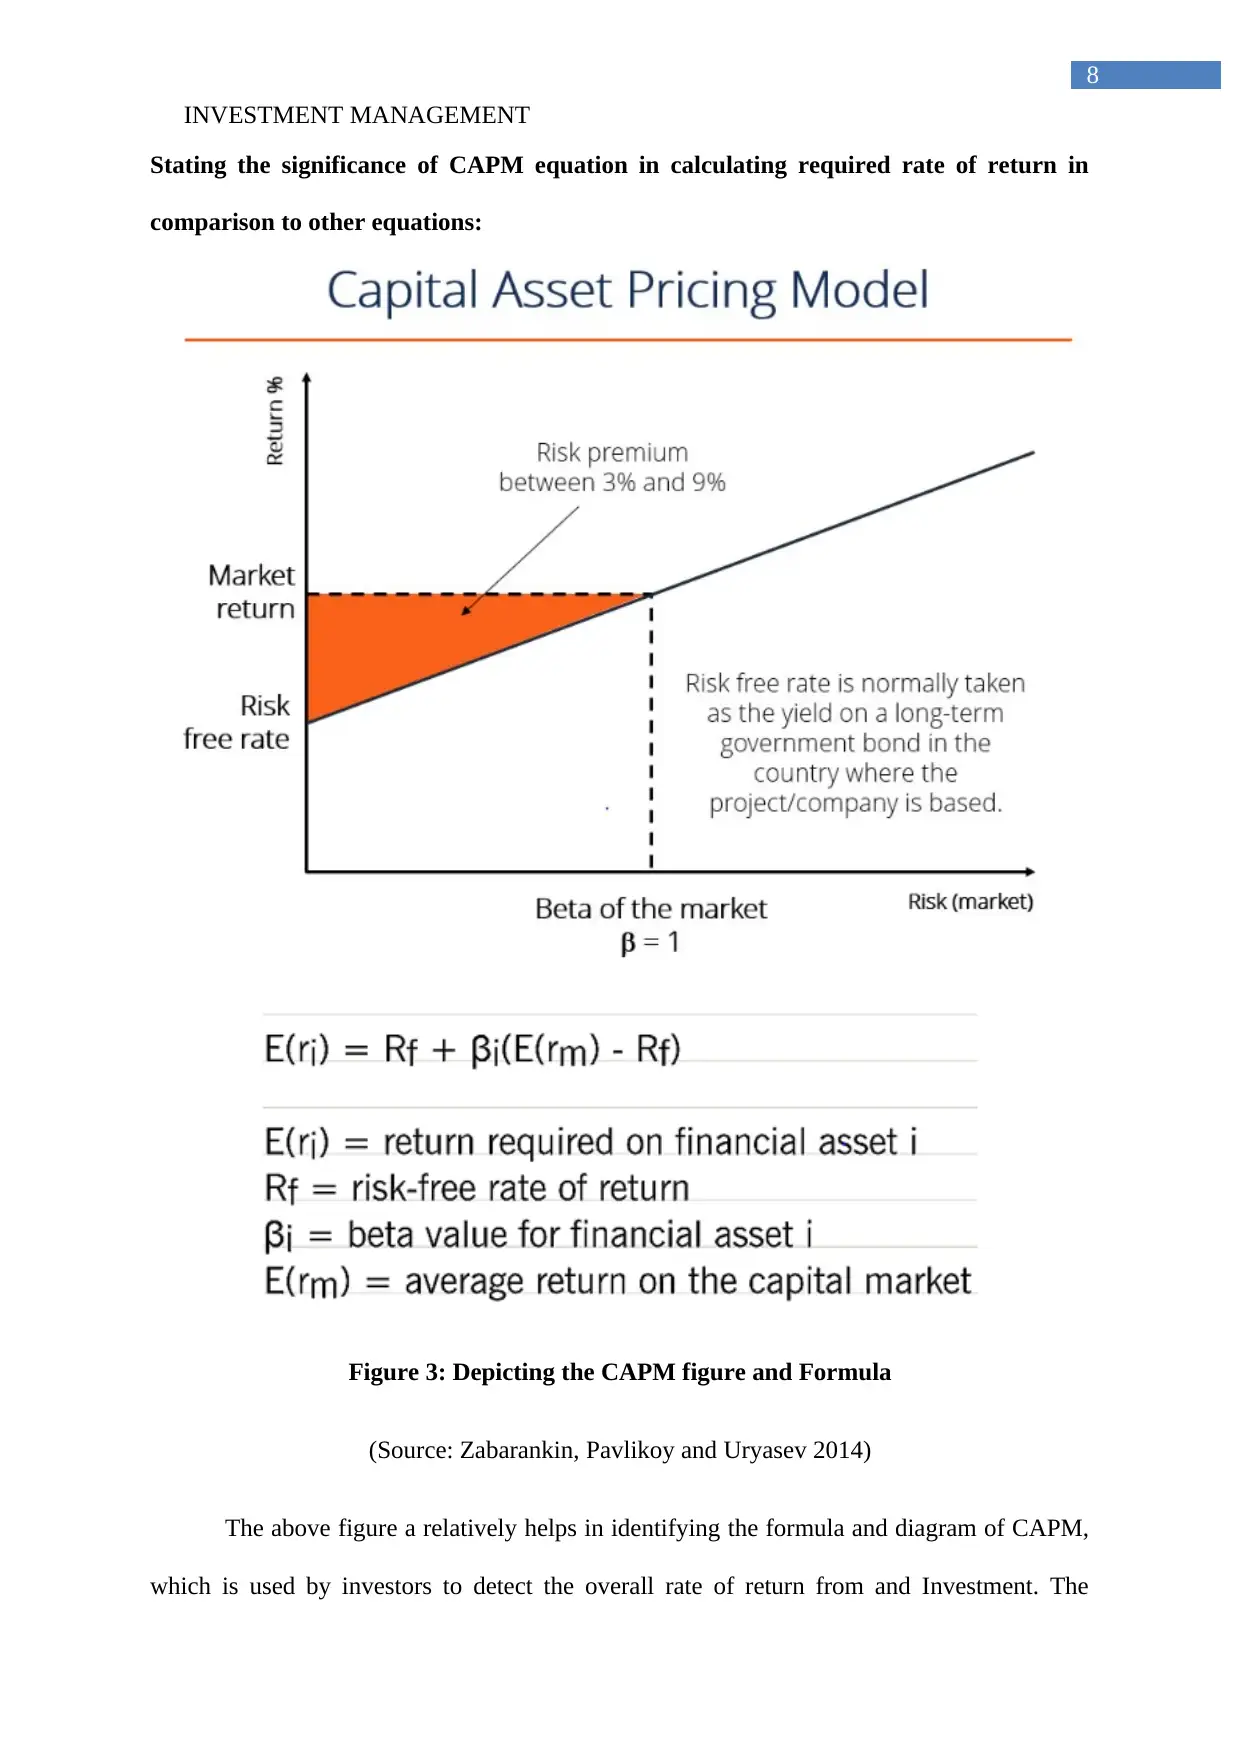
Figure 3: Depicting the CAPM figure and Formula
(Source: Zabarankin, Pavlikoy and Uryasev 2014)
The above figure a relatively helps in identifying the formula and diagram of CAPM,
which is used by investors to detect the overall rate of return from and Investment. The
8
Stating the significance of CAPM equation in calculating required rate of return in
comparison to other equations:
Figure 3: Depicting the CAPM figure and Formula
(Source: Zabarankin, Pavlikoy and Uryasev 2014)
The above figure a relatively helps in identifying the formula and diagram of CAPM,
which is used by investors to detect the overall rate of return from and Investment. The
⊘ This is a preview!⊘
Do you want full access?
Subscribe today to unlock all pages.
Trusted by 1+ million students worldwide
INVESTMENT MANAGEMENT
9
CAPM formula is relatively used for identifying the financial viability of a stock on the basis
of risk. The formula directly indicates that the risk-free rate and market return is used in
comparison to the beta of the stock to detect the maximum returns that could be provided
from an investment. the figure relatively represents the overall concept of the minimum
return that needs to be provided from an investment if the Beta is 1. This relatively indicates
the positive Attribute of an investment which could allow the investor to generate the
maximum level of return from a particular stock. However, the CAPM formula is considered
non-effective for the investors, as the derivation of Beta is difficult. Moreover, CAPM
formula is used in detecting the overall cost of equity which is used in the formula of
weighted average cost of capital (WACC) (Barberis et al. 2015).
This relatively indicates that the CAPM Formula is used by different equations and
formulas to derive the actual returns that will be generated from an investment. moreover, the
simplicity of the calculation does not minimize its effect on the actual world practices.
investment bankers and hedge fund managers use the formula for identifying the minimum
rate of return that need to be generated from a particular investment. this helps in protecting
the overall feasibility and viability of the CAPM Formula. The derivation of beaker is
identified with the correlation between the market return and stock return and while the
overall standard deviation of the returns of market is divided to detect the actual risk involved
in Investments. The beta directly helps in detecting the impact of capital market on the price
movement of shares, which could help in reducing the risk from investment (Aggarwal
2017).
The CAPM formula relatively uses the systematic risk in identifying risk return
capability of a particular stock, which relates to the current reality of the investors in which
maximum of the investments is conducted. the calculation directly helps in eliminating the
unsystematic risk involved in Investments, which is not used by investors to derive the actual
Paraphrase This Document
Need a fresh take? Get an instant paraphrase of this document with our AI Paraphraser
INVESTMENT MANAGEMENT
10
rate of return from Investments. The calculation indicates a viable approach conducted by
organization to maximize the profit level and minimize any kind of risk that is affecting their
profitability. Moreover, the CAPM formula allows the investors to derive relationship
between return and systematic risk which is helpful in deriving different level of investment
specific. the approach directly focuses its calculation on systematic risk which can be
calculated, diversify, and detected by the investors. other formulas such as dividend discount
model, weighted average Cost of capital model and other investment risk models used the
required rate of return provided by CAPM to identify the level of return that could needs to
be generated by the stock under systematic risk. Therefore, CAPM formula can be considered
as the most viable calculation method, which would allow investors to get the required rate of
return that needs to be provided from a stock (Jegadeesh et al. 2017).
Conclusion:
From the evaluation of above theories, it could be identified that with the help of
capital market line the investors able to detect the portfolios that could generate the maximum
rate of return from Investments. In addition, with minimum portfolio variance the same
portfolios could be calculated based on least risk which would generate higher rate of return
while reducing the risk involved in Investments. This kind of investment generate the
maximum returns while having the least risk from the capital market. Lastly, the CAPM
calculation relatively depicts the positive attributes of detecting the required rate of return
from investments which allow investors to identify stocks with the highest rate of return from
an investment.
INVESTMENT MANAGEMENT
11
References:
Aggarwal, R., 2017. The Fama-French Three Factor Model and the Capital Asset Pricing
Model: Evidence from the Indian Stock Market. Indian Journal of Research in Capital
Markets, 4(2), pp.36-47.
Barberis, N., Greenwood, R., Jin, L. and Shleifer, A., 2015. X-CAPM: An extrapolative
capital asset pricing model. Journal of financial economics, 115(1), pp.1-24.
Bodnar, T. and Gupta, A.K., 2015. Robustness of the inference procedures for the global
minimum variance portfolio weights in a skew-normal model. The European Journal of
Finance, 21(13-14), pp.1176-1194.
Bodnar, T., Parolya, N. and Schmid, W., 2018. Estimation of the global minimum variance
portfolio in high dimensions. European Journal of Operational Research, 266(1), pp.371-
390.
Christensen, H.B., Hail, L. and Leuz, C., 2016. Capital-market effects of securities
regulation: prior conditions, implementation, and enforcement. The Review of Financial
Studies, 29(11), pp.2885-2924.
Jegadeesh, N., Noh, J., Pukthuanthong, K., Roll, R. and Wang, J.L., 2017. Empirical tests of
asset pricing models with individual assets: Resolving the errors-in-variables bias in risk
premium estimation.
Maillet, B., Tokpavi, S. and Vaucher, B., 2015. Global minimum variance portfolio
optimisation under some model risk: A robust regression-based approach. European Journal
of Operational Research, 244(1), pp.289-299.
⊘ This is a preview!⊘
Do you want full access?
Subscribe today to unlock all pages.
Trusted by 1+ million students worldwide
1 out of 13
Related Documents


Your All-in-One AI-Powered Toolkit for Academic Success.
+13062052269
info@desklib.com
Available 24*7 on WhatsApp / Email
![[object Object]](/_next/static/media/star-bottom.7253800d.svg)
Unlock your academic potential
Copyright © 2020–2026 A2Z Services. All Rights Reserved. Developed and managed by ZUCOL.