Accounting and Finance Report: Breakeven, Investment Appraisal
VerifiedAdded on 2021/02/21
|18
|3874
|28
Report
AI Summary
This report provides a detailed analysis of accounting and finance principles, focusing on breakeven analysis and investment appraisal techniques. Part A examines an income statement, while Part B delves into breakeven analysis, margin of safety calculations, and profit computations under different sales scenarios. It also explores the assumptions and usefulness of the breakeven model. Part C analyzes capital budgeting techniques, including payback period, net present value (NPV), and average rate of return (ARR), comparing their benefits and limitations. The report includes calculations, interpretations, and working notes to support its findings, offering a comprehensive overview of financial analysis and decision-making. This report is a valuable resource for students studying finance and accounting, with practical implications for business operations and investment strategies.

Accounting and Finance
Paraphrase This Document
Need a fresh take? Get an instant paraphrase of this document with our AI Paraphraser
INTRODUCTION ..........................................................................................................................3
PART A...........................................................................................................................................4
PART B............................................................................................................................................4
A. Calculation of contribution per unit........................................................................................4
B. Evaluation of breakeven analysis and the margin of safety....................................................5
C. calculation of profits if the company produces and sells more number of units at same
selling price per unit.....................................................................................................................5
D Computation of the net profits after increasing the sales units and per unit price...................6
E Identifying and explaining the assumptions of the breakeven analysis model and its
usefulness.....................................................................................................................................6
PART C............................................................................................................................................8
b. Analyzing the benefits and the limitations of the different capital or investment appraisal
technique....................................................................................................................................10
c. Explaining and evaluating the advantages and disadvantages of various planning tools......12
CONCLUSION..............................................................................................................................15
REFERENCES..............................................................................................................................16
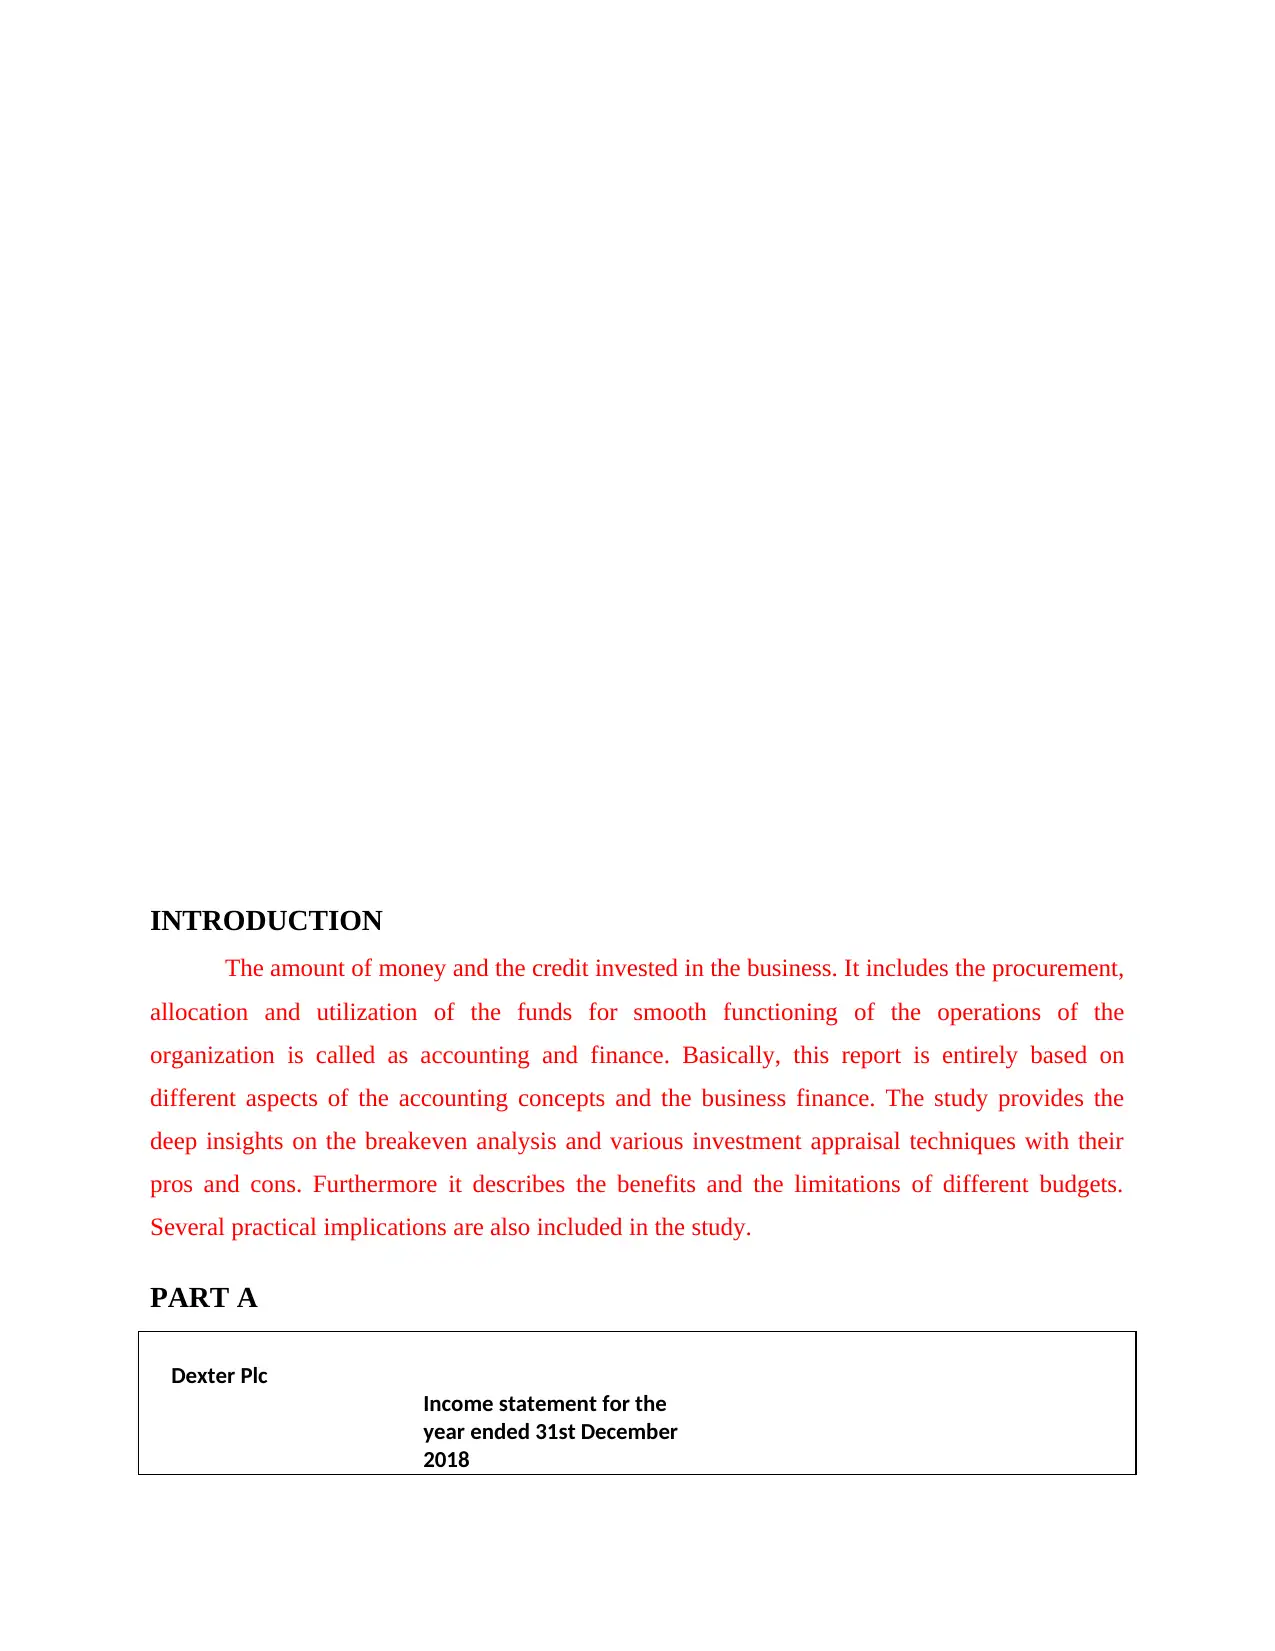
INTRODUCTION
The amount of money and the credit invested in the business. It includes the procurement,
allocation and utilization of the funds for smooth functioning of the operations of the
organization is called as accounting and finance. Basically, this report is entirely based on
different aspects of the accounting concepts and the business finance. The study provides the
deep insights on the breakeven analysis and various investment appraisal techniques with their
pros and cons. Furthermore it describes the benefits and the limitations of different budgets.
Several practical implications are also included in the study.
PART A
Dexter Plc
Income statement for the
year ended 31st December
2018
⊘ This is a preview!⊘
Do you want full access?
Subscribe today to unlock all pages.
Trusted by 1+ million students worldwide
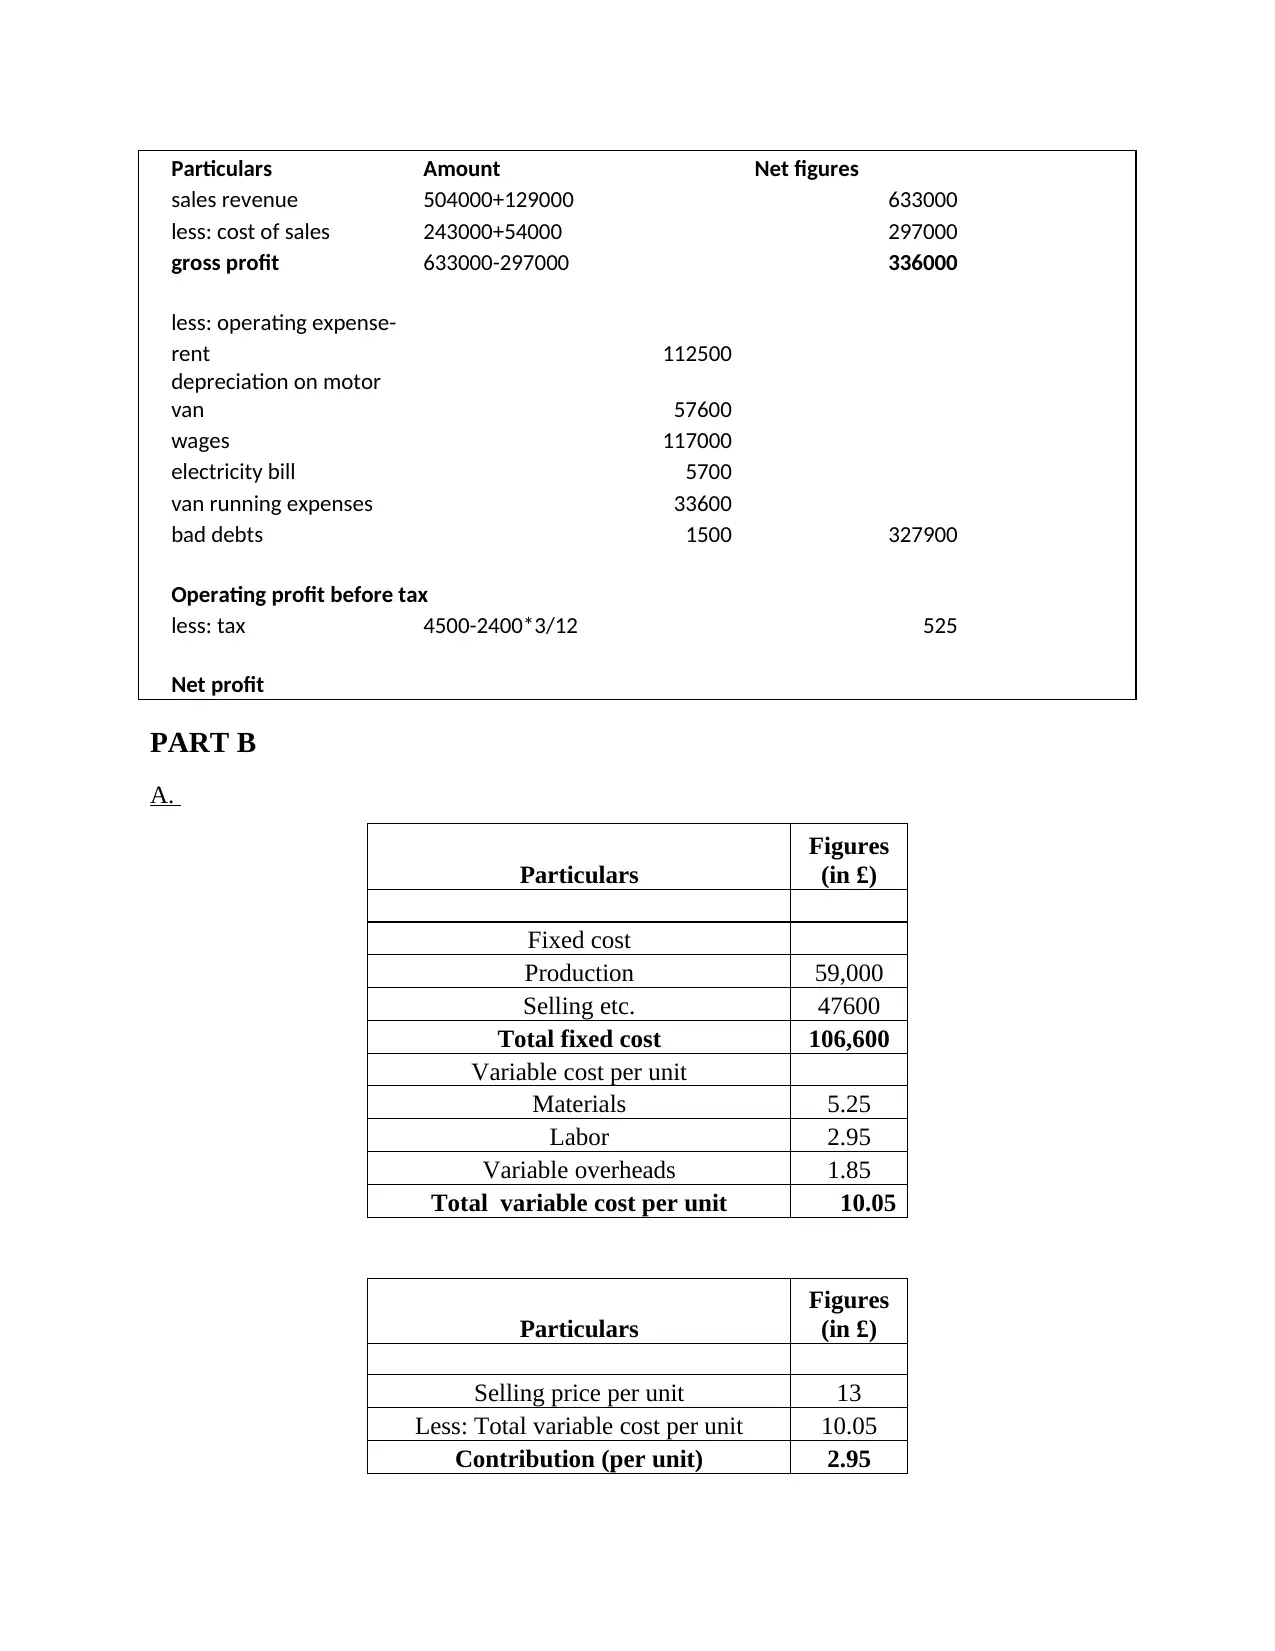
Particulars Amount Net figures
sales revenue 504000+129000 633000
less: cost of sales 243000+54000 297000
gross profit 633000-297000 336000
less: operating expense-
rent 112500
depreciation on motor
van 57600
wages 117000
electricity bill 5700
van running expenses 33600
bad debts 1500 327900
Operating profit before tax
less: tax 4500-2400*3/12 525
Net profit
PART B
A.
Particulars
Figures
(in £)
Fixed cost
Production 59,000
Selling etc. 47600
Total fixed cost 106,600
Variable cost per unit
Materials 5.25
Labor 2.95
Variable overheads 1.85
Total variable cost per unit 10.05
Particulars
Figures
(in £)
Selling price per unit 13
Less: Total variable cost per unit 10.05
Contribution (per unit) 2.95
Paraphrase This Document
Need a fresh take? Get an instant paraphrase of this document with our AI Paraphraser
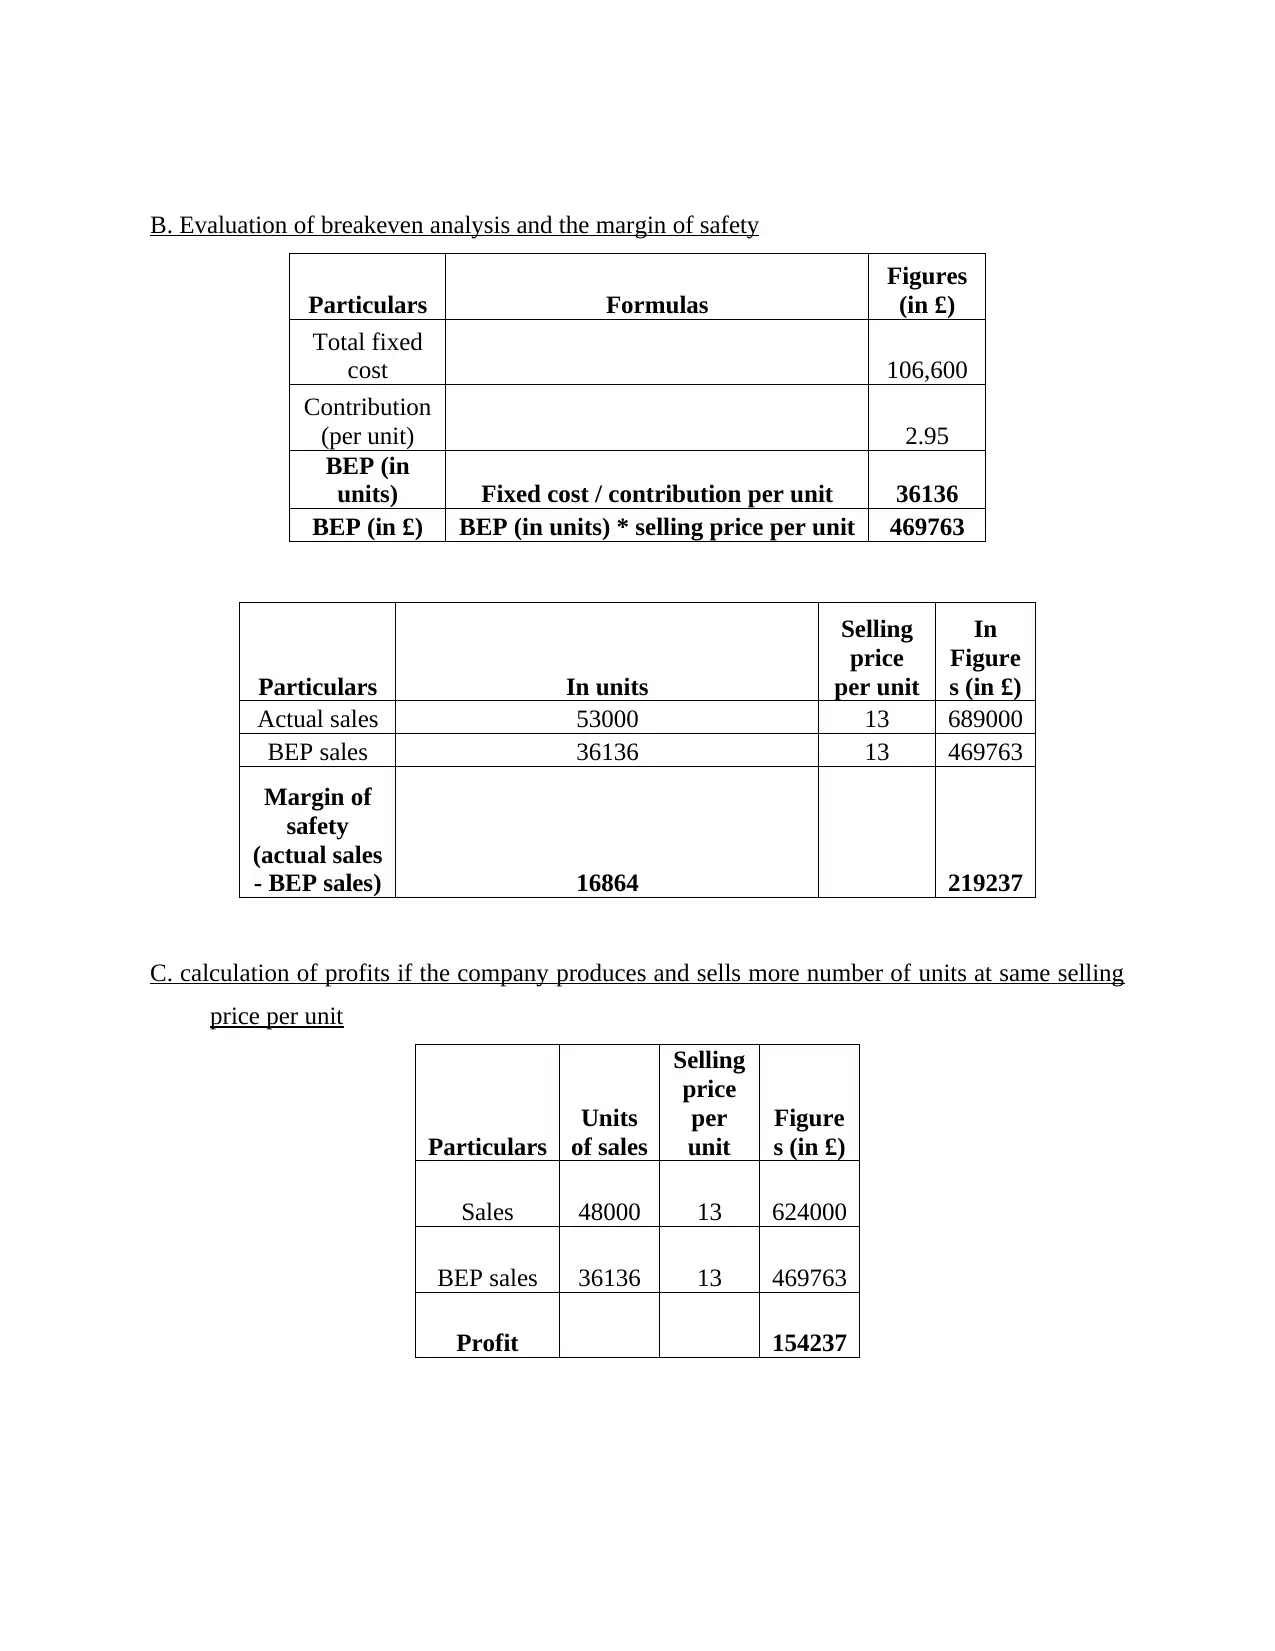
B. Evaluation of breakeven analysis and the margin of safety
Particulars Formulas
Figures
(in £)
Total fixed
cost 106,600
Contribution
(per unit) 2.95
BEP (in
units) Fixed cost / contribution per unit 36136
BEP (in £) BEP (in units) * selling price per unit 469763
Particulars In units
Selling
price
per unit
In
Figure
s (in £)
Actual sales 53000 13 689000
BEP sales 36136 13 469763
Margin of
safety
(actual sales
- BEP sales) 16864 219237
C. calculation of profits if the company produces and sells more number of units at same selling
price per unit
Particulars
Units
of sales
Selling
price
per
unit
Figure
s (in £)
Sales 48000 13 624000
BEP sales 36136 13 469763
Profit 154237
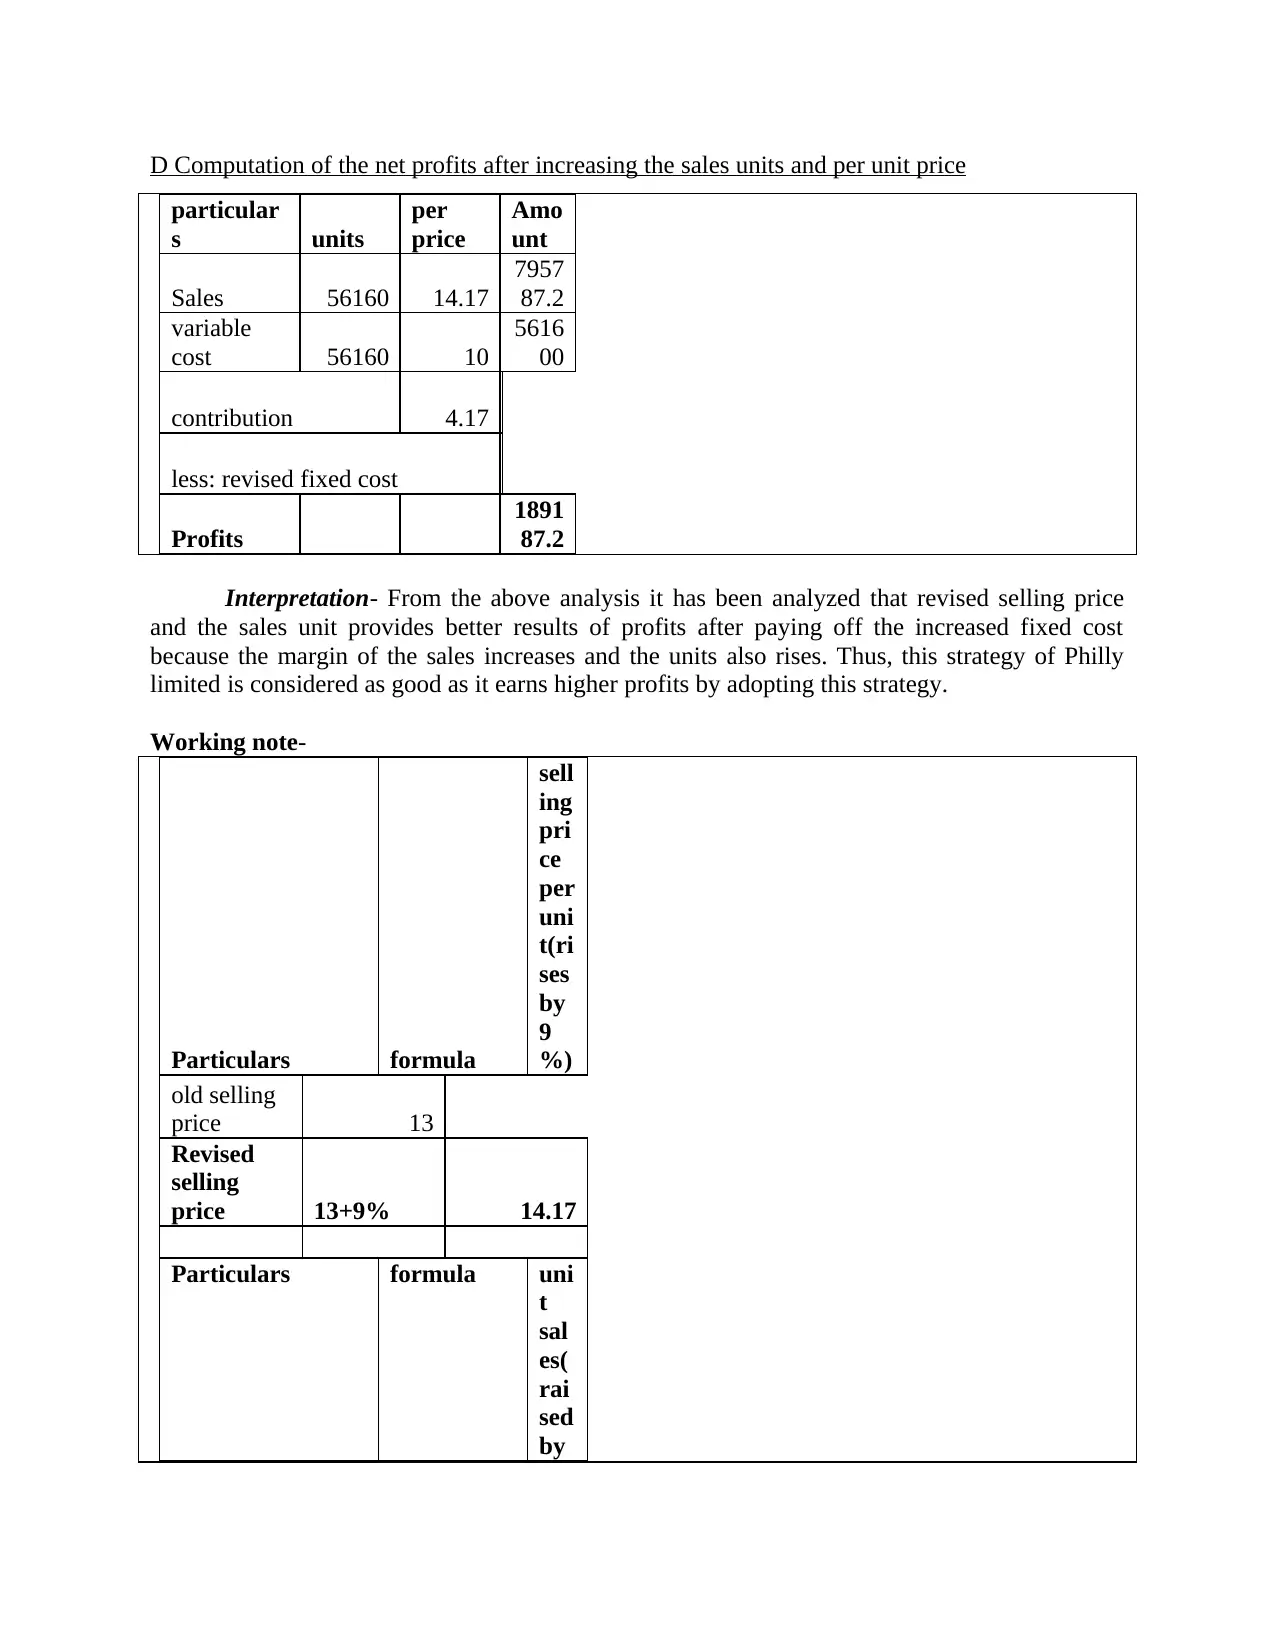
D Computation of the net profits after increasing the sales units and per unit price
particular
s units
per
price
Amo
unt
Sales 56160 14.17
7957
87.2
variable
cost 56160 10
5616
00
contribution 4.17
less: revised fixed cost
Profits
1891
87.2
Interpretation- From the above analysis it has been analyzed that revised selling price
and the sales unit provides better results of profits after paying off the increased fixed cost
because the margin of the sales increases and the units also rises. Thus, this strategy of Philly
limited is considered as good as it earns higher profits by adopting this strategy.
Working note-
Particulars formula
sell
ing
pri
ce
per
uni
t(ri
ses
by
9
%)
old selling
price 13
Revised
selling
price 13+9% 14.17
Particulars formula uni
t
sal
es(
rai
sed
by
⊘ This is a preview!⊘
Do you want full access?
Subscribe today to unlock all pages.
Trusted by 1+ million students worldwide
17
%)
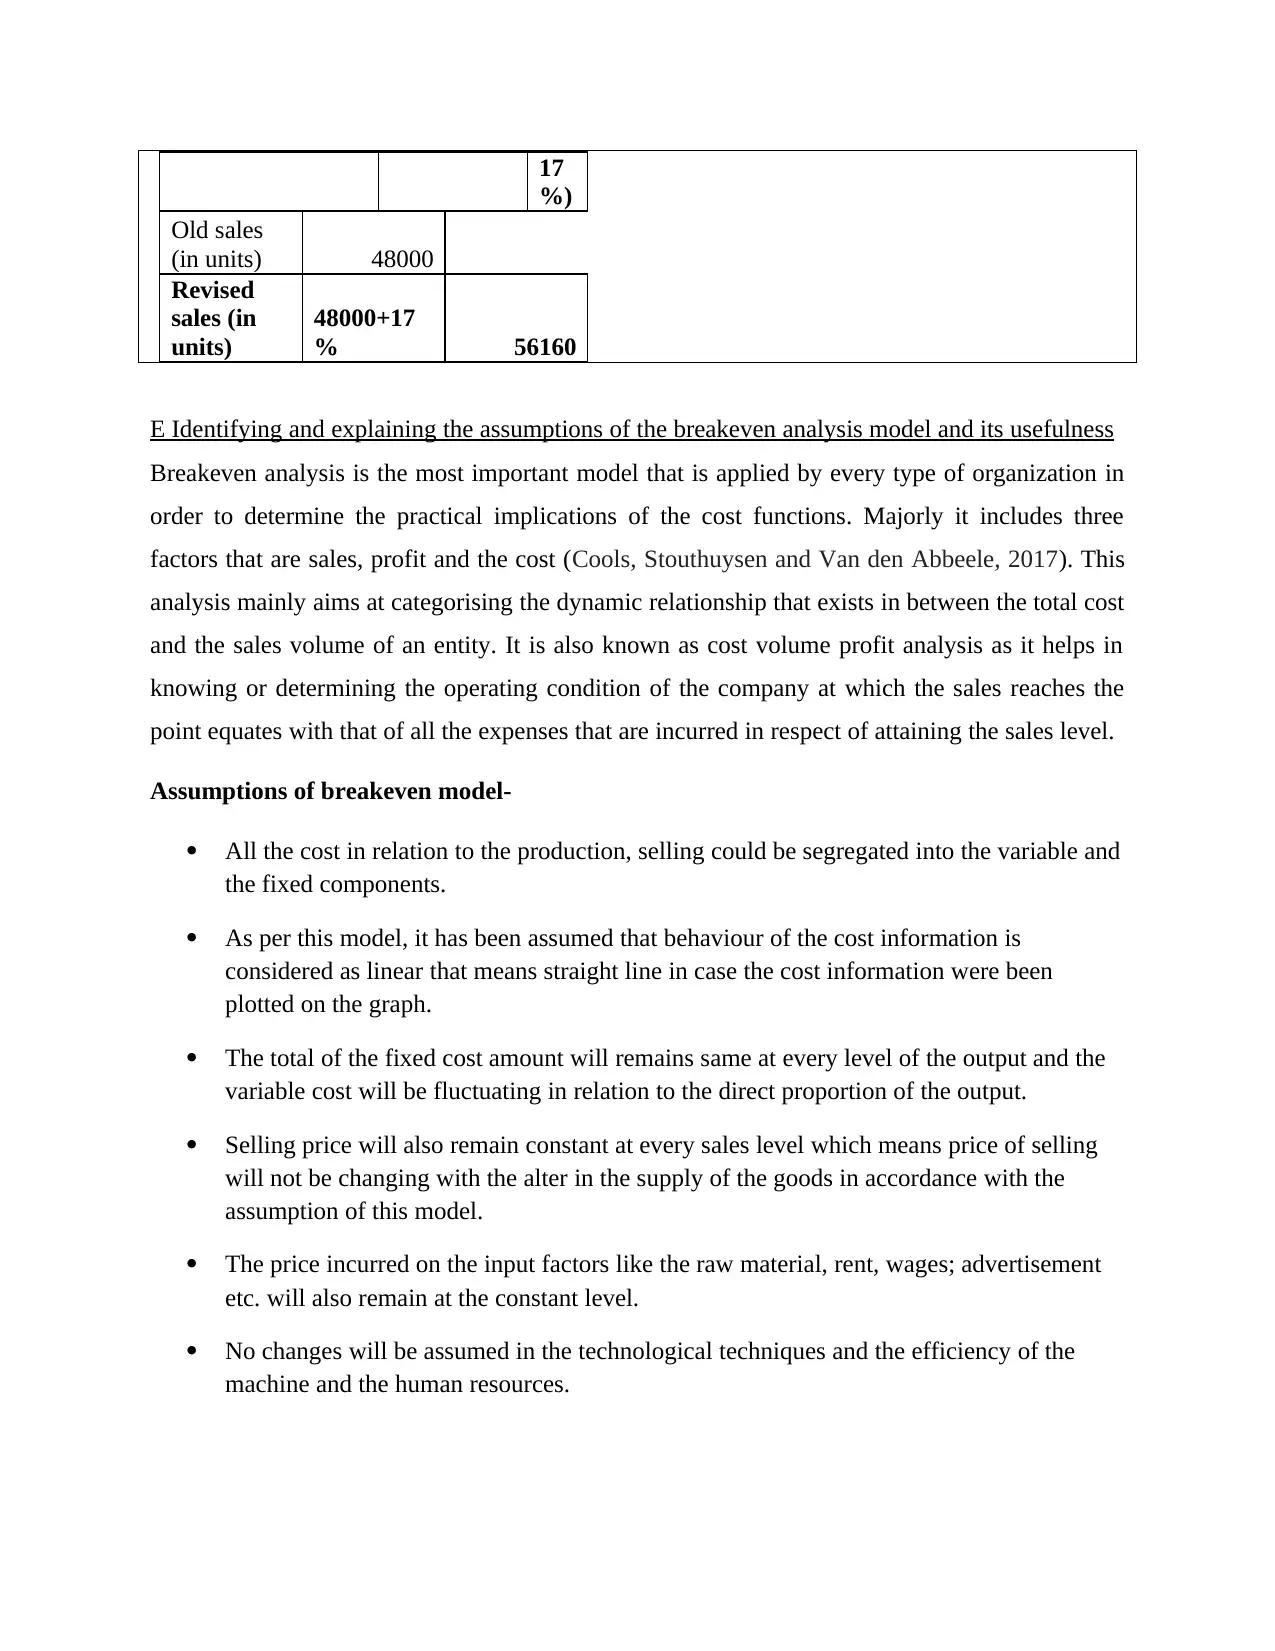
Old sales
(in units) 48000
Revised
sales (in
units)
48000+17
% 56160
E Identifying and explaining the assumptions of the breakeven analysis model and its usefulness
Breakeven analysis is the most important model that is applied by every type of organization in
order to determine the practical implications of the cost functions. Majorly it includes three
factors that are sales, profit and the cost (Cools, Stouthuysen and Van den Abbeele, 2017). This
analysis mainly aims at categorising the dynamic relationship that exists in between the total cost
and the sales volume of an entity. It is also known as cost volume profit analysis as it helps in
knowing or determining the operating condition of the company at which the sales reaches the
point equates with that of all the expenses that are incurred in respect of attaining the sales level.
Assumptions of breakeven model-
All the cost in relation to the production, selling could be segregated into the variable and
the fixed components.
As per this model, it has been assumed that behaviour of the cost information is
considered as linear that means straight line in case the cost information were been
plotted on the graph.
The total of the fixed cost amount will remains same at every level of the output and the
variable cost will be fluctuating in relation to the direct proportion of the output.
Selling price will also remain constant at every sales level which means price of selling
will not be changing with the alter in the supply of the goods in accordance with the
assumption of this model.
The price incurred on the input factors like the raw material, rent, wages; advertisement
etc. will also remain at the constant level.
No changes will be assumed in the technological techniques and the efficiency of the
machine and the human resources.
%)
Old sales
(in units) 48000
Revised
sales (in
units)
48000+17
% 56160
E Identifying and explaining the assumptions of the breakeven analysis model and its usefulness
Breakeven analysis is the most important model that is applied by every type of organization in
order to determine the practical implications of the cost functions. Majorly it includes three
factors that are sales, profit and the cost (Cools, Stouthuysen and Van den Abbeele, 2017). This
analysis mainly aims at categorising the dynamic relationship that exists in between the total cost
and the sales volume of an entity. It is also known as cost volume profit analysis as it helps in
knowing or determining the operating condition of the company at which the sales reaches the
point equates with that of all the expenses that are incurred in respect of attaining the sales level.
Assumptions of breakeven model-
All the cost in relation to the production, selling could be segregated into the variable and
the fixed components.
As per this model, it has been assumed that behaviour of the cost information is
considered as linear that means straight line in case the cost information were been
plotted on the graph.
The total of the fixed cost amount will remains same at every level of the output and the
variable cost will be fluctuating in relation to the direct proportion of the output.
Selling price will also remain constant at every sales level which means price of selling
will not be changing with the alter in the supply of the goods in accordance with the
assumption of this model.
The price incurred on the input factors like the raw material, rent, wages; advertisement
etc. will also remain at the constant level.
No changes will be assumed in the technological techniques and the efficiency of the
machine and the human resources.
Paraphrase This Document
Need a fresh take? Get an instant paraphrase of this document with our AI Paraphraser
The model assumes that comparison between the cost and the revenue on the basis of the
common activity (de Campos and Rodrigues, 2016). For instance- sales value of products
and units produced.
Sales volume and the output is been assumed as the relevant factor that affects the cost.
Usefulness of this model in varying business-
It is most useful tool for those businesses has been witnessed with several business decisions and
in dealing with the uncertainty. It enables the manufacturing organization in determining its sales
volume and also in forecasting the profits by anticipating the revenues and the cost (Hazır,
2015). This model assists the enterprise in appraising the changing effects on the sales volume
and the production cost. It helps in making the intra firm comparisons in terms of their
profitability.
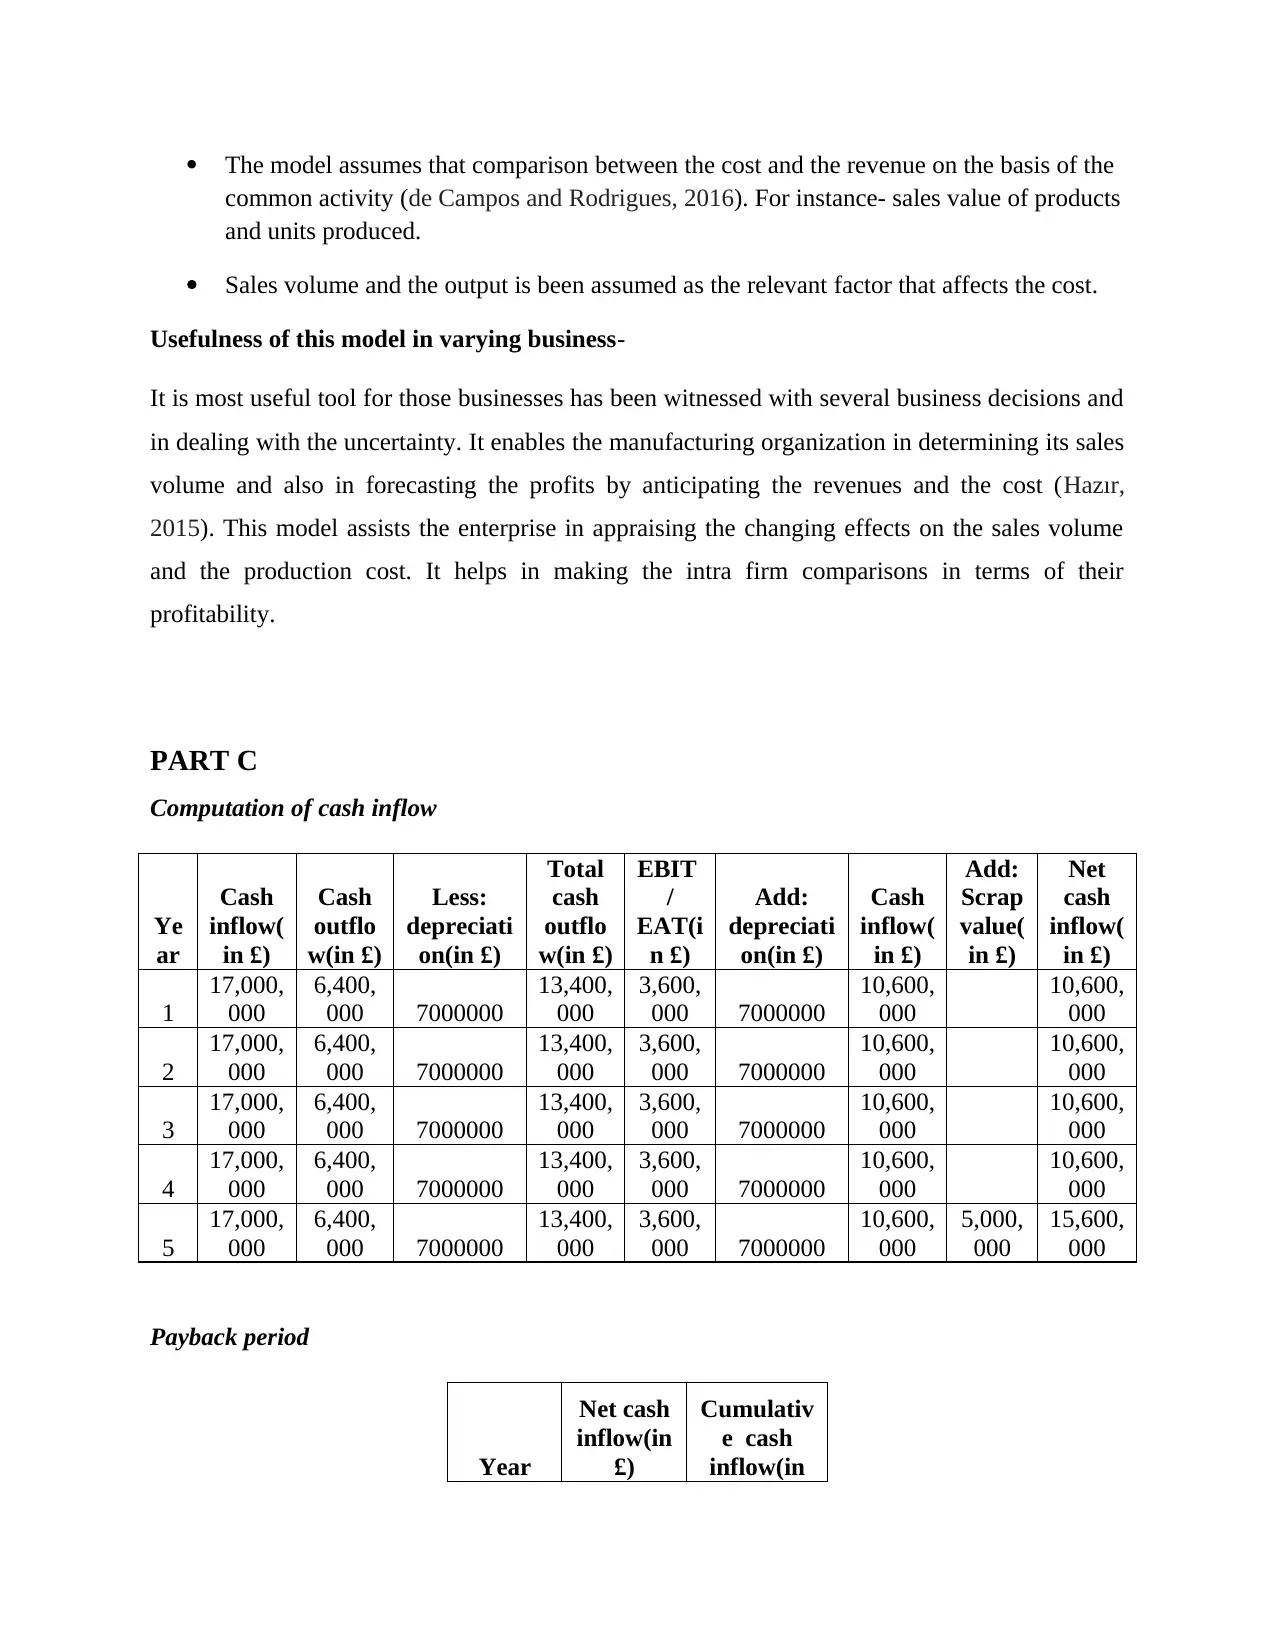
PART C
Computation of cash inflow
Ye
ar
Cash
inflow(
in £)
Cash
outflo
w(in £)
Less:
depreciati
on(in £)
Total
cash
outflo
w(in £)
EBIT
/
EAT(i
n £)
Add:
depreciati
on(in £)
Cash
inflow(
in £)
Add:
Scrap
value(
in £)
Net
cash
inflow(
in £)
1
17,000,
000
6,400,
000 7000000
13,400,
000
3,600,
000 7000000
10,600,
000
10,600,
000
2
17,000,
000
6,400,
000 7000000
13,400,
000
3,600,
000 7000000
10,600,
000
10,600,
000
3
17,000,
000
6,400,
000 7000000
13,400,
000
3,600,
000 7000000
10,600,
000
10,600,
000
4
17,000,
000
6,400,
000 7000000
13,400,
000
3,600,
000 7000000
10,600,
000
10,600,
000
5
17,000,
000
6,400,
000 7000000
13,400,
000
3,600,
000 7000000
10,600,
000
5,000,
000
15,600,
000
Payback period
Year
Net cash
inflow(in
£)
Cumulativ
e cash
inflow(in
common activity (de Campos and Rodrigues, 2016). For instance- sales value of products
and units produced.
Sales volume and the output is been assumed as the relevant factor that affects the cost.
Usefulness of this model in varying business-
It is most useful tool for those businesses has been witnessed with several business decisions and
in dealing with the uncertainty. It enables the manufacturing organization in determining its sales
volume and also in forecasting the profits by anticipating the revenues and the cost (Hazır,
2015). This model assists the enterprise in appraising the changing effects on the sales volume
and the production cost. It helps in making the intra firm comparisons in terms of their
profitability.
PART C
Computation of cash inflow
Ye
ar
Cash
inflow(
in £)
Cash
outflo
w(in £)
Less:
depreciati
on(in £)
Total
cash
outflo
w(in £)
EBIT
/
EAT(i
n £)
Add:
depreciati
on(in £)
Cash
inflow(
in £)
Add:
Scrap
value(
in £)
Net
cash
inflow(
in £)
1
17,000,
000
6,400,
000 7000000
13,400,
000
3,600,
000 7000000
10,600,
000
10,600,
000
2
17,000,
000
6,400,
000 7000000
13,400,
000
3,600,
000 7000000
10,600,
000
10,600,
000
3
17,000,
000
6,400,
000 7000000
13,400,
000
3,600,
000 7000000
10,600,
000
10,600,
000
4
17,000,
000
6,400,
000 7000000
13,400,
000
3,600,
000 7000000
10,600,
000
10,600,
000
5
17,000,
000
6,400,
000 7000000
13,400,
000
3,600,
000 7000000
10,600,
000
5,000,
000
15,600,
000
Payback period
Year
Net cash
inflow(in
£)
Cumulativ
e cash
inflow(in
£)
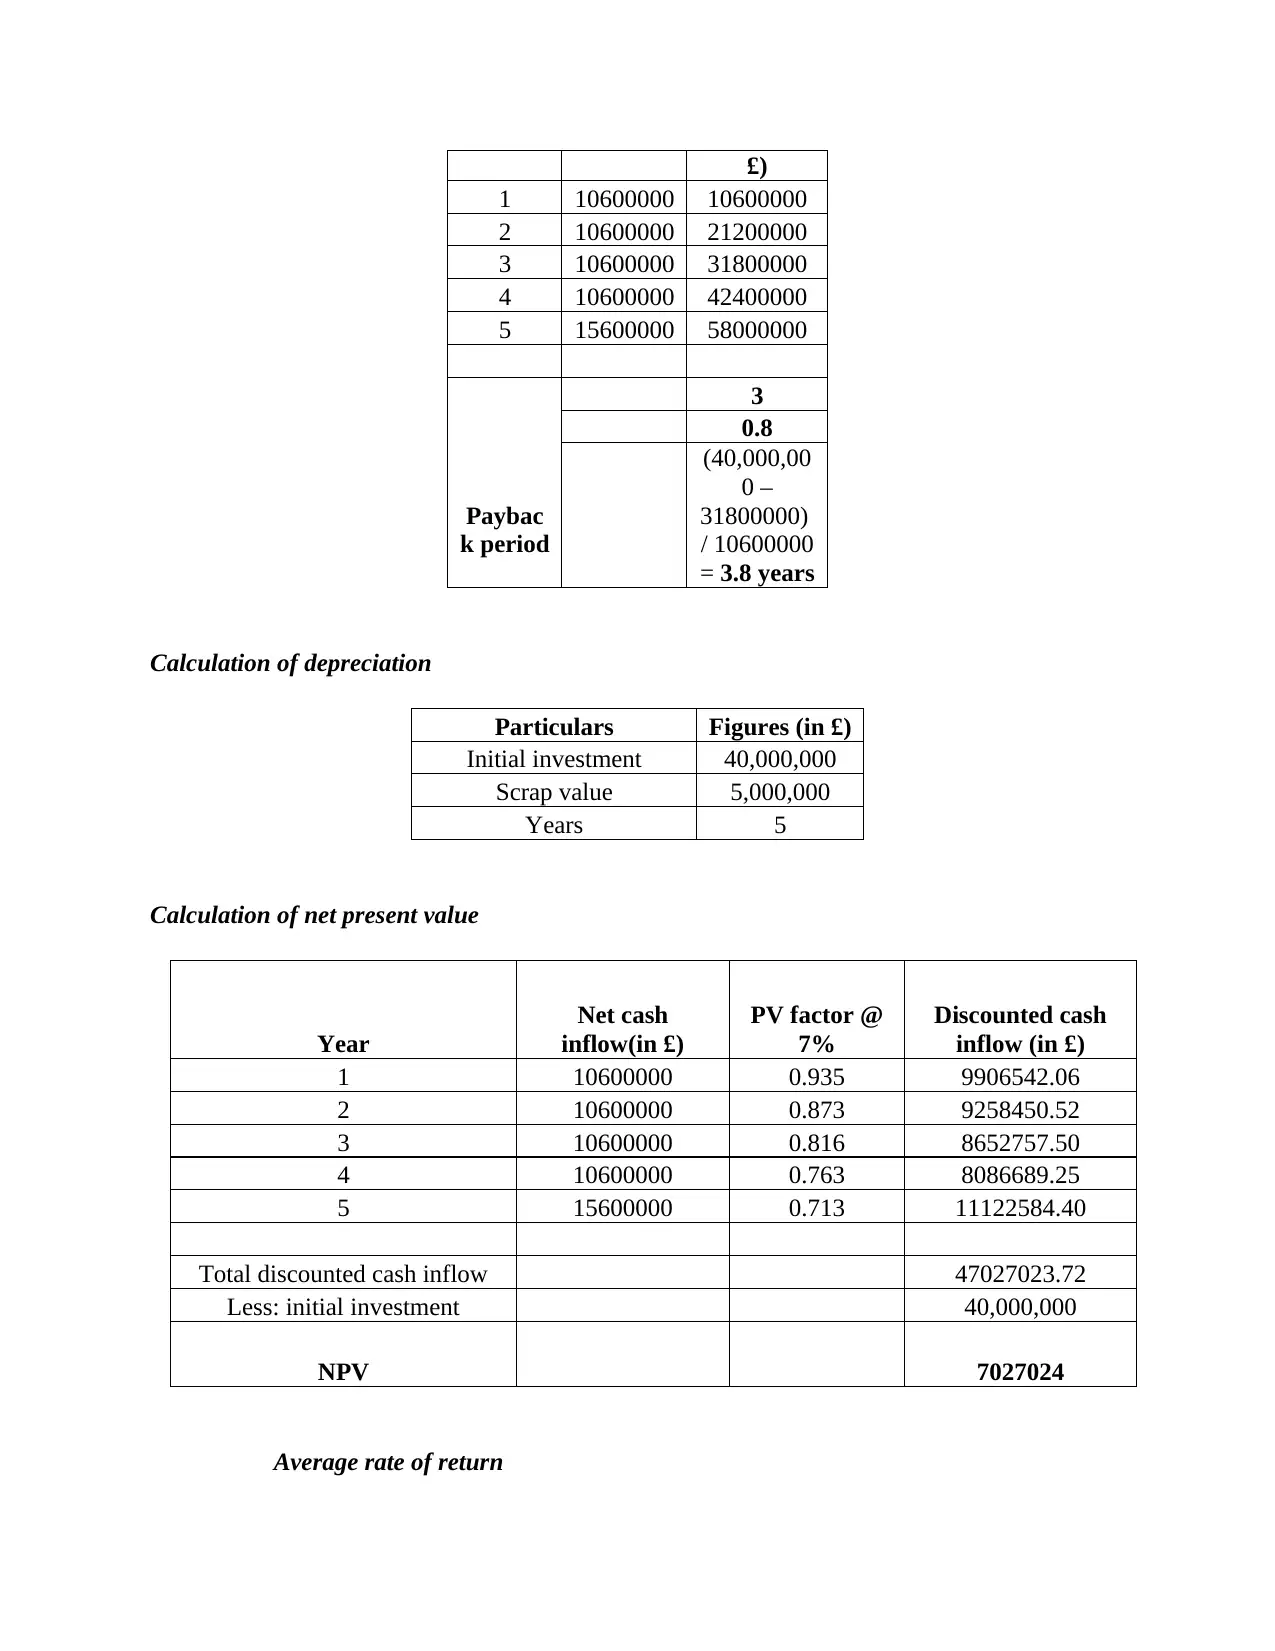
1 10600000 10600000
2 10600000 21200000
3 10600000 31800000
4 10600000 42400000
5 15600000 58000000
Paybac
k period
3
0.8
(40,000,00
0 –
31800000)
/ 10600000
= 3.8 years
Calculation of depreciation
Particulars Figures (in £)
Initial investment 40,000,000
Scrap value 5,000,000
Years 5
Calculation of net present value
Year
Net cash
inflow(in £)
PV factor @
7%
Discounted cash
inflow (in £)
1 10600000 0.935 9906542.06
2 10600000 0.873 9258450.52
3 10600000 0.816 8652757.50
4 10600000 0.763 8086689.25
5 15600000 0.713 11122584.40
Total discounted cash inflow 47027023.72
Less: initial investment 40,000,000
NPV 7027024
Average rate of return
⊘ This is a preview!⊘
Do you want full access?
Subscribe today to unlock all pages.
Trusted by 1+ million students worldwide
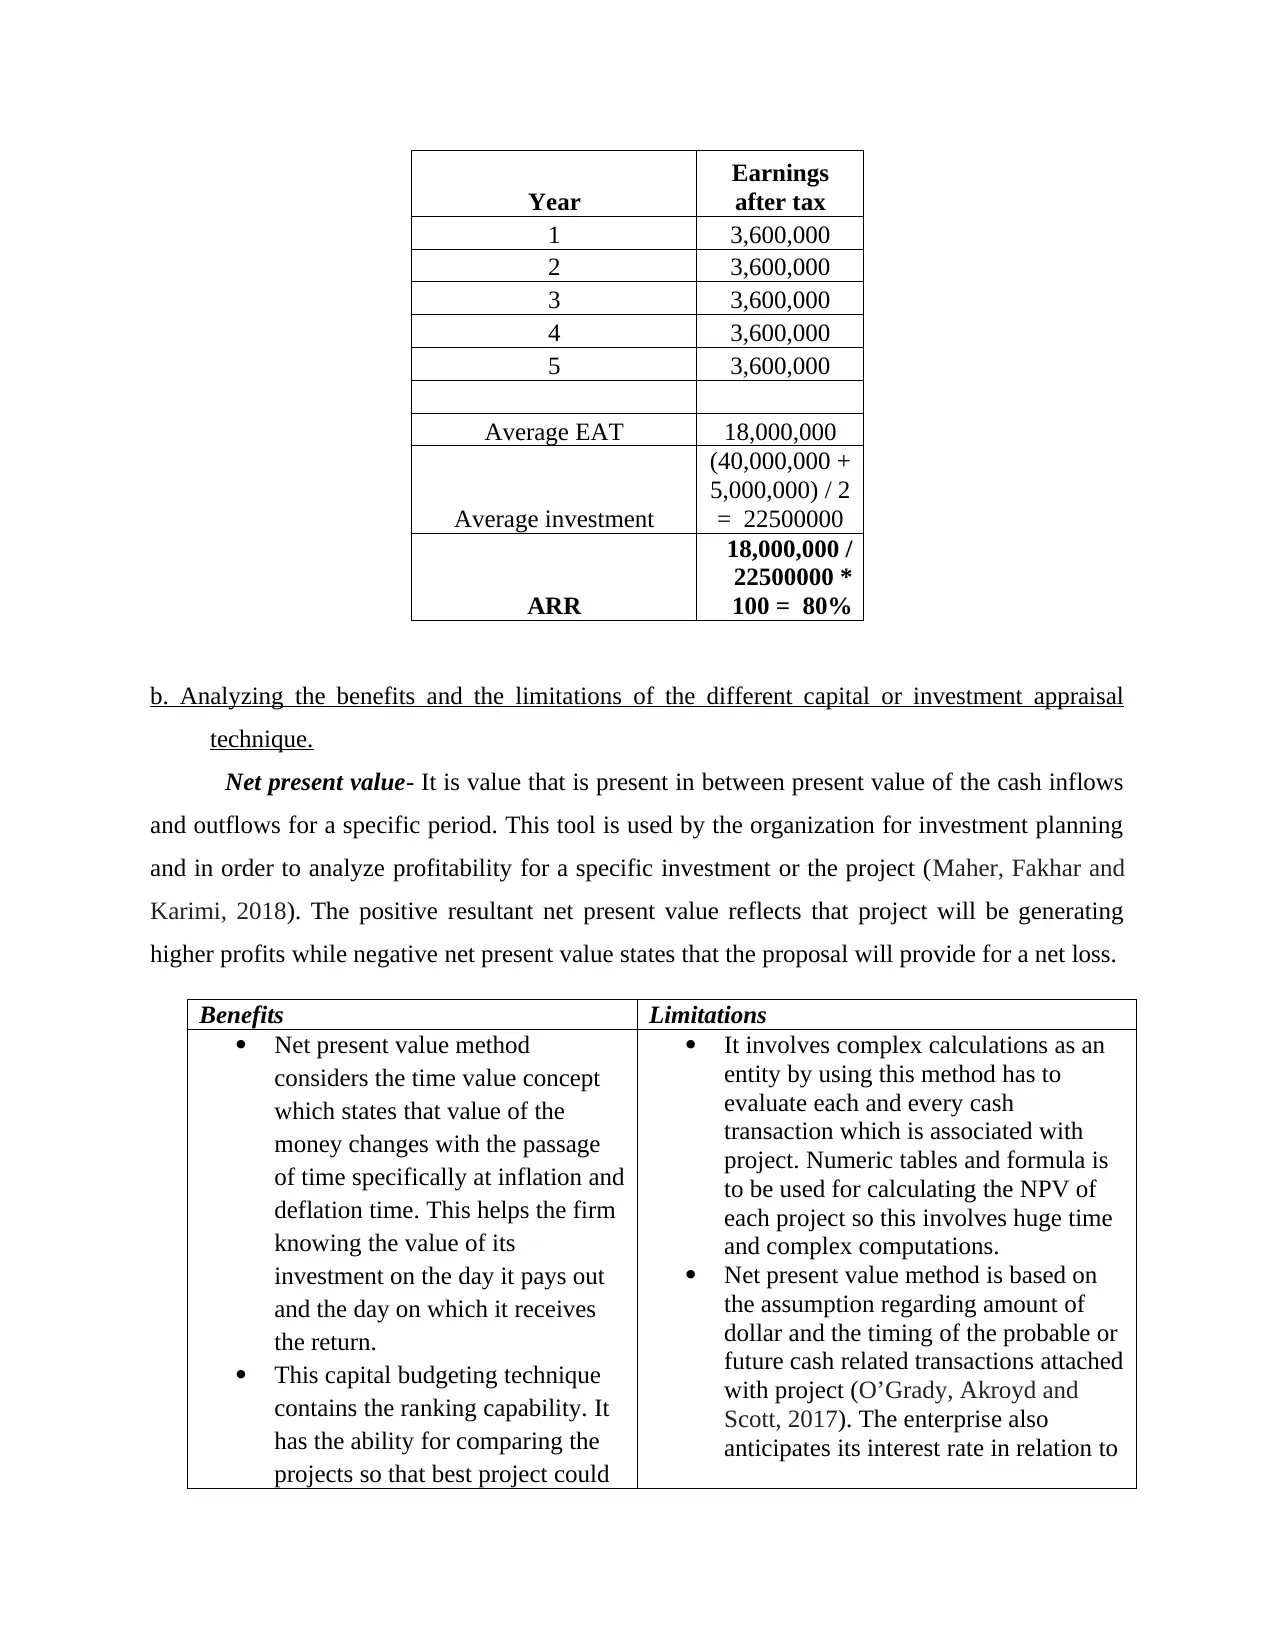
Year
Earnings
after tax
1 3,600,000
2 3,600,000
3 3,600,000
4 3,600,000
5 3,600,000
Average EAT 18,000,000
Average investment
(40,000,000 +
5,000,000) / 2
= 22500000
ARR
18,000,000 /
22500000 *
100 = 80%
b. Analyzing the benefits and the limitations of the different capital or investment appraisal
technique.
Net present value- It is value that is present in between present value of the cash inflows
and outflows for a specific period. This tool is used by the organization for investment planning
and in order to analyze profitability for a specific investment or the project (Maher, Fakhar and
Karimi, 2018). The positive resultant net present value reflects that project will be generating
higher profits while negative net present value states that the proposal will provide for a net loss.
Benefits Limitations
Net present value method
considers the time value concept
which states that value of the
money changes with the passage
of time specifically at inflation and
deflation time. This helps the firm
knowing the value of its
investment on the day it pays out
and the day on which it receives
the return.
This capital budgeting technique
contains the ranking capability. It
has the ability for comparing the
projects so that best project could
It involves complex calculations as an
entity by using this method has to
evaluate each and every cash
transaction which is associated with
project. Numeric tables and formula is
to be used for calculating the NPV of
each project so this involves huge time
and complex computations.
Net present value method is based on
the assumption regarding amount of
dollar and the timing of the probable or
future cash related transactions attached
with project (O’Grady, Akroyd and
Scott, 2017). The enterprise also
anticipates its interest rate in relation to
Paraphrase This Document
Need a fresh take? Get an instant paraphrase of this document with our AI Paraphraser
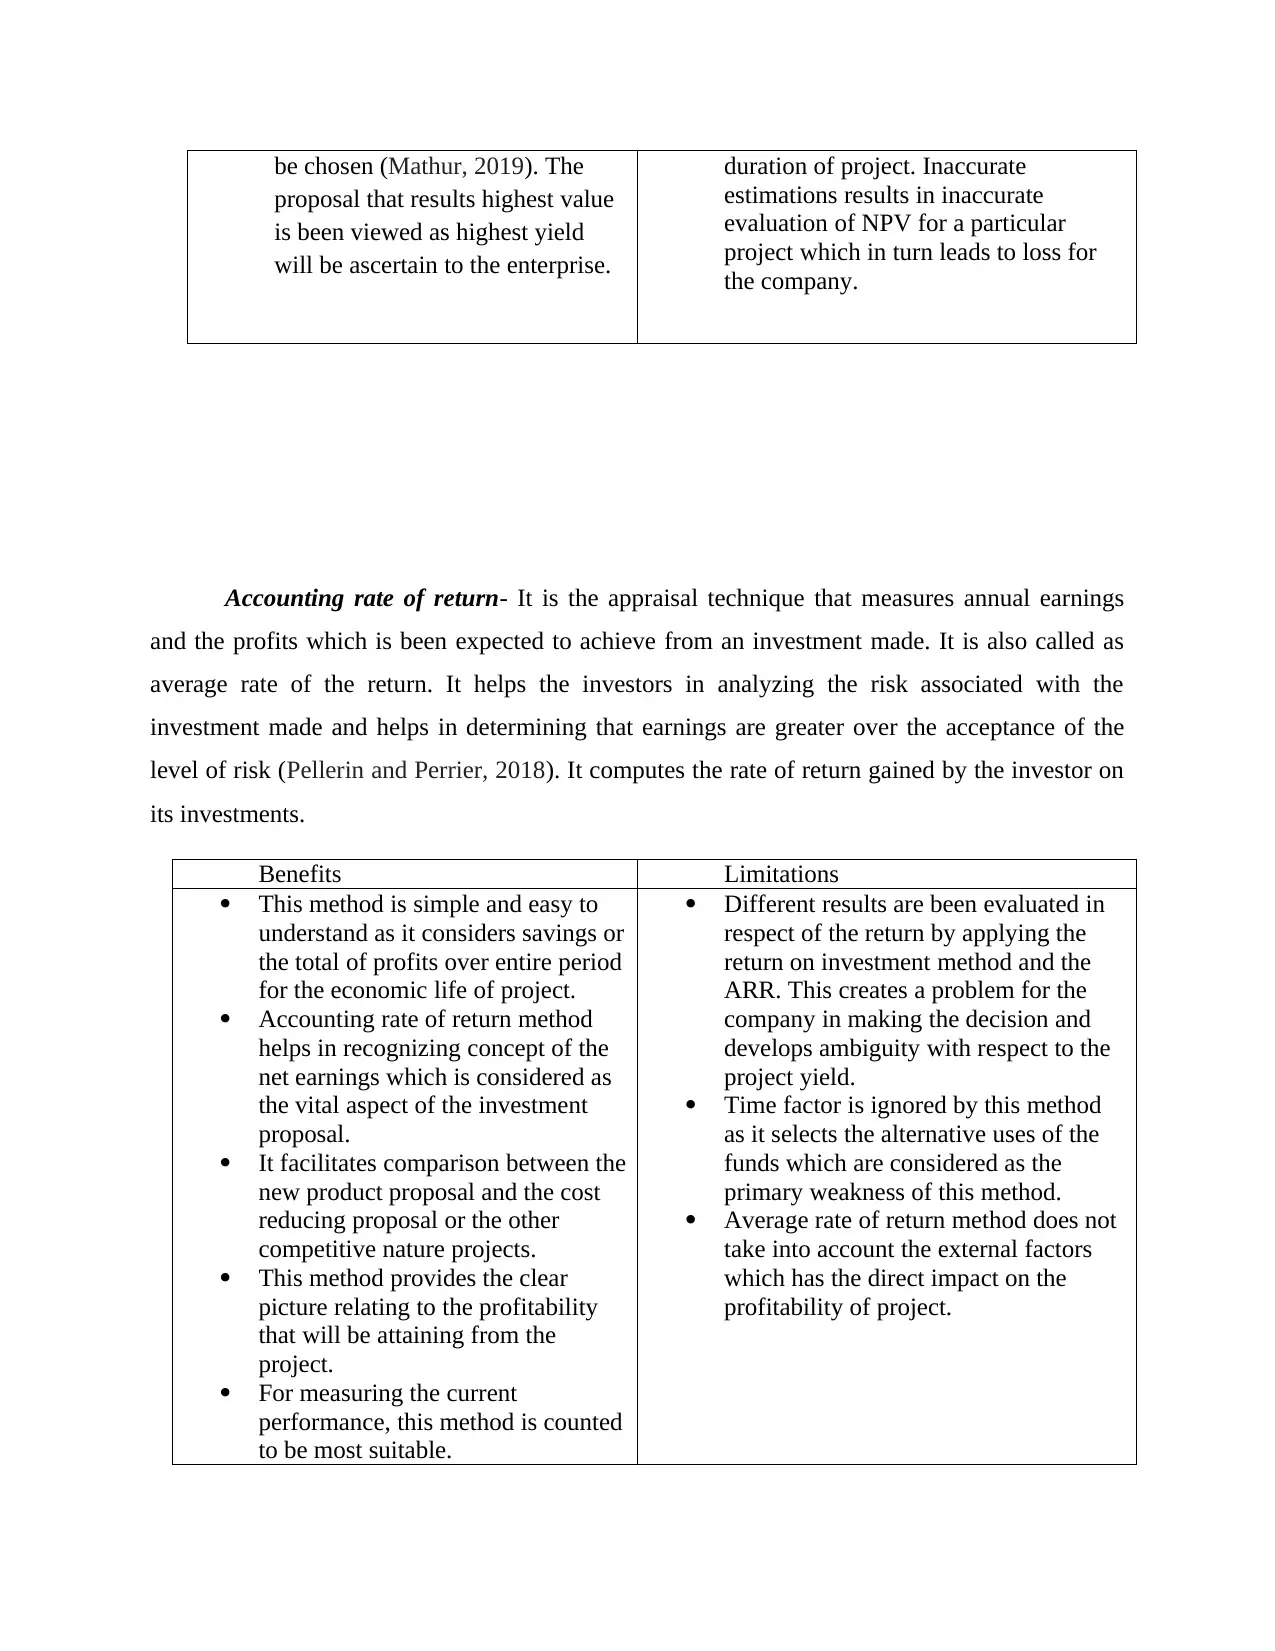
be chosen (Mathur, 2019). The
proposal that results highest value
is been viewed as highest yield
will be ascertain to the enterprise.
duration of project. Inaccurate
estimations results in inaccurate
evaluation of NPV for a particular
project which in turn leads to loss for
the company.
Accounting rate of return- It is the appraisal technique that measures annual earnings
and the profits which is been expected to achieve from an investment made. It is also called as
average rate of the return. It helps the investors in analyzing the risk associated with the
investment made and helps in determining that earnings are greater over the acceptance of the
level of risk (Pellerin and Perrier, 2018). It computes the rate of return gained by the investor on
its investments.
Benefits Limitations
This method is simple and easy to
understand as it considers savings or
the total of profits over entire period
for the economic life of project.
Accounting rate of return method
helps in recognizing concept of the
net earnings which is considered as
the vital aspect of the investment
proposal.
It facilitates comparison between the
new product proposal and the cost
reducing proposal or the other
competitive nature projects.
This method provides the clear
picture relating to the profitability
that will be attaining from the
project.
For measuring the current
performance, this method is counted
to be most suitable.
Different results are been evaluated in
respect of the return by applying the
return on investment method and the
ARR. This creates a problem for the
company in making the decision and
develops ambiguity with respect to the
project yield.
Time factor is ignored by this method
as it selects the alternative uses of the
funds which are considered as the
primary weakness of this method.
Average rate of return method does not
take into account the external factors
which has the direct impact on the
profitability of project.
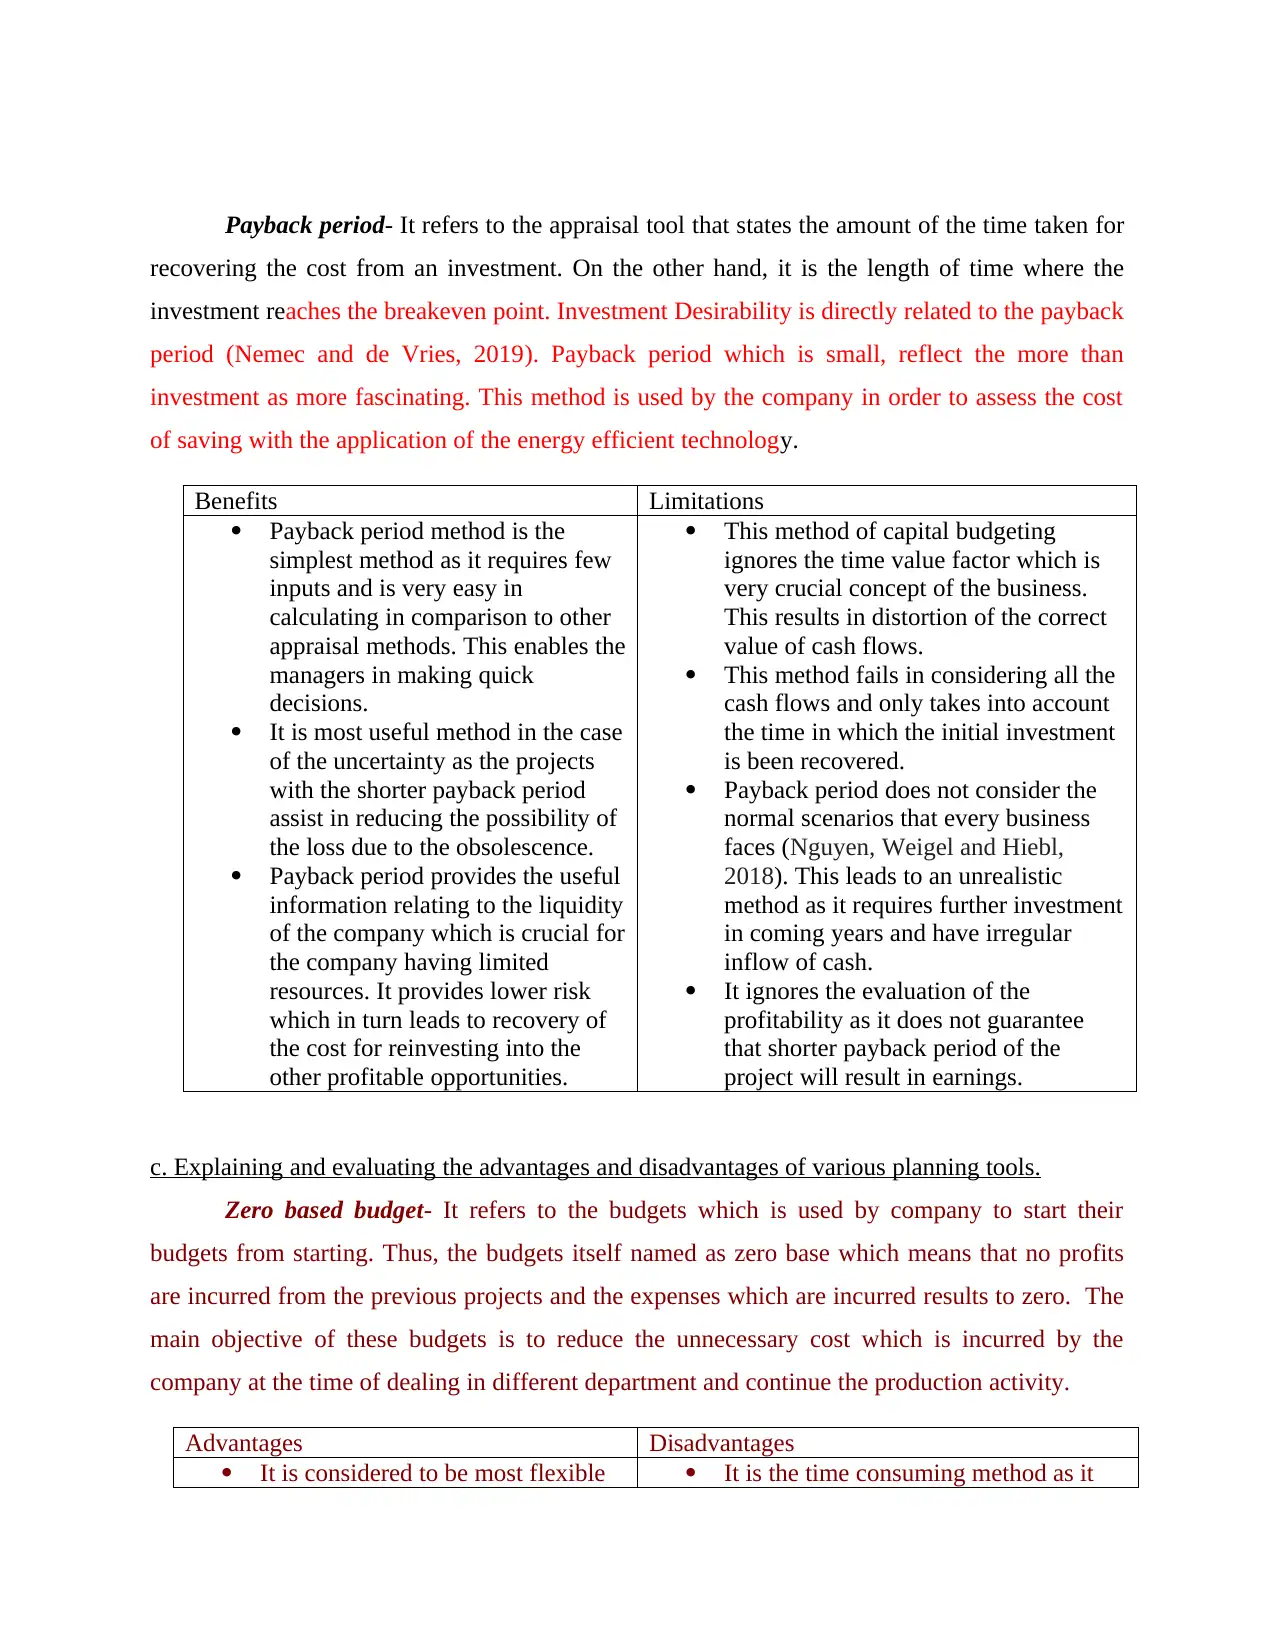
Payback period- It refers to the appraisal tool that states the amount of the time taken for
recovering the cost from an investment. On the other hand, it is the length of time where the
investment reaches the breakeven point. Investment Desirability is directly related to the payback
period (Nemec and de Vries, 2019). Payback period which is small, reflect the more than
investment as more fascinating. This method is used by the company in order to assess the cost
of saving with the application of the energy efficient technology.
Benefits Limitations
Payback period method is the
simplest method as it requires few
inputs and is very easy in
calculating in comparison to other
appraisal methods. This enables the
managers in making quick
decisions.
It is most useful method in the case
of the uncertainty as the projects
with the shorter payback period
assist in reducing the possibility of
the loss due to the obsolescence.
Payback period provides the useful
information relating to the liquidity
of the company which is crucial for
the company having limited
resources. It provides lower risk
which in turn leads to recovery of
the cost for reinvesting into the
other profitable opportunities.
This method of capital budgeting
ignores the time value factor which is
very crucial concept of the business.
This results in distortion of the correct
value of cash flows.
This method fails in considering all the
cash flows and only takes into account
the time in which the initial investment
is been recovered.
Payback period does not consider the
normal scenarios that every business
faces (Nguyen, Weigel and Hiebl,
2018). This leads to an unrealistic
method as it requires further investment
in coming years and have irregular
inflow of cash.
It ignores the evaluation of the
profitability as it does not guarantee
that shorter payback period of the
project will result in earnings.
c. Explaining and evaluating the advantages and disadvantages of various planning tools.
Zero based budget- It refers to the budgets which is used by company to start their
budgets from starting. Thus, the budgets itself named as zero base which means that no profits
are incurred from the previous projects and the expenses which are incurred results to zero. The
main objective of these budgets is to reduce the unnecessary cost which is incurred by the
company at the time of dealing in different department and continue the production activity.
Advantages Disadvantages
It is considered to be most flexible It is the time consuming method as it
⊘ This is a preview!⊘
Do you want full access?
Subscribe today to unlock all pages.
Trusted by 1+ million students worldwide
1 out of 18
Related Documents


Your All-in-One AI-Powered Toolkit for Academic Success.
+13062052269
info@desklib.com
Available 24*7 on WhatsApp / Email
![[object Object]](/_next/static/media/star-bottom.7253800d.svg)
Unlock your academic potential
Copyright © 2020–2026 A2Z Services. All Rights Reserved. Developed and managed by ZUCOL.