Financial Analysis: Investor Report on Wesfarmers Limited (MBA403)
VerifiedAdded on 2023/01/20
|3
|1336
|1
Report
AI Summary
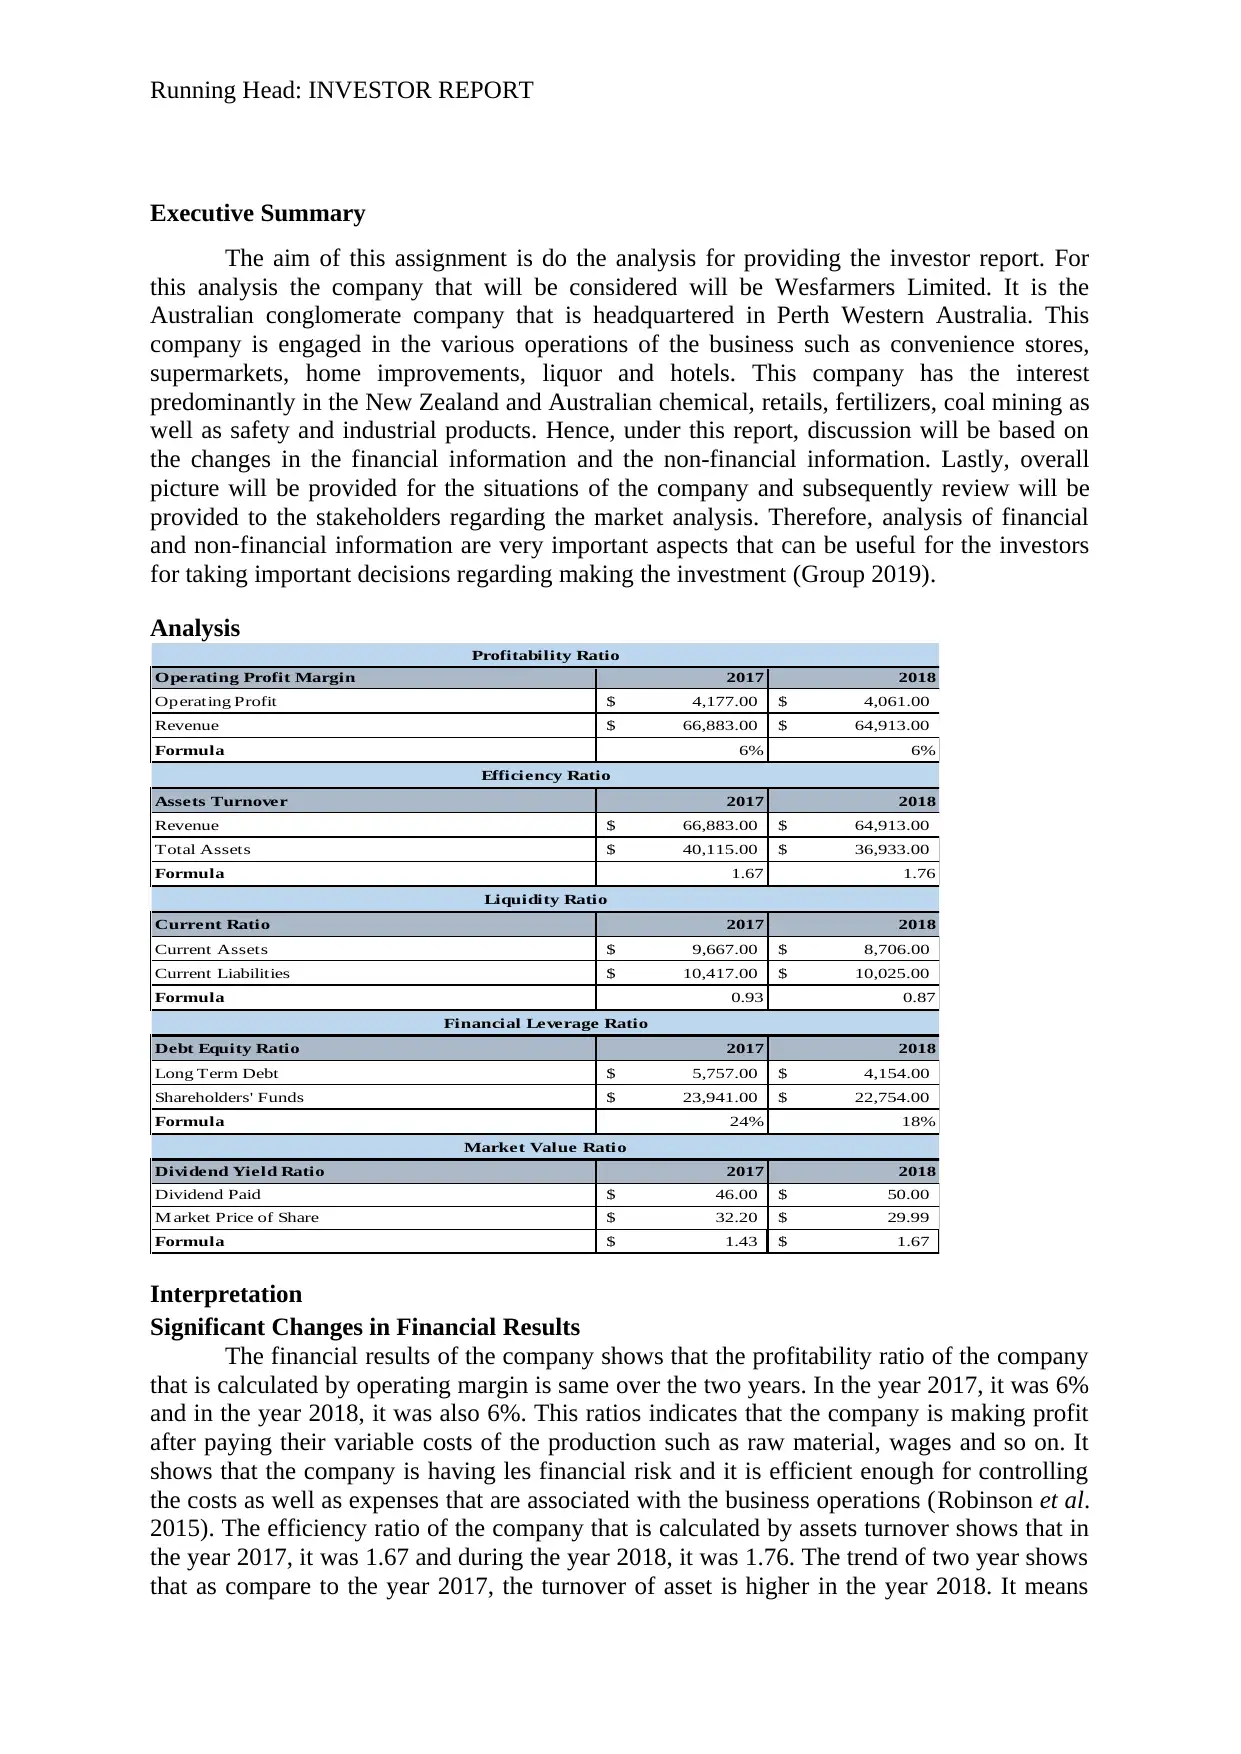
This investor report analyzes Wesfarmers Limited, an Australian conglomerate, focusing on its financial and non-financial performance. The report examines key financial ratios, including profitability, efficiency, liquidity, leverage, and market value, comparing data from 2017 and 2018. It also explores Wesfarmers' diverse business operations, including its holdings in Coles, Flybuys, and other ventures, and discusses the retail sector's performance in Australia. The analysis concludes with an assessment of the company's financial position, highlighting areas of strength and weakness, and provides recommendations for potential investors, suggesting a continued investment strategy while also advising on improvements to enhance liquidity and reduce expenses. References are included for the analysis.

Running Head: INVESTOR REPORT
Executive Summary
The aim of this assignment is do the analysis for providing the investor report. For
this analysis the company that will be considered will be Wesfarmers Limited. It is the
Australian conglomerate company that is headquartered in Perth Western Australia. This
company is engaged in the various operations of the business such as convenience stores,
supermarkets, home improvements, liquor and hotels. This company has the interest
predominantly in the New Zealand and Australian chemical, retails, fertilizers, coal mining as
well as safety and industrial products. Hence, under this report, discussion will be based on
the changes in the financial information and the non-financial information. Lastly, overall
picture will be provided for the situations of the company and subsequently review will be
provided to the stakeholders regarding the market analysis. Therefore, analysis of financial
and non-financial information are very important aspects that can be useful for the investors
for taking important decisions regarding making the investment (Group 2019).
Analysis
Operating Profit Margin 2017 2018
Operating Profit 4,177.00$ 4,061.00$
Revenue 66,883.00$ 64,913.00$
Formula 6% 6%
Assets Turnover 2017 2018
Revenue 66,883.00$ 64,913.00$
Total Assets 40,115.00$ 36,933.00$
Formula 1.67 1.76
Current Ratio 2017 2018
Current Assets 9,667.00$ 8,706.00$
Current Liabilities 10,417.00$ 10,025.00$
Formula 0.93 0.87
Debt Equity Ratio 2017 2018
Long Term Debt 5,757.00$ 4,154.00$
Shareholders' Funds 23,941.00$ 22,754.00$
Formula 24% 18%
Dividend Yield Ratio 2017 2018
Dividend Paid 46.00$ 50.00$
M arket Price of Share 32.20$ 29.99$
Formula 1.43$ 1.67$
Financial Leverage Ratio
Market Value Ratio
Profitability Ratio
Efficiency Ratio
Liquidity Ratio
Interpretation
Significant Changes in Financial Results
The financial results of the company shows that the profitability ratio of the company
that is calculated by operating margin is same over the two years. In the year 2017, it was 6%
and in the year 2018, it was also 6%. This ratios indicates that the company is making profit
after paying their variable costs of the production such as raw material, wages and so on. It
shows that the company is having les financial risk and it is efficient enough for controlling
the costs as well as expenses that are associated with the business operations (Robinson et al.
2015). The efficiency ratio of the company that is calculated by assets turnover shows that in
the year 2017, it was 1.67 and during the year 2018, it was 1.76. The trend of two year shows
that as compare to the year 2017, the turnover of asset is higher in the year 2018. It means
Paraphrase This Document
Need a fresh take? Get an instant paraphrase of this document with our AI Paraphraser

1INVESTOR REPORT
that the company is efficient enough for using their assets to generate sales (Crowther 2018).
Moreover, the liquidity ratio of the company calculated by current ratio shows that, in the
year 2017, the ratio was 0.93 and during the year 2018, it was 0.87. It means that the
company is able for generating its short-term financial obligations out of their short-term
assets. Further, the financial leverage ratio calculated by debt equity ratio shows that, in the
year 2017, ratio was 24% and during the year 2018, the ratio was 18%. It shows that the
dependency towards the debt has been decreased by company. Lastly, the market value ratio
calculated by the dividend yield ratio shows that, in the year 2017, the ratio was 1.43 and for
the year 2018, it was 1.67. It shows that the company is paying the dividends on continuous
basis for maintaining the interest of the investors (Wesfarmers.com.au. 2019).
Non-Financial Information
The businesses of the company consist of Coles, Flybuys, BWP Trust, Gresham
Partners and Wespine Industries. In the Coles Group Limited, Wesfarmers holds 15 per cent,
which is the largest retailer selling everyday products such as household goods, groceries and
so on. Moreover, shareholding of 50% is holded by Coles Group and Wesfarmers that is in
the leading loyalty as well as Data Company. The interest of 24.56 per cent is hold by
Wesfarmers in BWP Trust that owns warehouse retailing properties. The interest of 50% is
hold by Wesfarmers in Gresham Partners Group Ltd. that is the leading business I
independent financial services. Lastly, Wesfarmers own 50% interest in the Westpine
Industries that operates plantation softwood sawmill (Simon et al. 2015).
The retail sector Australia has witnessed the positive growth in the despite of the low
increase in the wages as well as rising of the household debt. However, the future of the retail
sector of retail sector of Australia depends on the disruptive forces such as the changes in the
patterns of spending of consumers as well as influx of the foreign companies, which focuses
on the new approaches formulation in the retailing sector of Australia (Sauaia 2014). This
sector has recognized the growth rate in the 5%, 3% as well as 2.6% in the New South Wales,
Victoria as well as South Australia. Moreover, the company is has strong capability of
management and is accountable for the development of the strategy, its execution and their
day-to-day performance of operations. The group has made the strategy of diversifying the
sources of funding, pre-fund upcoming maturities as well as maintaining the presence in the
key markets (Arkan 2016).
Conclusion and Recommendations
Therefore, it can be concluded from the analysis that the financial position of
the company, Wesfarmers Limited in terms of its profitability, cash management, liquidity as
well as market is that the company is performing on the average basis. The profitability ratio
is stagnant, there is not much increase in the efficiency ratio, the liquidity ratio is below 1 that
means its incapability of the company in paying its short-term liabilities, the financial
leverage of the company has been reduced by 6% and the dividend yield ratio shows that the
company is paying the dividend on the regular basis. However, the non-financial shows that
the market of the Australia in the retail sector is performing well. Moreover, the management
has the capability for making strategic decisions regarding the development and growth of the
organization.
Hence, the investors should continue to invest in the company because of its long-
term approach. However, the company is given recommendations that they should increase
the liquidity of the company by increasing the amount of current assets and they should
reduce the expenses of the company that is increasing every year for increasing the
profitability of the company.

2INVESTOR REPORT
Reference
Arkan, T., 2016. The importance of financial ratios in predicting stock price trends: A case
study in emerging markets. Finanse, Rynki Finansowe, Ubezpieczenia, 79(1), pp.13-26.
Crowther, D., 2018. A Social Critique of Corporate Reporting: A Semiotic Analysis of
Corporate Financial and Environmental Reporting: A Semiotic Analysis of Corporate
Financial and Environmental Reporting. Routledge.
Group, D. (2019). Home . [online] Wesfarmers.com.au. Available at:
https://www.wesfarmers.com.au/ [Accessed 8 Jun. 2019].
Robinson, T.R., Henry, E., Pirie, W.L. and Broihahn, M.A., 2015. International financial
statement analysis. John Wiley & Sons.
Sauaia, A.C.A., 2014, March. Evaluation of performance in business games: financial and
non financial approaches. In Developments in Business Simulation and Experiential
Learning: Proceedings of the Annual ABSEL conference (Vol. 28).
Simon, A., Bartle, C., Stockport, G., Smith, B., Klobas, J.E. and Sohal, A., 2015. Business
leaders’ views on the importance of strategic and dynamic capabilities for successful
financial and non-financial business performance. International Journal of Productivity and
Performance Management, 64(7), pp.908-931.
Wesfarmers.com.au. (2019). [online] Available at:
https://www.wesfarmers.com.au/docs/default-source/asx-announcements/2018-annual-
report.pdf?sfvrsn=0 [Accessed 8 Jun. 2019].
⊘ This is a preview!⊘
Do you want full access?
Subscribe today to unlock all pages.

Trusted by 1+ million students worldwide
1 out of 3
Related Documents
Your All-in-One AI-Powered Toolkit for Academic Success.
+13062052269
info@desklib.com
Available 24*7 on WhatsApp / Email
Unlock your academic potential
Copyright © 2020–2025 A2Z Services. All Rights Reserved. Developed and managed by ZUCOL.


