Identifying and Analyzing IoT's Influence on Business Success
VerifiedAdded on 2023/01/10
|14
|3250
|30
Report
AI Summary
This report, conducted using Computing Research Methods, investigates the influence of the Internet of Things (IoT) on the growth and success of business organizations. It begins by analyzing various computer-based research techniques, including data collection, storage, and transmission, and evaluates different sampling methods such as random, systematic, and snowball sampling. The report also assesses ethical considerations in computer-based research, particularly focusing on privacy violations. Furthermore, it evaluates tools and techniques for data analysis, including frequency distribution, measures of central tendency, and correlation tests. The core of the report presents a research proposal with a defined aim to identify and analyze the influence of IoT on business growth, along with specific objectives. The methodology involves a survey of 50 small business owners using a questionnaire distributed via email, employing snowball sampling. The data analysis utilizes SPSS software to analyze measures of central tendency and frequency distributions, revealing insights into business owners' awareness and usage of IoT, its perceived benefits (real-time information, equipment management, productivity), and its impact on company growth. The research concludes with recommendations for further improvement and development of IoT integration in businesses.
Computing Research Methods
1
1
Paraphrase This Document
Need a fresh take? Get an instant paraphrase of this document with our AI Paraphraser
Contents
Activity 1.........................................................................................................................................1
1.1 Analysing a range of computer based research techniques...................................................1
1.2 Evaluating different sampling techniques used in computer based research projects...........1
1.3 Assessing ethical issues in using computer based research techniques.................................2
1.4 Evaluating the tools and techniques used to analyse the data...............................................2
Activity 2.........................................................................................................................................3
2.1 Research proposal with aim and objectives...........................................................................3
2.2 Data collection method..........................................................................................................4
2.3 Feasibility of the project........................................................................................................5
2.4 Report format.........................................................................................................................5
Activity 3.........................................................................................................................................5
3.1 Data analysis..........................................................................................................................5
3.2 Research findings.................................................................................................................10
3.3 Recommendations for improvement....................................................................................11
REFERENCES..............................................................................................................................12
2
TOPIC
“Identifying and analysing the influence of internet of things on growth and success of a
business organisation”
Activity 1
1.1 Analysing a range of computer based research techniques
A computer based research is a type of investigation in which research over a topic has
been conducted using computer program and systems. In order to investigate present research
topic, there are various computer based research techniques such as collecting, storing and
transmitting (Marinescu, 2017).
The first computer based research technique is collecting. Under this technique,
investigator collects data from primary and secondary sources by using computer programs only.
The primary data using computer program can be gained using electronic mails and survey
websites such as Google Survey. This technique helps in collecting the appropriate data and then
utilising it to gain findings.
Another computer based research technique is storing, this technique is used to conduct
secondary research in which data whether numeric or not is collected from sources of internet
such online books, journals, articles and web pages and then stored in a computer system which
is then analysed to make conclusions.
Another computer based research technique is transmitting in which investigation is
conducted through the way of transmitting data from one software program to another.
All the above mentioned techniques are used by an investigator while undertaking computer
based research (Cambria, 2016).
1.2 Evaluating different sampling techniques used in computer based research projects
Sampling is a procedure in which a small sample is being selected from the entire
population in order to conduct research. In case of computer based investigation, there is few
sampling technique using which a sample is selected from the population (Ellis and Ellis, 2011).
These sampling techniques are random simple sampling, snowball sampling, systematic
sampling and many more; each of these techniques is appropriate in certain scenarios and for
investigation topic.
3
⊘ This is a preview!⊘
Do you want full access?
Subscribe today to unlock all pages.
Trusted by 1+ million students worldwide
Random sampling is a technique in which first a number of samples have been selected
and then randomly a sample is selected based upon probability from the population. This
technique eliminates the biasness in the results and is also most easier way to conduct.
Systematic sampling is slightly different than the above technique. In this technique, a
number is selected randomly; for example let’s suppose the selected number is 6. Once the
number is selected then every 6th respondent from the entire population will be a part of the
sample.
Snowball sampling is another technique which is way different then the above two
sampling techniques. In this technique, those respondents are first selected which are easier and
available to be accessed. Then with the recommendation of these respondents, other respondents
are selected (Drost, 2011).
Simple random and systematic sampling techniques are appropriate when there is a huge
availability of respondents from which investigator has the choice to select. This particular
investigation will be conducted by using small business owners as respondents and accessibility
to such respondents is difficult due to which the method of snowball sampling will be selected.
1.3 Assessing ethical issues in using computer based research techniques
A computer based research can involve various ethical issues which are required to be
considered (Wortmann and Flüchter, 2015). These ethical issues are the restrictions which
impacts the accuracy of the results of an investigation. Few ethical issues in computer based
research are violation of privacy and legal risks. In the case of present research which has been
conducted for Internet of things; the ethical issue which was faced is violation of privacy.
1.4 Evaluating the tools and techniques used to analyse the data
In order to analyse the data, there are various tools and techniques which can be used. These
tools include frequency distribution, measures of central tendency, correlation, regression and
many more. The tools and techniques which are intended to be used in present research are
critically analysed below:
Frequency distribution – This technique is used for close ended questions and is a process in
which every option is analysed to identify its own frequency. This method helps in analysing the
responses of respondents. This technique can be used by using the computer application of
Microsoft Excel or SPSS.
4
Paraphrase This Document
Need a fresh take? Get an instant paraphrase of this document with our AI Paraphraser
Measure of central tendency – This technique is used to calculate the mean, mode, median,
range, maximum, minimum, variance and standard deviation of the data which has been
collected. This technique is only used for quantitative data and can be conducted using computer
application of Microsoft Excel or SPSS (Xiao and Chen, 2012).
Correlation test – Correlation is an inferential statistics that helps in identifying the
relationship between two variables by using the correlation co efficient. There are various
algorithms using which correlation between variables can be identified; in this investigation
Pearson’s correlation test will be used.
Activity 2
2.1 Research proposal with aim and objectives
Research background
The area of interest for this research is computing and the topic related to this area is Internet of
things. In this investigation the influence of IoT will be identified and analysed on the growth
and success of business organisation (Li, Da Xu and Zhao, 2015). The system of internet of
things is a mechanism of interrelated computing devices which helps in transferring the data
throughout the network with human to computer interaction. This mechanism is currently used
by various business organisations in order to gain competitive advantage (Da Xu, He and Li,
2014).
Rationale of the research
The rationale behind conducting this research is to develop an understanding that how computing
and its tools such as internet of things can help a business to acquire growth and gain competitive
advantage in the market. This research is not only conducted for the knowledge development of
researcher but is also conducted for its future readers as a source of knowledge regarding
computing and its benefits to businesses.
Aim
To identify and analyse the influence of internet of things on growth and success of a business
organisation.
Objectives
Identify benefits of internet of things for business organisations
Access whether there is a significant relationship between internet of things and growth
5
of an organisations.
Determine whether the challenges of internet of things suppress its benefits.
Resources required
In order to conduct this investigation, there are various resources which will be required. An
estimate for these required resources include 6 weeks of time, 50 pounds, computer system,
internet and communication tool of electronic mail.
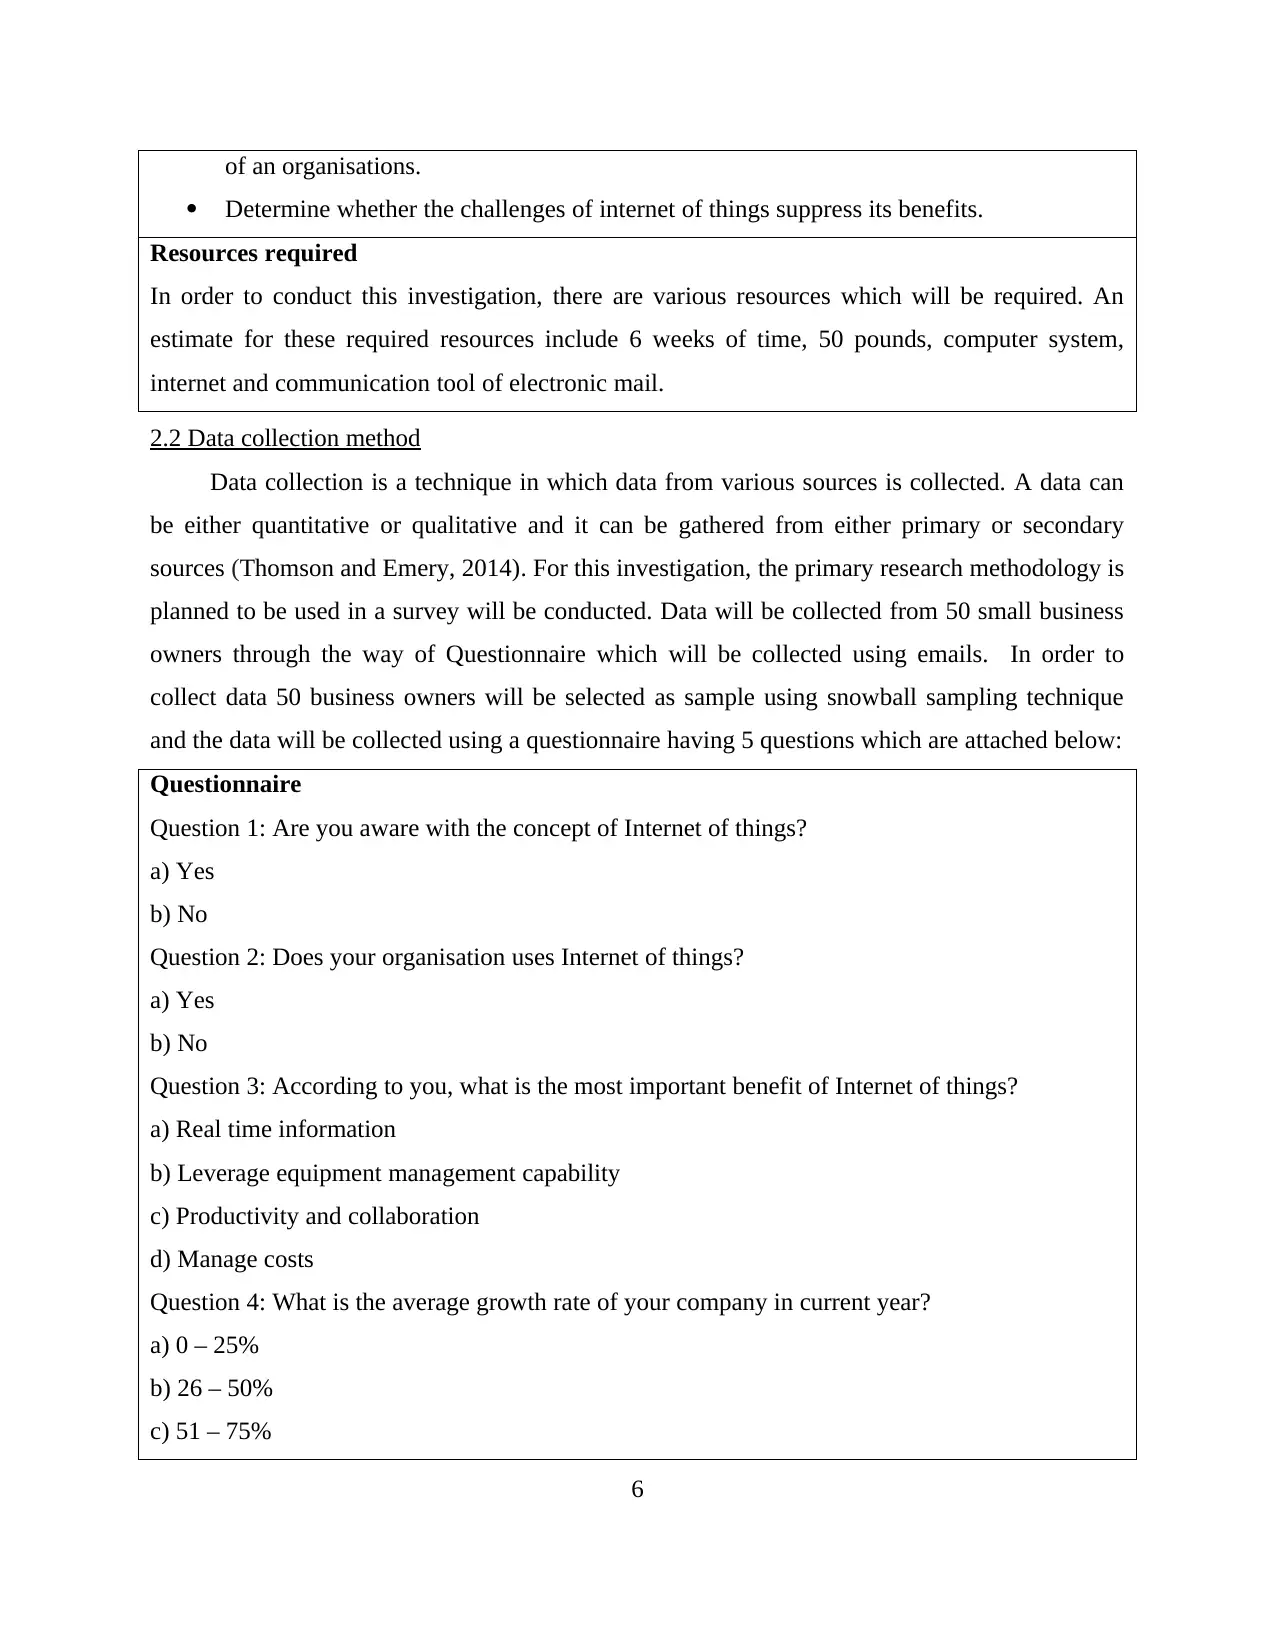
2.2 Data collection method
Data collection is a technique in which data from various sources is collected. A data can
be either quantitative or qualitative and it can be gathered from either primary or secondary
sources (Thomson and Emery, 2014). For this investigation, the primary research methodology is
planned to be used in a survey will be conducted. Data will be collected from 50 small business
owners through the way of Questionnaire which will be collected using emails. In order to
collect data 50 business owners will be selected as sample using snowball sampling technique
and the data will be collected using a questionnaire having 5 questions which are attached below:
Questionnaire
Question 1: Are you aware with the concept of Internet of things?
a) Yes
b) No
Question 2: Does your organisation uses Internet of things?
a) Yes
b) No
Question 3: According to you, what is the most important benefit of Internet of things?
a) Real time information
b) Leverage equipment management capability
c) Productivity and collaboration
d) Manage costs
Question 4: What is the average growth rate of your company in current year?
a) 0 – 25%
b) 26 – 50%
c) 51 – 75%
6
Determine whether the challenges of internet of things suppress its benefits.
Resources required
In order to conduct this investigation, there are various resources which will be required. An
estimate for these required resources include 6 weeks of time, 50 pounds, computer system,
internet and communication tool of electronic mail.
2.2 Data collection method
Data collection is a technique in which data from various sources is collected. A data can
be either quantitative or qualitative and it can be gathered from either primary or secondary
sources (Thomson and Emery, 2014). For this investigation, the primary research methodology is
planned to be used in a survey will be conducted. Data will be collected from 50 small business
owners through the way of Questionnaire which will be collected using emails. In order to
collect data 50 business owners will be selected as sample using snowball sampling technique
and the data will be collected using a questionnaire having 5 questions which are attached below:
Questionnaire
Question 1: Are you aware with the concept of Internet of things?
a) Yes
b) No
Question 2: Does your organisation uses Internet of things?
a) Yes
b) No
Question 3: According to you, what is the most important benefit of Internet of things?
a) Real time information
b) Leverage equipment management capability
c) Productivity and collaboration
d) Manage costs
Question 4: What is the average growth rate of your company in current year?
a) 0 – 25%
b) 26 – 50%
c) 51 – 75%
6
⊘ This is a preview!⊘
Do you want full access?
Subscribe today to unlock all pages.
Trusted by 1+ million students worldwide
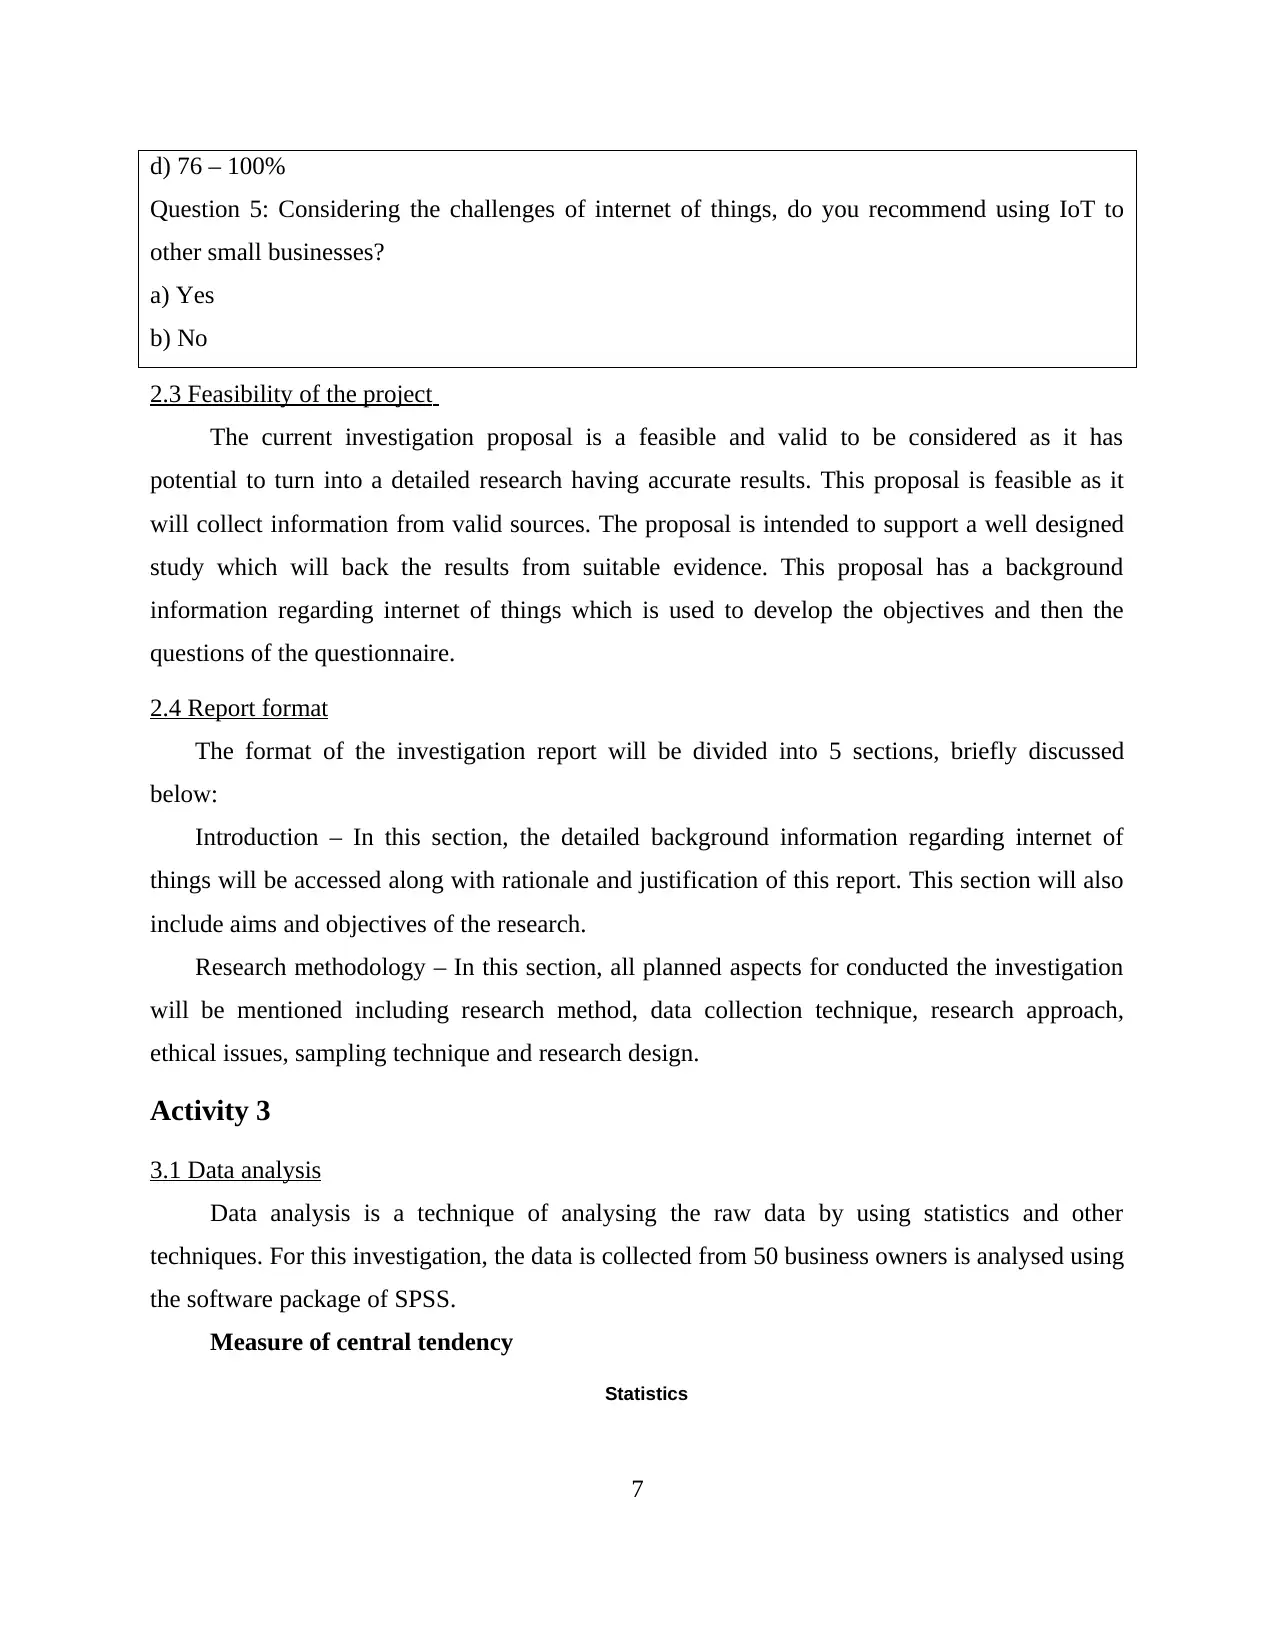
d) 76 – 100%
Question 5: Considering the challenges of internet of things, do you recommend using IoT to
other small businesses?
a) Yes
b) No
2.3 Feasibility of the project
The current investigation proposal is a feasible and valid to be considered as it has
potential to turn into a detailed research having accurate results. This proposal is feasible as it
will collect information from valid sources. The proposal is intended to support a well designed
study which will back the results from suitable evidence. This proposal has a background
information regarding internet of things which is used to develop the objectives and then the
questions of the questionnaire.
2.4 Report format
The format of the investigation report will be divided into 5 sections, briefly discussed
below:
Introduction – In this section, the detailed background information regarding internet of
things will be accessed along with rationale and justification of this report. This section will also
include aims and objectives of the research.
Research methodology – In this section, all planned aspects for conducted the investigation
will be mentioned including research method, data collection technique, research approach,
ethical issues, sampling technique and research design.
Activity 3
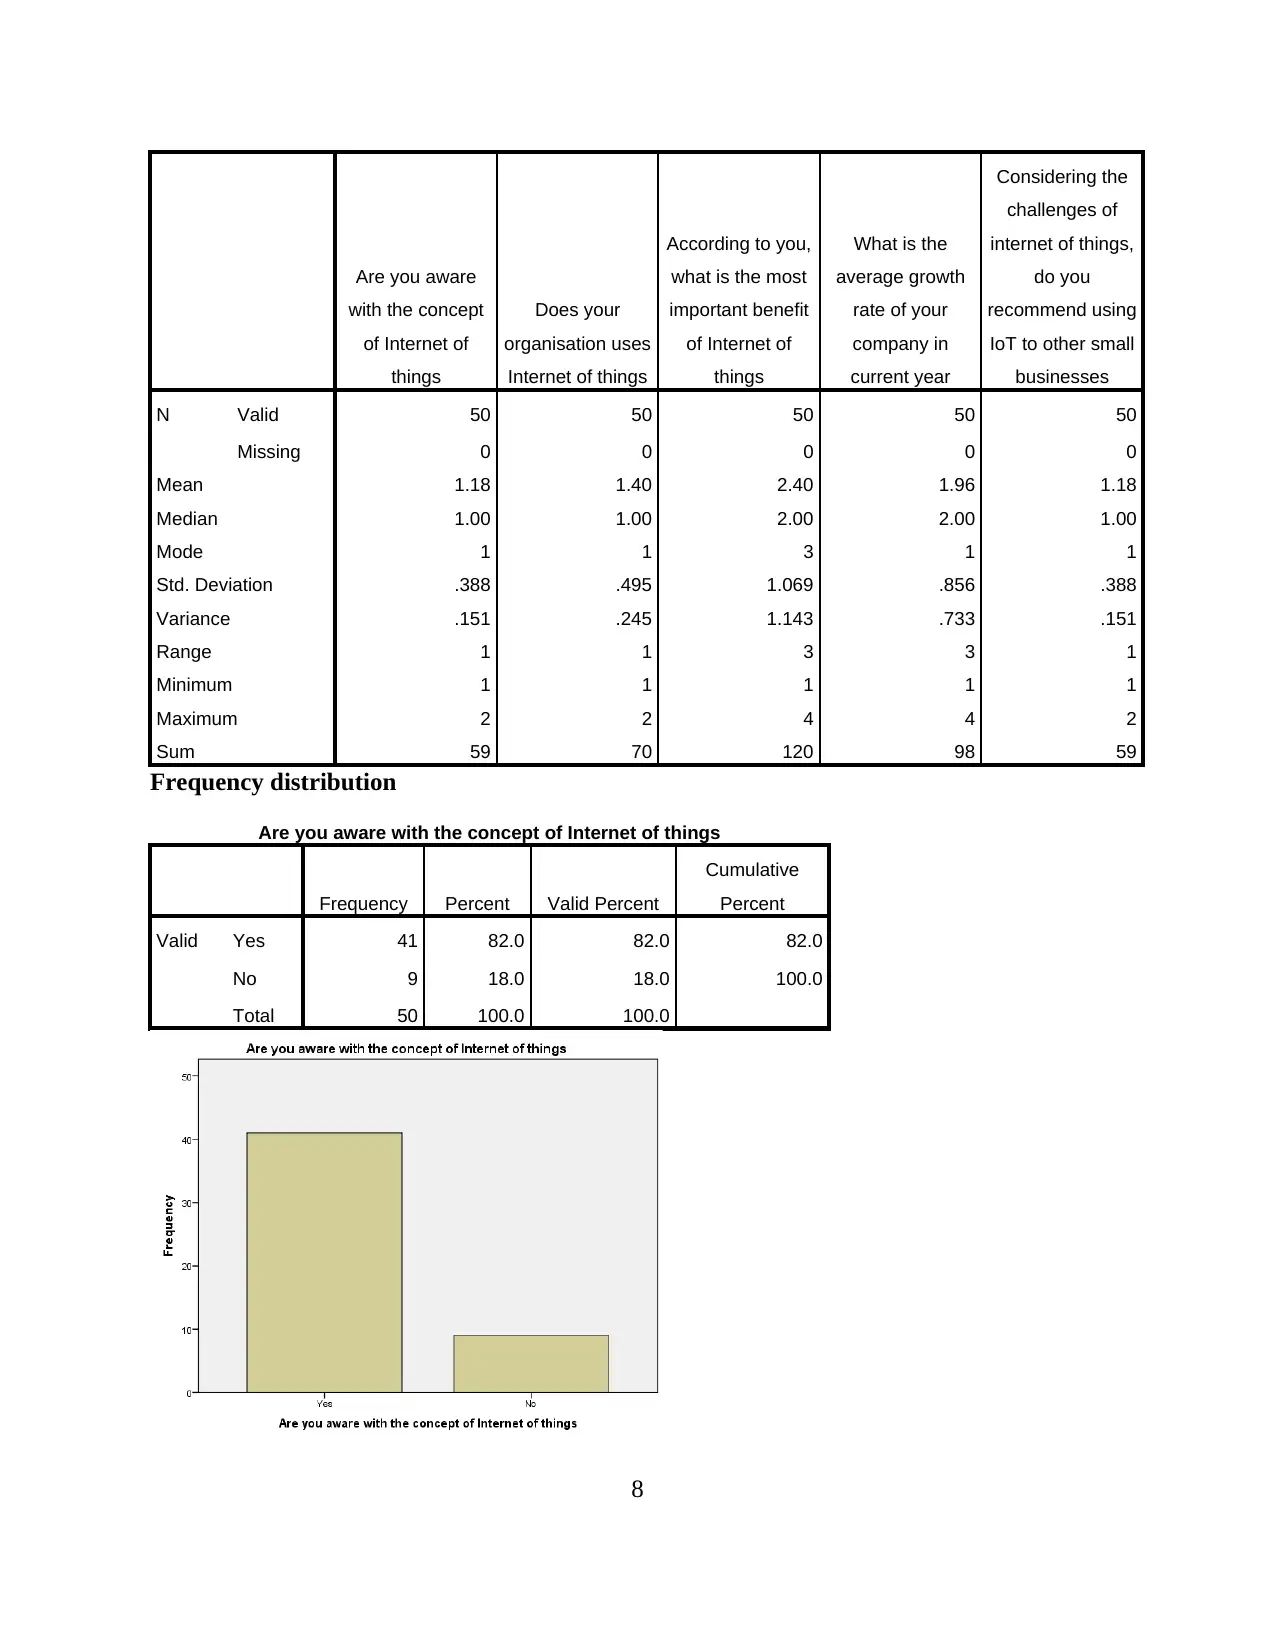
3.1 Data analysis
Data analysis is a technique of analysing the raw data by using statistics and other
techniques. For this investigation, the data is collected from 50 business owners is analysed using
the software package of SPSS.
Measure of central tendency
Statistics
7
Question 5: Considering the challenges of internet of things, do you recommend using IoT to
other small businesses?
a) Yes
b) No
2.3 Feasibility of the project
The current investigation proposal is a feasible and valid to be considered as it has
potential to turn into a detailed research having accurate results. This proposal is feasible as it
will collect information from valid sources. The proposal is intended to support a well designed
study which will back the results from suitable evidence. This proposal has a background
information regarding internet of things which is used to develop the objectives and then the
questions of the questionnaire.
2.4 Report format
The format of the investigation report will be divided into 5 sections, briefly discussed
below:
Introduction – In this section, the detailed background information regarding internet of
things will be accessed along with rationale and justification of this report. This section will also
include aims and objectives of the research.
Research methodology – In this section, all planned aspects for conducted the investigation
will be mentioned including research method, data collection technique, research approach,
ethical issues, sampling technique and research design.
Activity 3
3.1 Data analysis
Data analysis is a technique of analysing the raw data by using statistics and other
techniques. For this investigation, the data is collected from 50 business owners is analysed using
the software package of SPSS.
Measure of central tendency
Statistics
7
Paraphrase This Document
Need a fresh take? Get an instant paraphrase of this document with our AI Paraphraser
Are you aware
with the concept
of Internet of
things
Does your
organisation uses
Internet of things
According to you,
what is the most
important benefit
of Internet of
things
What is the
average growth
rate of your
company in
current year
Considering the
challenges of
internet of things,
do you
recommend using
IoT to other small
businesses
N Valid 50 50 50 50 50
Missing 0 0 0 0 0
Mean 1.18 1.40 2.40 1.96 1.18
Median 1.00 1.00 2.00 2.00 1.00
Mode 1 1 3 1 1
Std. Deviation .388 .495 1.069 .856 .388
Variance .151 .245 1.143 .733 .151
Range 1 1 3 3 1
Minimum 1 1 1 1 1
Maximum 2 2 4 4 2
Sum 59 70 120 98 59
Frequency distribution
Are you aware with the concept of Internet of things
Frequency Percent Valid Percent
Cumulative
Percent
Valid Yes 41 82.0 82.0 82.0
No 9 18.0 18.0 100.0
Total 50 100.0 100.0
8
Interpretation – From the above frequency distribution and MCT of first question, it has
been analyzed that majority of the business owners are well aware about the system of internet of
things. The above analysis shows that the option yes was selected by 41 business owners due to
which this response is the mode and maximum.
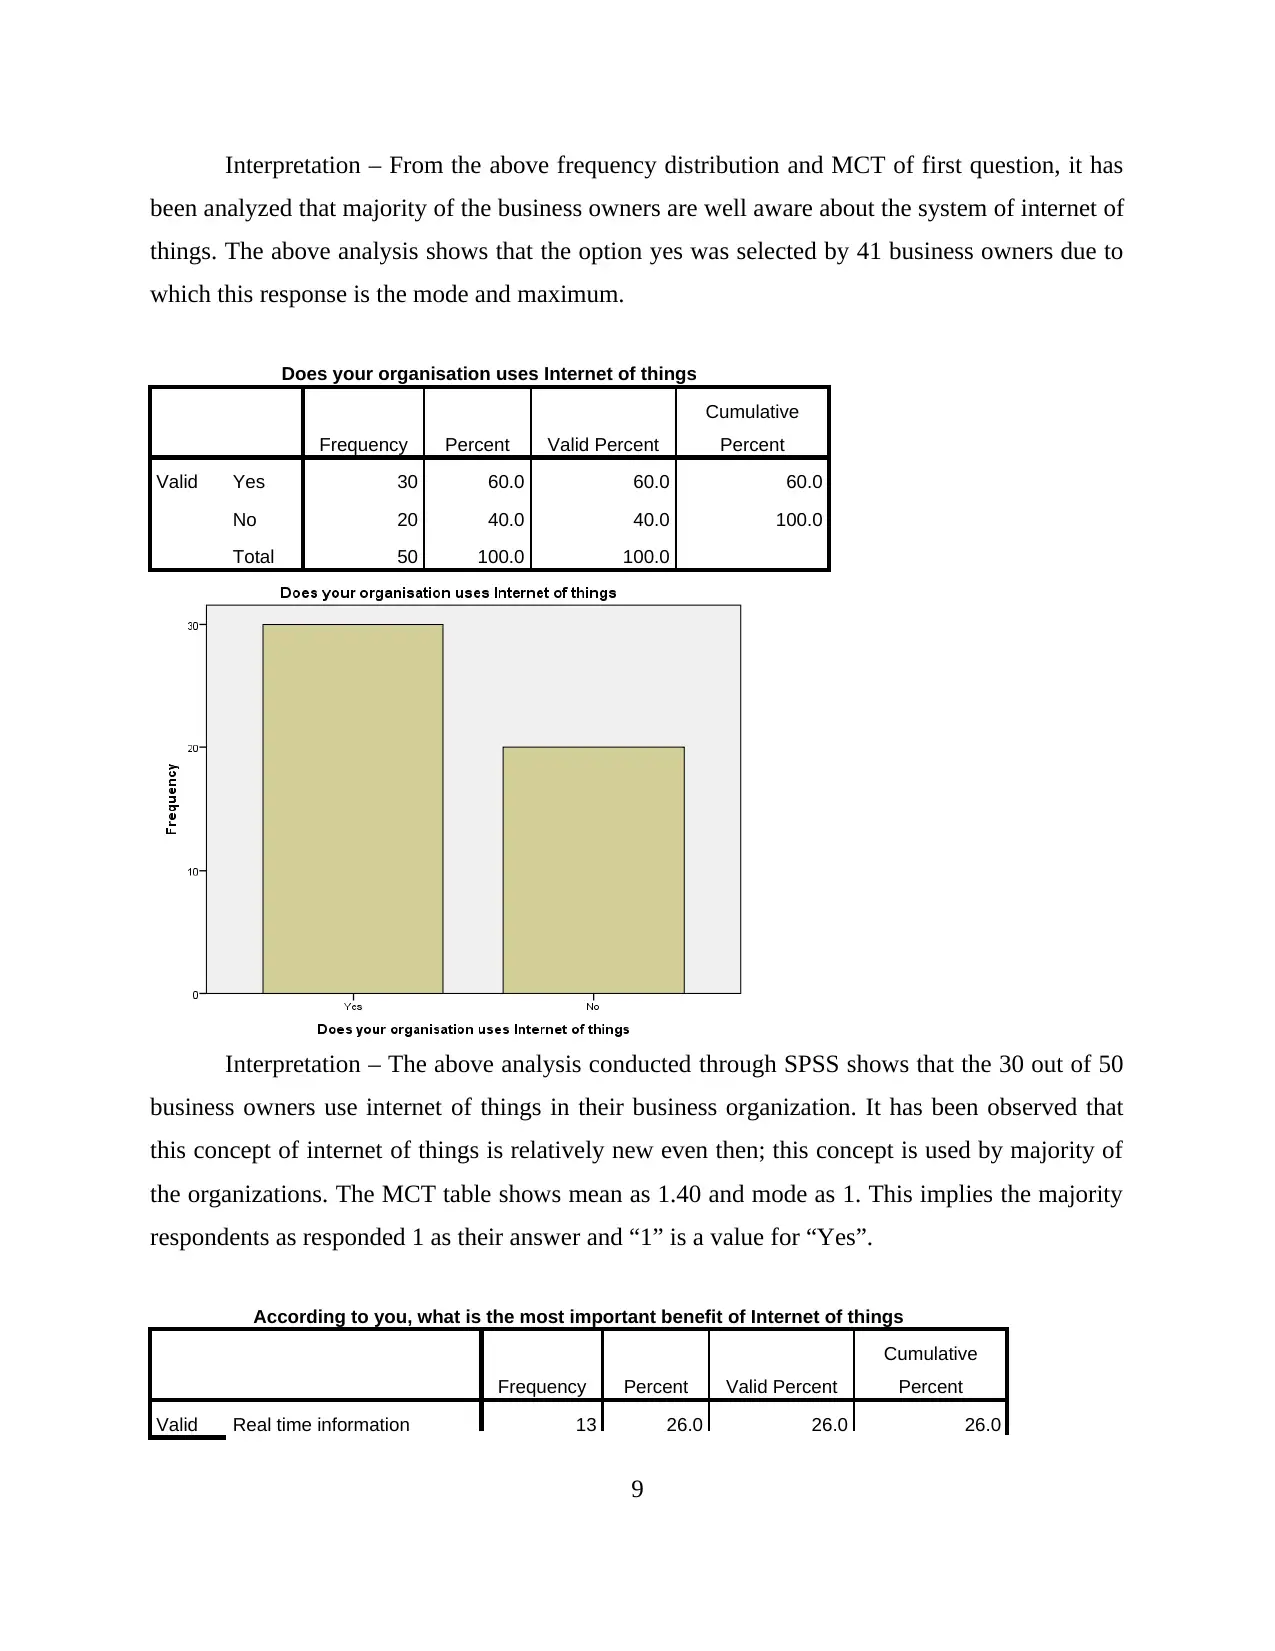
Does your organisation uses Internet of things
Frequency Percent Valid Percent
Cumulative
Percent
Valid Yes 30 60.0 60.0 60.0
No 20 40.0 40.0 100.0
Total 50 100.0 100.0
Interpretation – The above analysis conducted through SPSS shows that the 30 out of 50
business owners use internet of things in their business organization. It has been observed that
this concept of internet of things is relatively new even then; this concept is used by majority of
the organizations. The MCT table shows mean as 1.40 and mode as 1. This implies the majority
respondents as responded 1 as their answer and “1” is a value for “Yes”.
According to you, what is the most important benefit of Internet of things
Frequency Percent Valid Percent
Cumulative
Percent
Valid Real time information 13 26.0 26.0 26.0
9
been analyzed that majority of the business owners are well aware about the system of internet of
things. The above analysis shows that the option yes was selected by 41 business owners due to
which this response is the mode and maximum.
Does your organisation uses Internet of things
Frequency Percent Valid Percent
Cumulative
Percent
Valid Yes 30 60.0 60.0 60.0
No 20 40.0 40.0 100.0
Total 50 100.0 100.0
Interpretation – The above analysis conducted through SPSS shows that the 30 out of 50
business owners use internet of things in their business organization. It has been observed that
this concept of internet of things is relatively new even then; this concept is used by majority of
the organizations. The MCT table shows mean as 1.40 and mode as 1. This implies the majority
respondents as responded 1 as their answer and “1” is a value for “Yes”.
According to you, what is the most important benefit of Internet of things
Frequency Percent Valid Percent
Cumulative
Percent
Valid Real time information 13 26.0 26.0 26.0
9
⊘ This is a preview!⊘
Do you want full access?
Subscribe today to unlock all pages.
Trusted by 1+ million students worldwide
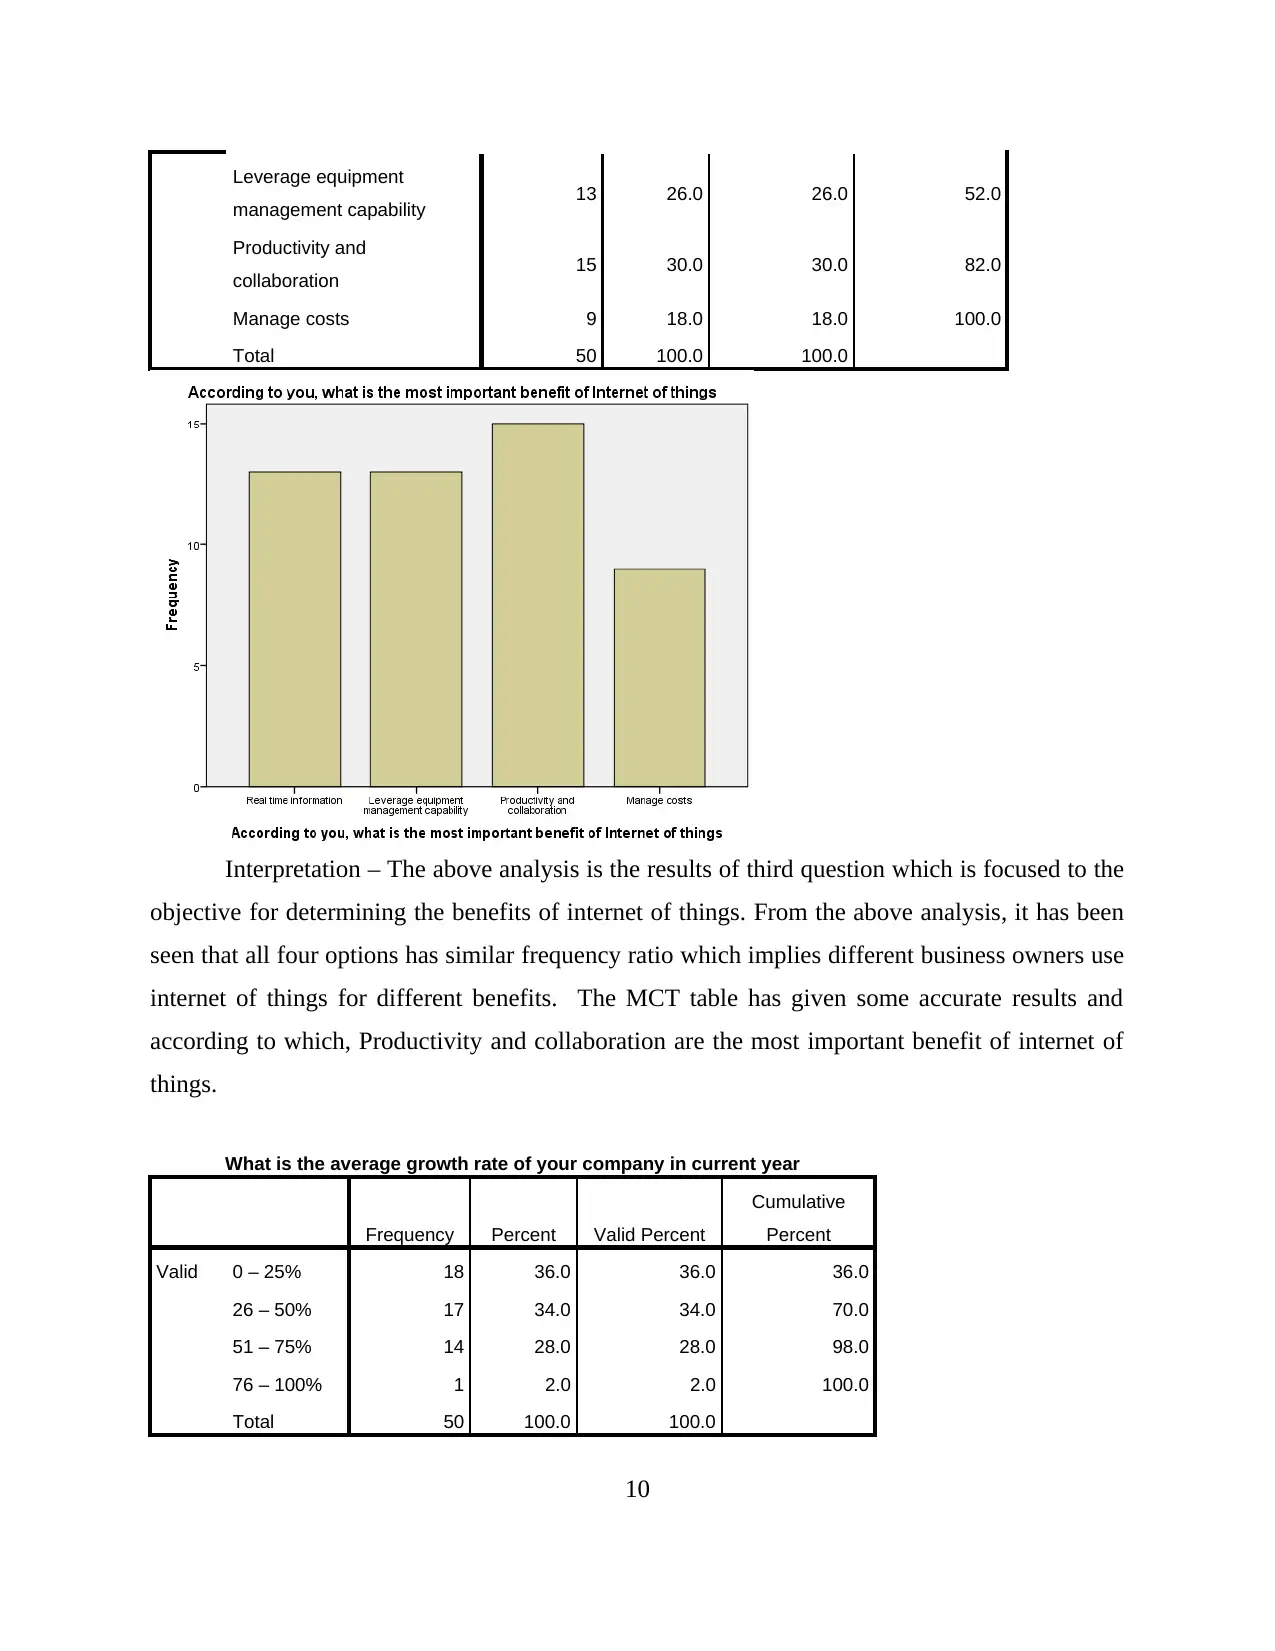
Leverage equipment
management capability 13 26.0 26.0 52.0
Productivity and
collaboration 15 30.0 30.0 82.0
Manage costs 9 18.0 18.0 100.0
Total 50 100.0 100.0
Interpretation – The above analysis is the results of third question which is focused to the
objective for determining the benefits of internet of things. From the above analysis, it has been
seen that all four options has similar frequency ratio which implies different business owners use
internet of things for different benefits. The MCT table has given some accurate results and
according to which, Productivity and collaboration are the most important benefit of internet of
things.
What is the average growth rate of your company in current year
Frequency Percent Valid Percent
Cumulative
Percent
Valid 0 – 25% 18 36.0 36.0 36.0
26 – 50% 17 34.0 34.0 70.0
51 – 75% 14 28.0 28.0 98.0
76 – 100% 1 2.0 2.0 100.0
Total 50 100.0 100.0
10
Paraphrase This Document
Need a fresh take? Get an instant paraphrase of this document with our AI Paraphraser
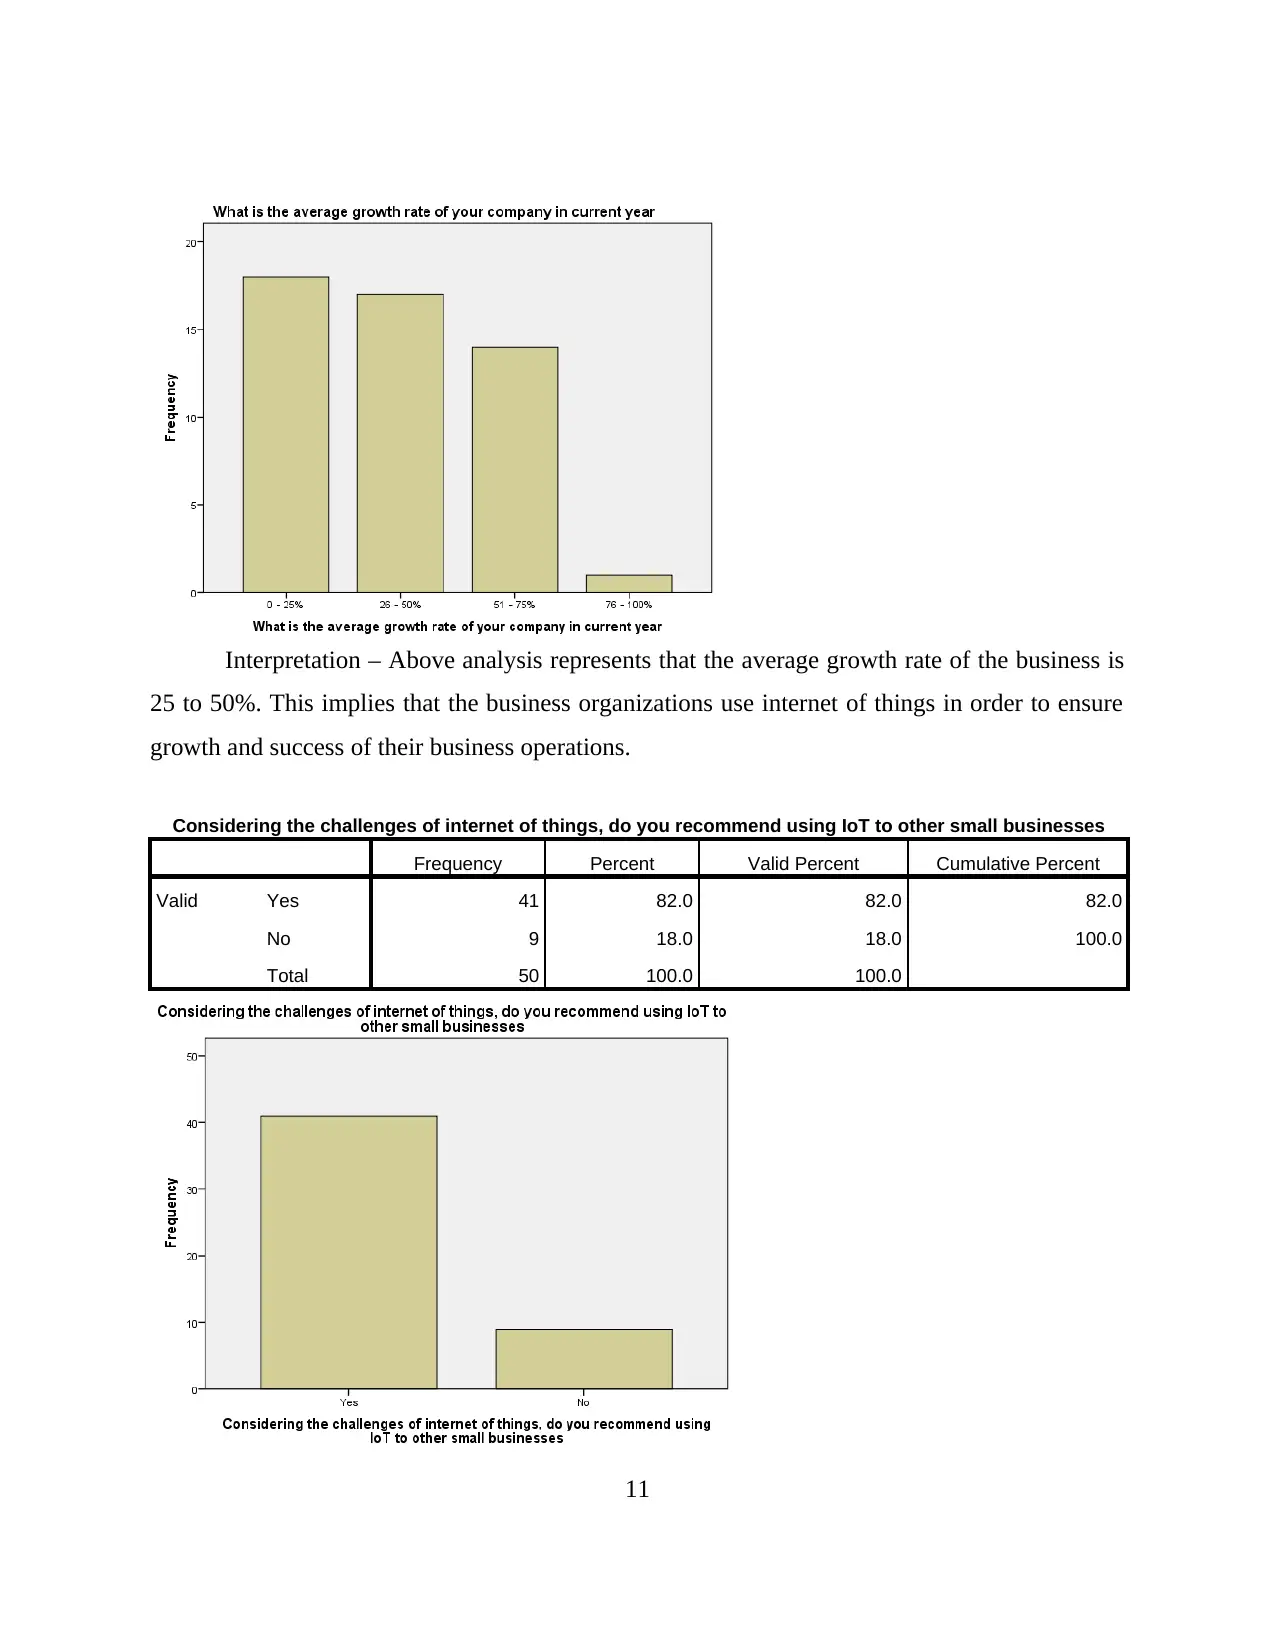
Interpretation – Above analysis represents that the average growth rate of the business is
25 to 50%. This implies that the business organizations use internet of things in order to ensure
growth and success of their business operations.
Considering the challenges of internet of things, do you recommend using IoT to other small businesses
Frequency Percent Valid Percent Cumulative Percent
Valid Yes 41 82.0 82.0 82.0
No 9 18.0 18.0 100.0
Total 50 100.0 100.0
11
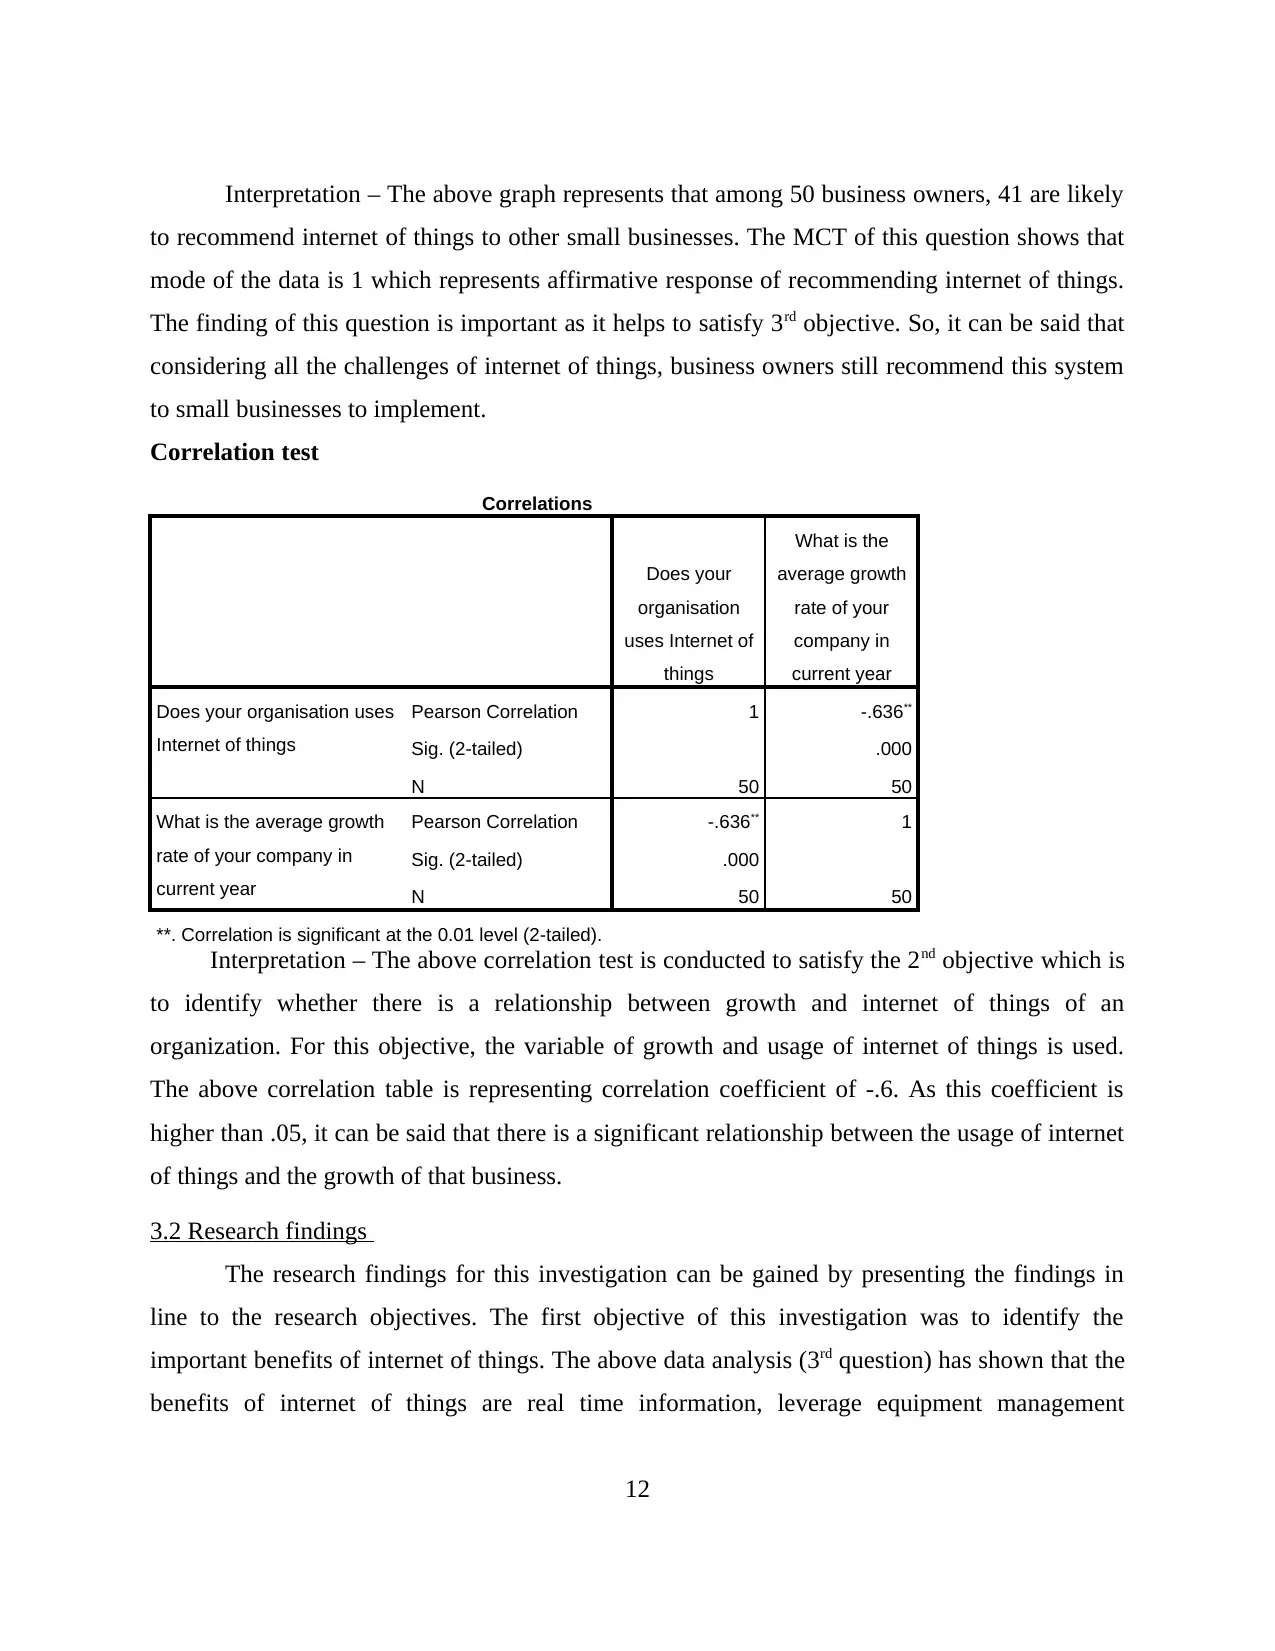
Interpretation – The above graph represents that among 50 business owners, 41 are likely
to recommend internet of things to other small businesses. The MCT of this question shows that
mode of the data is 1 which represents affirmative response of recommending internet of things.
The finding of this question is important as it helps to satisfy 3rd objective. So, it can be said that
considering all the challenges of internet of things, business owners still recommend this system
to small businesses to implement.
Correlation test
Correlations
Does your
organisation
uses Internet of
things
What is the
average growth
rate of your
company in
current year
Does your organisation uses
Internet of things
Pearson Correlation 1 -.636**
Sig. (2-tailed) .000
N 50 50
What is the average growth
rate of your company in
current year
Pearson Correlation -.636** 1
Sig. (2-tailed) .000
N 50 50
**. Correlation is significant at the 0.01 level (2-tailed).
Interpretation – The above correlation test is conducted to satisfy the 2nd objective which is
to identify whether there is a relationship between growth and internet of things of an
organization. For this objective, the variable of growth and usage of internet of things is used.
The above correlation table is representing correlation coefficient of -.6. As this coefficient is
higher than .05, it can be said that there is a significant relationship between the usage of internet
of things and the growth of that business.
3.2 Research findings
The research findings for this investigation can be gained by presenting the findings in
line to the research objectives. The first objective of this investigation was to identify the
important benefits of internet of things. The above data analysis (3rd question) has shown that the
benefits of internet of things are real time information, leverage equipment management
12
⊘ This is a preview!⊘
Do you want full access?
Subscribe today to unlock all pages.
Trusted by 1+ million students worldwide
1 out of 14
Related Documents


Your All-in-One AI-Powered Toolkit for Academic Success.
+13062052269
info@desklib.com
Available 24*7 on WhatsApp / Email
![[object Object]](/_next/static/media/star-bottom.7253800d.svg)
Unlock your academic potential
Copyright © 2020–2026 A2Z Services. All Rights Reserved. Developed and managed by ZUCOL.