FINA6000 Managing Finance: Australian IPO Performance Analysis
VerifiedAdded on 2022/10/03
|14
|3123
|16
Report
AI Summary
This report undertakes a comprehensive analysis of Initial Public Offerings (IPOs) in the Australian market, focusing on the case studies of Steadfast Group, GDI Property, and Meridian Energy. The study investigates the motivations behind IPOs, the amounts raised, and the allocation of funds, while also addressing the phenomenon of underpricing and its implications. It examines the relationship between IPO activity and overall market conditions in Australia, providing insights into the number of IPOs conducted between 2007 and 2017. Furthermore, the report evaluates the performance of the selected companies within three years after their IPOs, considering both scenarios with and without dividends, and comparing their performance to the All Ordinary Index. The analysis incorporates financial data, including share prices, growth rates, dividends, and cost of equity, to assess the investment potential and market dynamics of IPOs.
ASSIGNMENT COVER SHEET
Please refer to the Academic Integrity Policy on the Torrens University website before completing the form.
SECTION 1: PERSONAL DETAILS
First Name Surname Student ID
College Course
SECTION 2: ASSIGNMENT INFORMATION
Subject Name Lecturer Name
Assignment Title Word Count
Is your assignment being submitted on or before the published due date? if yes, skip to declaration
SECTION 2A: ASSIGNMENT EXTENSION
Have you been approved for an
extension? (if no skip to declaration)
Who approved your extension
What is the approved extension date?
SECTION 3: DECLARATION
I declare that except where I have referenced, the work I am submitting in this attachment is my own work
I acknowledge and agree that the assessor of this assignment may, for the purpose of authenticating this
assignment, reproduce it for the purpose of detecting plagiarism
I have read and am aware of the Academic Integrity Policy available on the Torrens University Education
website
Student Signature Date
RECEIPT - INDIVIDUAL ASSIGNMENT COVER SHEET - STUDENT COPY
First
Name
Surnam
e
Student ID
Paraphrase This Document
Need a fresh take? Get an instant paraphrase of this document with our AI Paraphraser
Running head: MANAGING FINANCE
Subject Name:
Lecturer Name:
Assignment Title:
Received by
full name, signature & date:
Torrens University Australia operates through the following legal entity: Torrens University Australia Pty Ltd, ABN 99 154 937 005, HE PRV12209, RTO No. 41343,
CRICOS 03389E
Subject Name:
Lecturer Name:
Assignment Title:
Received by
full name, signature & date:
Torrens University Australia operates through the following legal entity: Torrens University Australia Pty Ltd, ABN 99 154 937 005, HE PRV12209, RTO No. 41343,
CRICOS 03389E
MANAGING FINANCE
1
Table of Contents
Introduction:...............................................................................................................................2
1. Providing information regarding the approbator decisions that was made by the
organisation while undertaking of the IPO:...............................................................................2
2. Understanding the presence of under-pricing with the IPOs:................................................5
3. Determining the IPO activity with the Market conditions of Australia:................................6
4. The performance within three years after the IPO without dividends:..................................8
5. The performance within three years after the IPO with dividends:.......................................9
Conclusion:................................................................................................................................9
References and Bibliography:..................................................................................................11
⊘ This is a preview!⊘
Do you want full access?
Subscribe today to unlock all pages.
Trusted by 1+ million students worldwide
MANAGING FINANCE
2
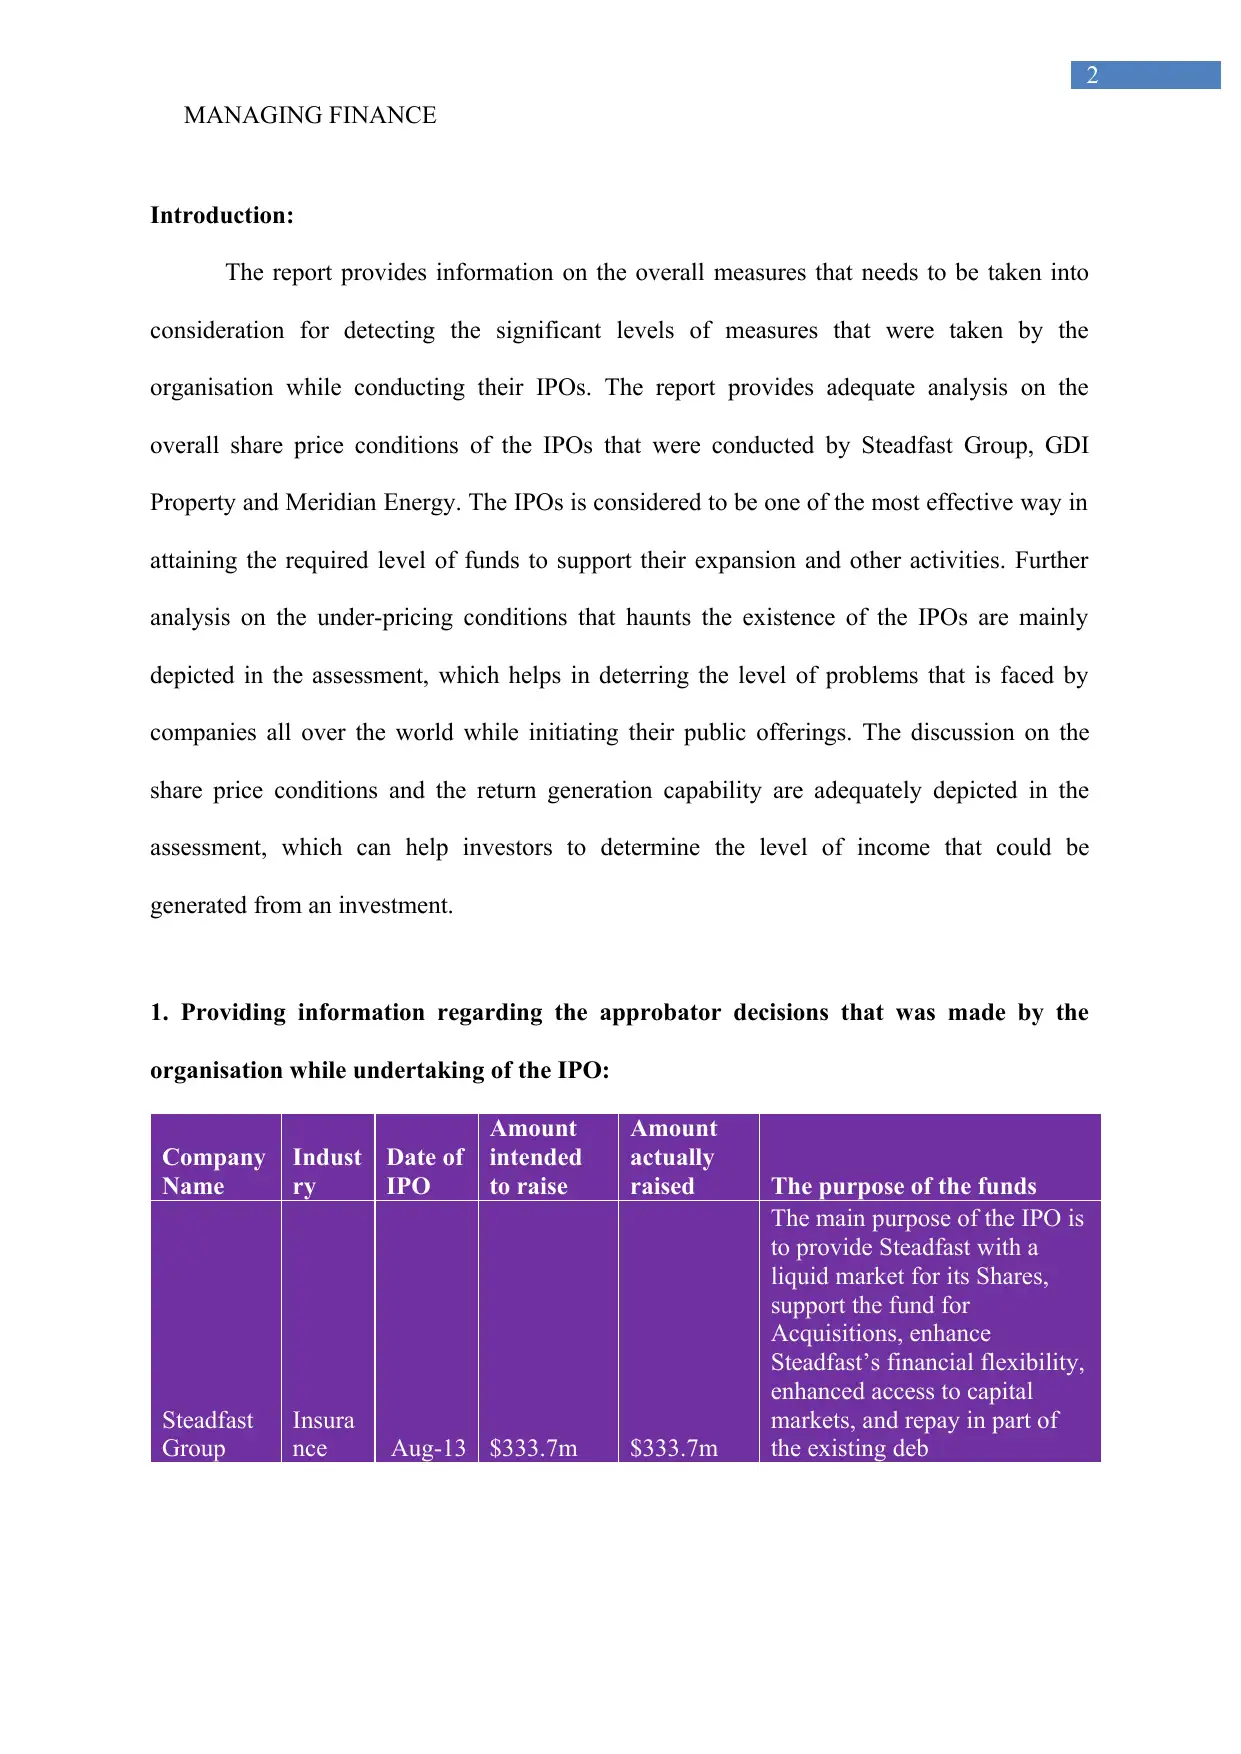
Introduction:
The report provides information on the overall measures that needs to be taken into
consideration for detecting the significant levels of measures that were taken by the
organisation while conducting their IPOs. The report provides adequate analysis on the
overall share price conditions of the IPOs that were conducted by Steadfast Group, GDI
Property and Meridian Energy. The IPOs is considered to be one of the most effective way in
attaining the required level of funds to support their expansion and other activities. Further
analysis on the under-pricing conditions that haunts the existence of the IPOs are mainly
depicted in the assessment, which helps in deterring the level of problems that is faced by
companies all over the world while initiating their public offerings. The discussion on the
share price conditions and the return generation capability are adequately depicted in the
assessment, which can help investors to determine the level of income that could be
generated from an investment.
1. Providing information regarding the approbator decisions that was made by the
organisation while undertaking of the IPO:
Company
Name
Indust
ry
Date of
IPO
Amount
intended
to raise
Amount
actually
raised The purpose of the funds
Steadfast
Group
Insura
nce Aug-13 $333.7m $333.7m
The main purpose of the IPO is
to provide Steadfast with a
liquid market for its Shares,
support the fund for
Acquisitions, enhance
Steadfast’s financial flexibility,
enhanced access to capital
markets, and repay in part of
the existing deb
2
Introduction:
The report provides information on the overall measures that needs to be taken into
consideration for detecting the significant levels of measures that were taken by the
organisation while conducting their IPOs. The report provides adequate analysis on the
overall share price conditions of the IPOs that were conducted by Steadfast Group, GDI
Property and Meridian Energy. The IPOs is considered to be one of the most effective way in
attaining the required level of funds to support their expansion and other activities. Further
analysis on the under-pricing conditions that haunts the existence of the IPOs are mainly
depicted in the assessment, which helps in deterring the level of problems that is faced by
companies all over the world while initiating their public offerings. The discussion on the
share price conditions and the return generation capability are adequately depicted in the
assessment, which can help investors to determine the level of income that could be
generated from an investment.
1. Providing information regarding the approbator decisions that was made by the
organisation while undertaking of the IPO:
Company
Name
Indust
ry
Date of
IPO
Amount
intended
to raise
Amount
actually
raised The purpose of the funds
Steadfast
Group
Insura
nce Aug-13 $333.7m $333.7m
The main purpose of the IPO is
to provide Steadfast with a
liquid market for its Shares,
support the fund for
Acquisitions, enhance
Steadfast’s financial flexibility,
enhanced access to capital
markets, and repay in part of
the existing deb
Paraphrase This Document
Need a fresh take? Get an instant paraphrase of this document with our AI Paraphraser
MANAGING FINANCE
3
GDI
Property
real
Estate Dec-13 $567.7m $567.7m
The organization used the IPO
for supporting the retire seed
trust fund, facilitate the
acquisition of Funds, increase
working capital, and provide
access to new form of funds.
Meridian
Energy
Utilitie
s Oct-13 $1129m $1121m
The main purpose of the offer
is to provide an opportunity for
the organization to sell up to
49% of its current shareholding
and maintain a mixed
ownership model. The IPO
would also enable Meridian
Energy to get access to capital
markets and commercial
independence, which would
improve their performance in
the long run
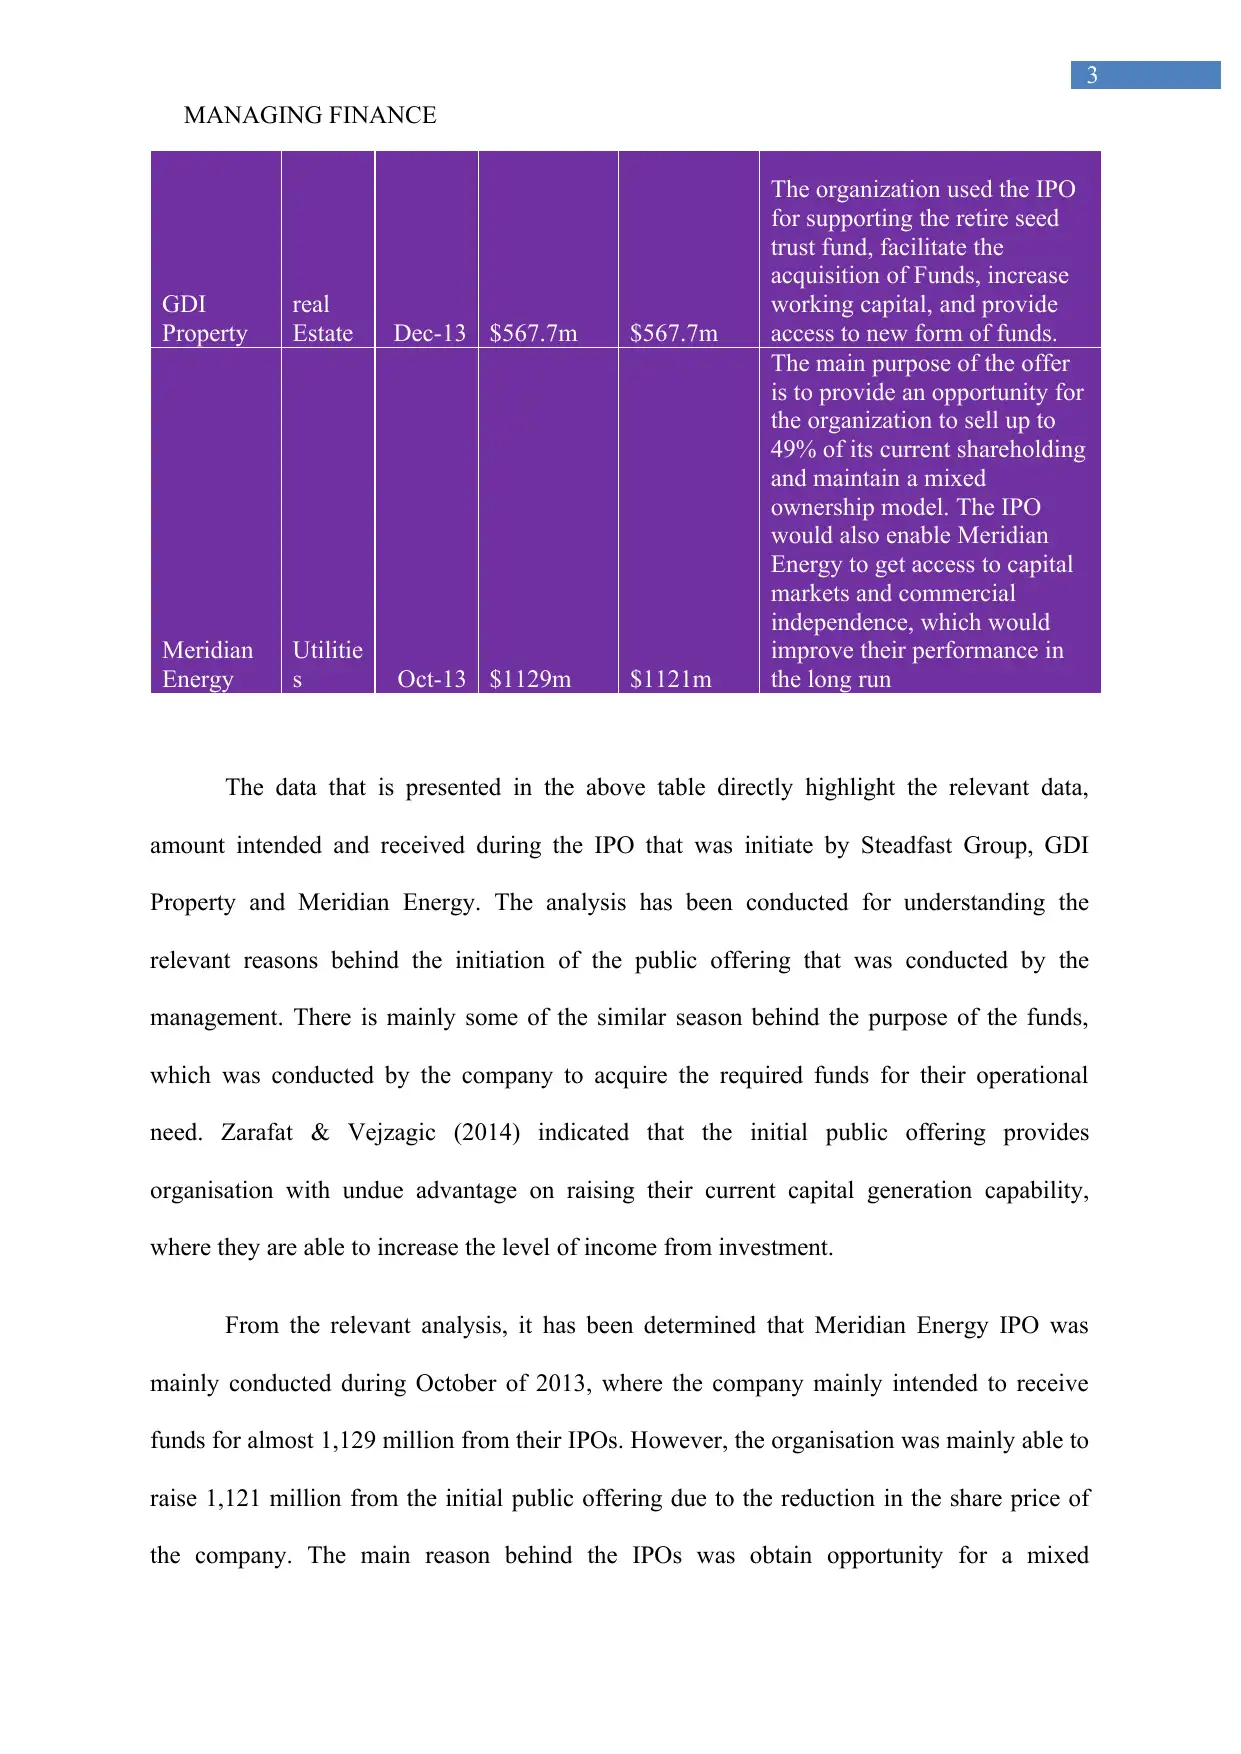
The data that is presented in the above table directly highlight the relevant data,
amount intended and received during the IPO that was initiate by Steadfast Group, GDI
Property and Meridian Energy. The analysis has been conducted for understanding the
relevant reasons behind the initiation of the public offering that was conducted by the
management. There is mainly some of the similar season behind the purpose of the funds,
which was conducted by the company to acquire the required funds for their operational
need. Zarafat & Vejzagic (2014) indicated that the initial public offering provides
organisation with undue advantage on raising their current capital generation capability,
where they are able to increase the level of income from investment.
From the relevant analysis, it has been determined that Meridian Energy IPO was
mainly conducted during October of 2013, where the company mainly intended to receive
funds for almost 1,129 million from their IPOs. However, the organisation was mainly able to
raise 1,121 million from the initial public offering due to the reduction in the share price of
the company. The main reason behind the IPOs was obtain opportunity for a mixed
3
GDI
Property
real
Estate Dec-13 $567.7m $567.7m
The organization used the IPO
for supporting the retire seed
trust fund, facilitate the
acquisition of Funds, increase
working capital, and provide
access to new form of funds.
Meridian
Energy
Utilitie
s Oct-13 $1129m $1121m
The main purpose of the offer
is to provide an opportunity for
the organization to sell up to
49% of its current shareholding
and maintain a mixed
ownership model. The IPO
would also enable Meridian
Energy to get access to capital
markets and commercial
independence, which would
improve their performance in
the long run
The data that is presented in the above table directly highlight the relevant data,
amount intended and received during the IPO that was initiate by Steadfast Group, GDI
Property and Meridian Energy. The analysis has been conducted for understanding the
relevant reasons behind the initiation of the public offering that was conducted by the
management. There is mainly some of the similar season behind the purpose of the funds,
which was conducted by the company to acquire the required funds for their operational
need. Zarafat & Vejzagic (2014) indicated that the initial public offering provides
organisation with undue advantage on raising their current capital generation capability,
where they are able to increase the level of income from investment.
From the relevant analysis, it has been determined that Meridian Energy IPO was
mainly conducted during October of 2013, where the company mainly intended to receive
funds for almost 1,129 million from their IPOs. However, the organisation was mainly able to
raise 1,121 million from the initial public offering due to the reduction in the share price of
the company. The main reason behind the IPOs was obtain opportunity for a mixed
MANAGING FINANCE
4
ownership model and get access to capital markets and commercial independence. This
would eventually allow the management to support their relevant investment decisions after
getting the required level of funds to conduct relevant operations (Asx.com.au, 2019).
Moreover, the IPO of GDI Property was mainly conducting for supporting the retire
seed trust, which was initiated by the company. In addition, the process that was held by the
organisation directly allowed the management to acquire $567.7 million from the share issue,
which helped in fulling the main purpose for the initiation of the IPO. The analysis has
mainly indicated that the organisation intended to utilise the IPO funds for conducting
relevant acquisitions, increase working capital and provide relevant access to new form of
funds to the management. This would benefit the management of GDI Property, where they
could increase the level of benefits, which can be generated from an investment (Asx.com.au,
2019).
The initial public offerings that were conducted by Steadfast Group also have the
same intentions, where the organisation was intending to get relevant access to the liquid
market for its shares. In addition, the management was relevantly intended to support
acquisitions, enhance financial flexibility, and get relevant access to the capital markets.
Moreover, the funds acquired in the IPO would also be used in to repay for the existing jobs
that was being conducted in the company. The organisation acquired a sum of 333.3 million
for the IPO issue, which was taken into consideration for generating high level of income
from investment (Investor.steadfast.com.au, 2019).
Steadfast Group 2014
Growth rate 12.0%
Share price at
close
1.33155
Paid dividends 0.0386
Cost of equity 14.9%
⊘ This is a preview!⊘
Do you want full access?
Subscribe today to unlock all pages.
Trusted by 1+ million students worldwide
MANAGING FINANCE
5
GDI Property 2014
Growth rate 10.0%
Share price at
close
0.89
Paid dividends 0.04
Cost of equity 13.93%
Meridian Energy 2014
Growth rate 11.0%
Share price at
close
1.445
Paid dividends 0.099
Cost of equity 17.9%
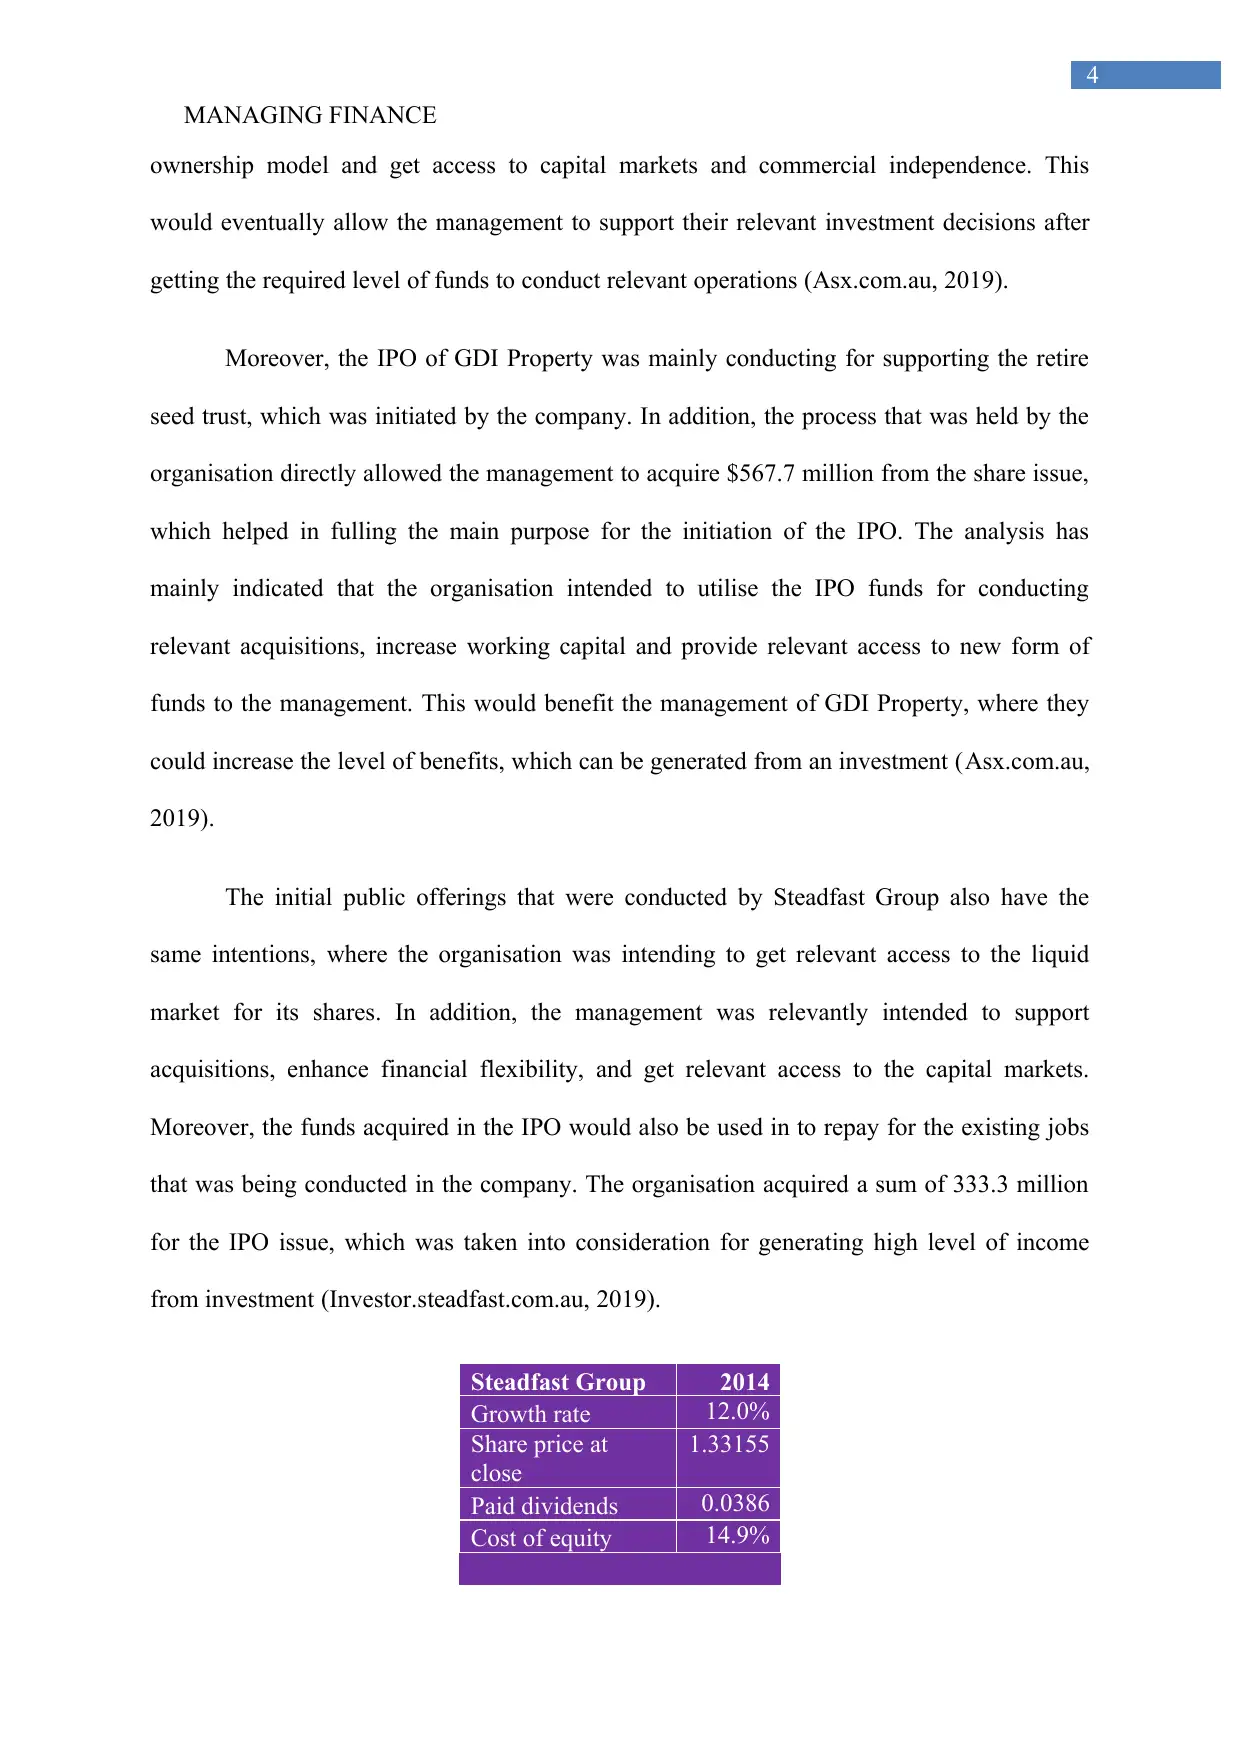
The above table indicates about the relevant levels of cost of equity that was
conducted for the organisation after the on year of the IPO. The information mainly states
that the overall IPO of the company indicates about the change in share price condition.
Before the IPOs the company overall cost of equity is mainly zero, as there is no information,
which can be used for determining the values. However, after the IPO the cost of equity for
each company has mainly changed to new values, which needs to be taken into consideration
by the organisation before selecting investment options. The cost of equity for Steadfast
Group is at 14.9%, while for GDI Property is at 13.93% and for Meridian Energy is at 17.9%.
Perera (2014) stated that cost of equity is considered to be one of the viable investment
options, which can allow the organisation to detect the significance of relevant investments.
2. Understanding the presence of under-pricing with the IPOs:
Company Steadfast Group GDI Property Meridian Energy
Industry Insurance real Estate Utilities
Date of IPO 8/1/2013 12/1/2013 10/1/2013
Amount Raised $333.7m $567.7m $1129m
Offer price $333.7m $567.7m $1121m
Offer price 1.2 1 1.8
First day of trading (Closing
price) 1.37 0.89 0.872
5
GDI Property 2014
Growth rate 10.0%
Share price at
close
0.89
Paid dividends 0.04
Cost of equity 13.93%
Meridian Energy 2014
Growth rate 11.0%
Share price at
close
1.445
Paid dividends 0.099
Cost of equity 17.9%
The above table indicates about the relevant levels of cost of equity that was
conducted for the organisation after the on year of the IPO. The information mainly states
that the overall IPO of the company indicates about the change in share price condition.
Before the IPOs the company overall cost of equity is mainly zero, as there is no information,
which can be used for determining the values. However, after the IPO the cost of equity for
each company has mainly changed to new values, which needs to be taken into consideration
by the organisation before selecting investment options. The cost of equity for Steadfast
Group is at 14.9%, while for GDI Property is at 13.93% and for Meridian Energy is at 17.9%.
Perera (2014) stated that cost of equity is considered to be one of the viable investment
options, which can allow the organisation to detect the significance of relevant investments.
2. Understanding the presence of under-pricing with the IPOs:
Company Steadfast Group GDI Property Meridian Energy
Industry Insurance real Estate Utilities
Date of IPO 8/1/2013 12/1/2013 10/1/2013
Amount Raised $333.7m $567.7m $1129m
Offer price $333.7m $567.7m $1121m
Offer price 1.2 1 1.8
First day of trading (Closing
price) 1.37 0.89 0.872
Paraphrase This Document
Need a fresh take? Get an instant paraphrase of this document with our AI Paraphraser
MANAGING FINANCE
6
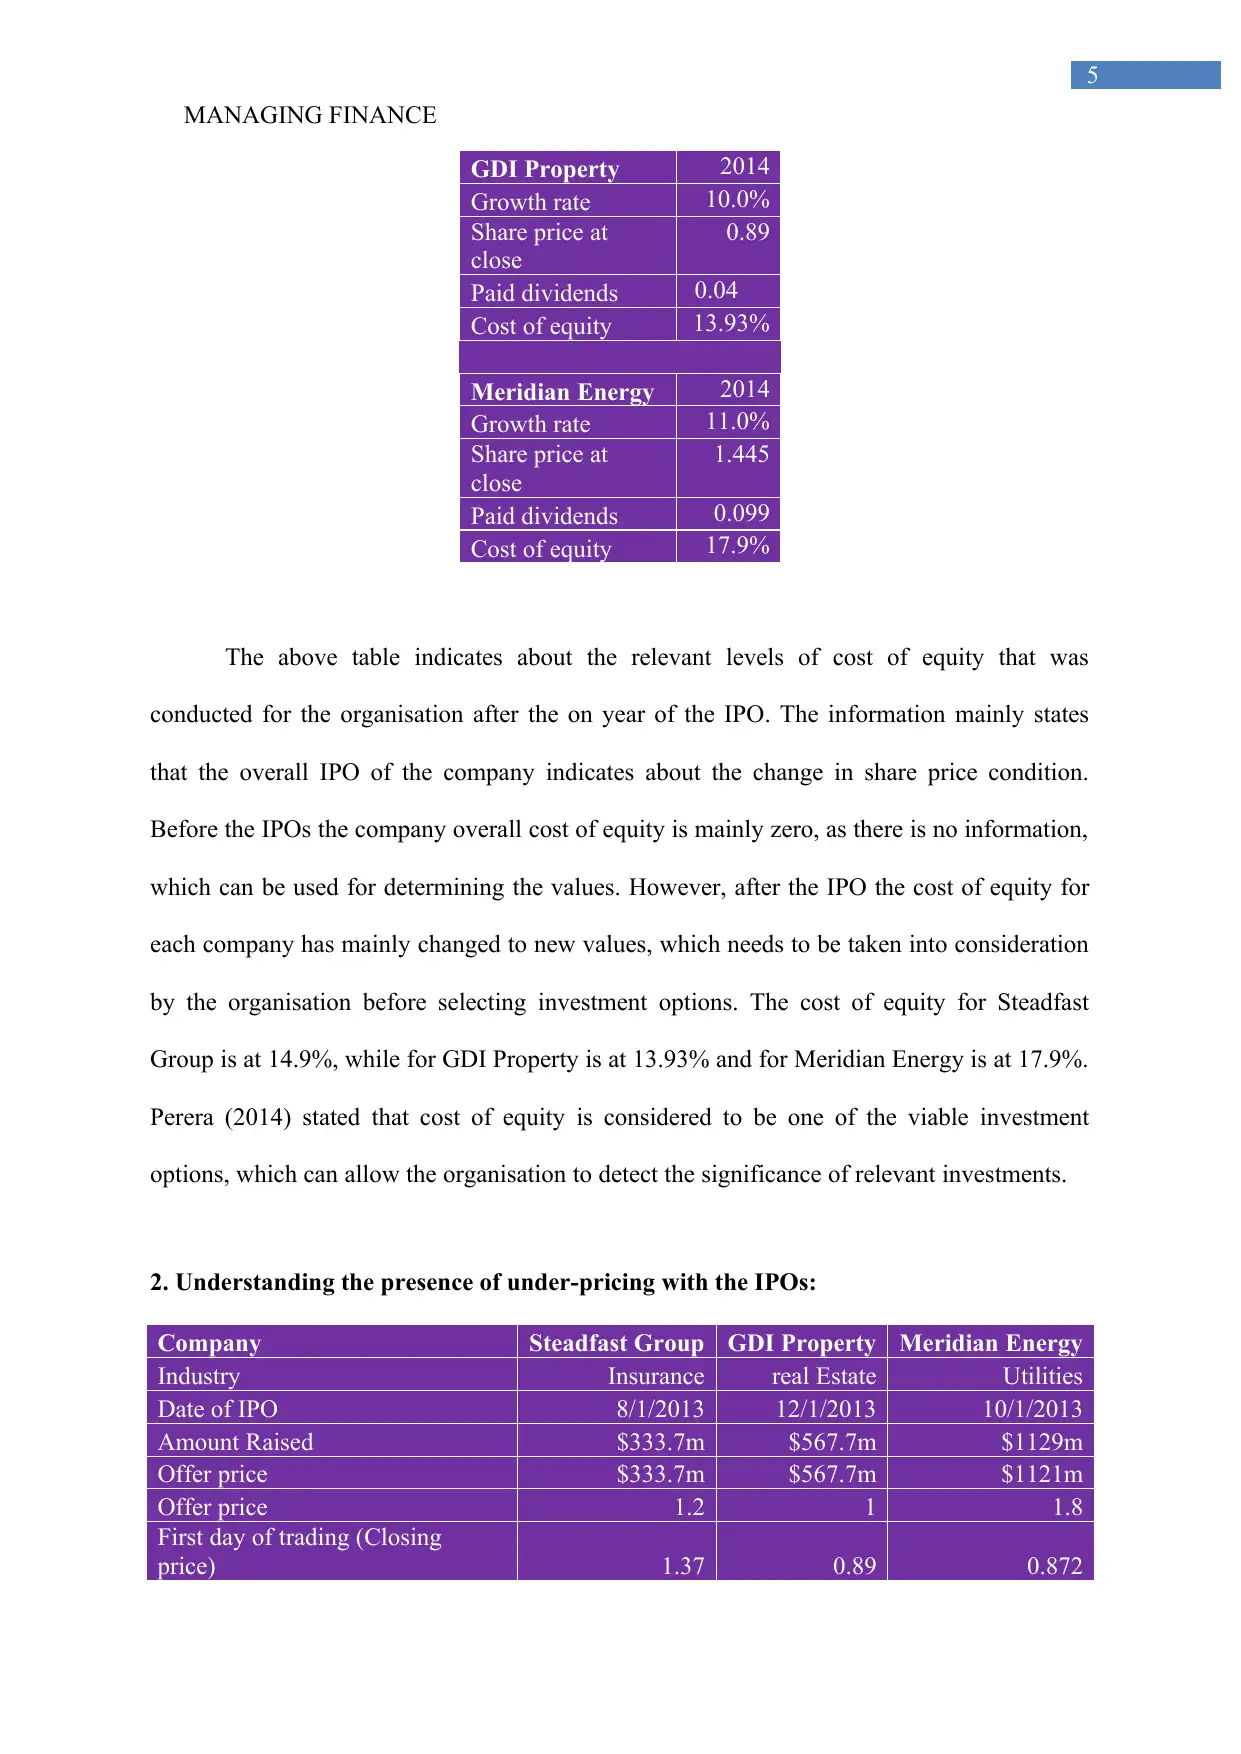
First day of trading (Return) 14.17% -11.00% -51.56%
The information indicates that the overall return on the first day of trading for each
IPO that is conducted in the above table. From the relevant analysis, it can be determined that
Steadfast Group has the highest level of returns for the first day of trade, where both GDI
Property and Meridian Energy has conducted losses during the initial trading day. The
difference in the overall returns that was provided during the first day of trade directly
indicates about the presence of underpricing which is conducted to reduce the share price and
improve the level of returns that could be generated by an investor. From the analysis, it can
be determined that maximum of the IPO that is conducted in Australia and around the world
are infected by the underpricing methods that is imposed by the investors to increase their
returns from the initial investment. This type of improvements is also approved by
organizations to readily fulfill their overall share price issue and gather the required level of
funds for their operations. From the study conducted in United States and Australia it was
discovered that 70% of the IPOs that was conducted in USA were underpriced in all sectors.
On the other hand, Australia had only 65% of their IPOs underpriced (Lowry, Michaely &
Volkova, 2017).
3. Determining the IPO activity with the Market conditions of Australia:
Yea
r Number of IPO ALL Ordinary Index Return
2007 260 6417 Activity of IPO ALL Ordinary Index
2008 75 3659 -71% -43%
2009 42 4883 -44% 33%
2010 99 4847 136% -1%
2011 105 4111 6% -15%
2012 51 4665 -51% 13%
2013 61 5353 20% 15%
2014 73 5389 20% 1%
2015 97 5345 33% -1%
6
First day of trading (Return) 14.17% -11.00% -51.56%
The information indicates that the overall return on the first day of trading for each
IPO that is conducted in the above table. From the relevant analysis, it can be determined that
Steadfast Group has the highest level of returns for the first day of trade, where both GDI
Property and Meridian Energy has conducted losses during the initial trading day. The
difference in the overall returns that was provided during the first day of trade directly
indicates about the presence of underpricing which is conducted to reduce the share price and
improve the level of returns that could be generated by an investor. From the analysis, it can
be determined that maximum of the IPO that is conducted in Australia and around the world
are infected by the underpricing methods that is imposed by the investors to increase their
returns from the initial investment. This type of improvements is also approved by
organizations to readily fulfill their overall share price issue and gather the required level of
funds for their operations. From the study conducted in United States and Australia it was
discovered that 70% of the IPOs that was conducted in USA were underpriced in all sectors.
On the other hand, Australia had only 65% of their IPOs underpriced (Lowry, Michaely &
Volkova, 2017).
3. Determining the IPO activity with the Market conditions of Australia:
Yea
r Number of IPO ALL Ordinary Index Return
2007 260 6417 Activity of IPO ALL Ordinary Index
2008 75 3659 -71% -43%
2009 42 4883 -44% 33%
2010 99 4847 136% -1%
2011 105 4111 6% -15%
2012 51 4665 -51% 13%
2013 61 5353 20% 15%
2014 73 5389 20% 1%
2015 97 5345 33% -1%
MANAGING FINANCE
7
2016 94 5719 -3% 7%
2017 115 6167 22% 8%
2008 2009 2010 2011 2012 2013 2014 2015 2016 2017
-100%
-50%
0%
50%
100%
150%
-71%
-44%
136%
6%
-51%
20% 20% 33%
-3%
22%
-43%
33%
-1%
-15%
13% 15% 1% -1% 7% 8%
Activity of IPO
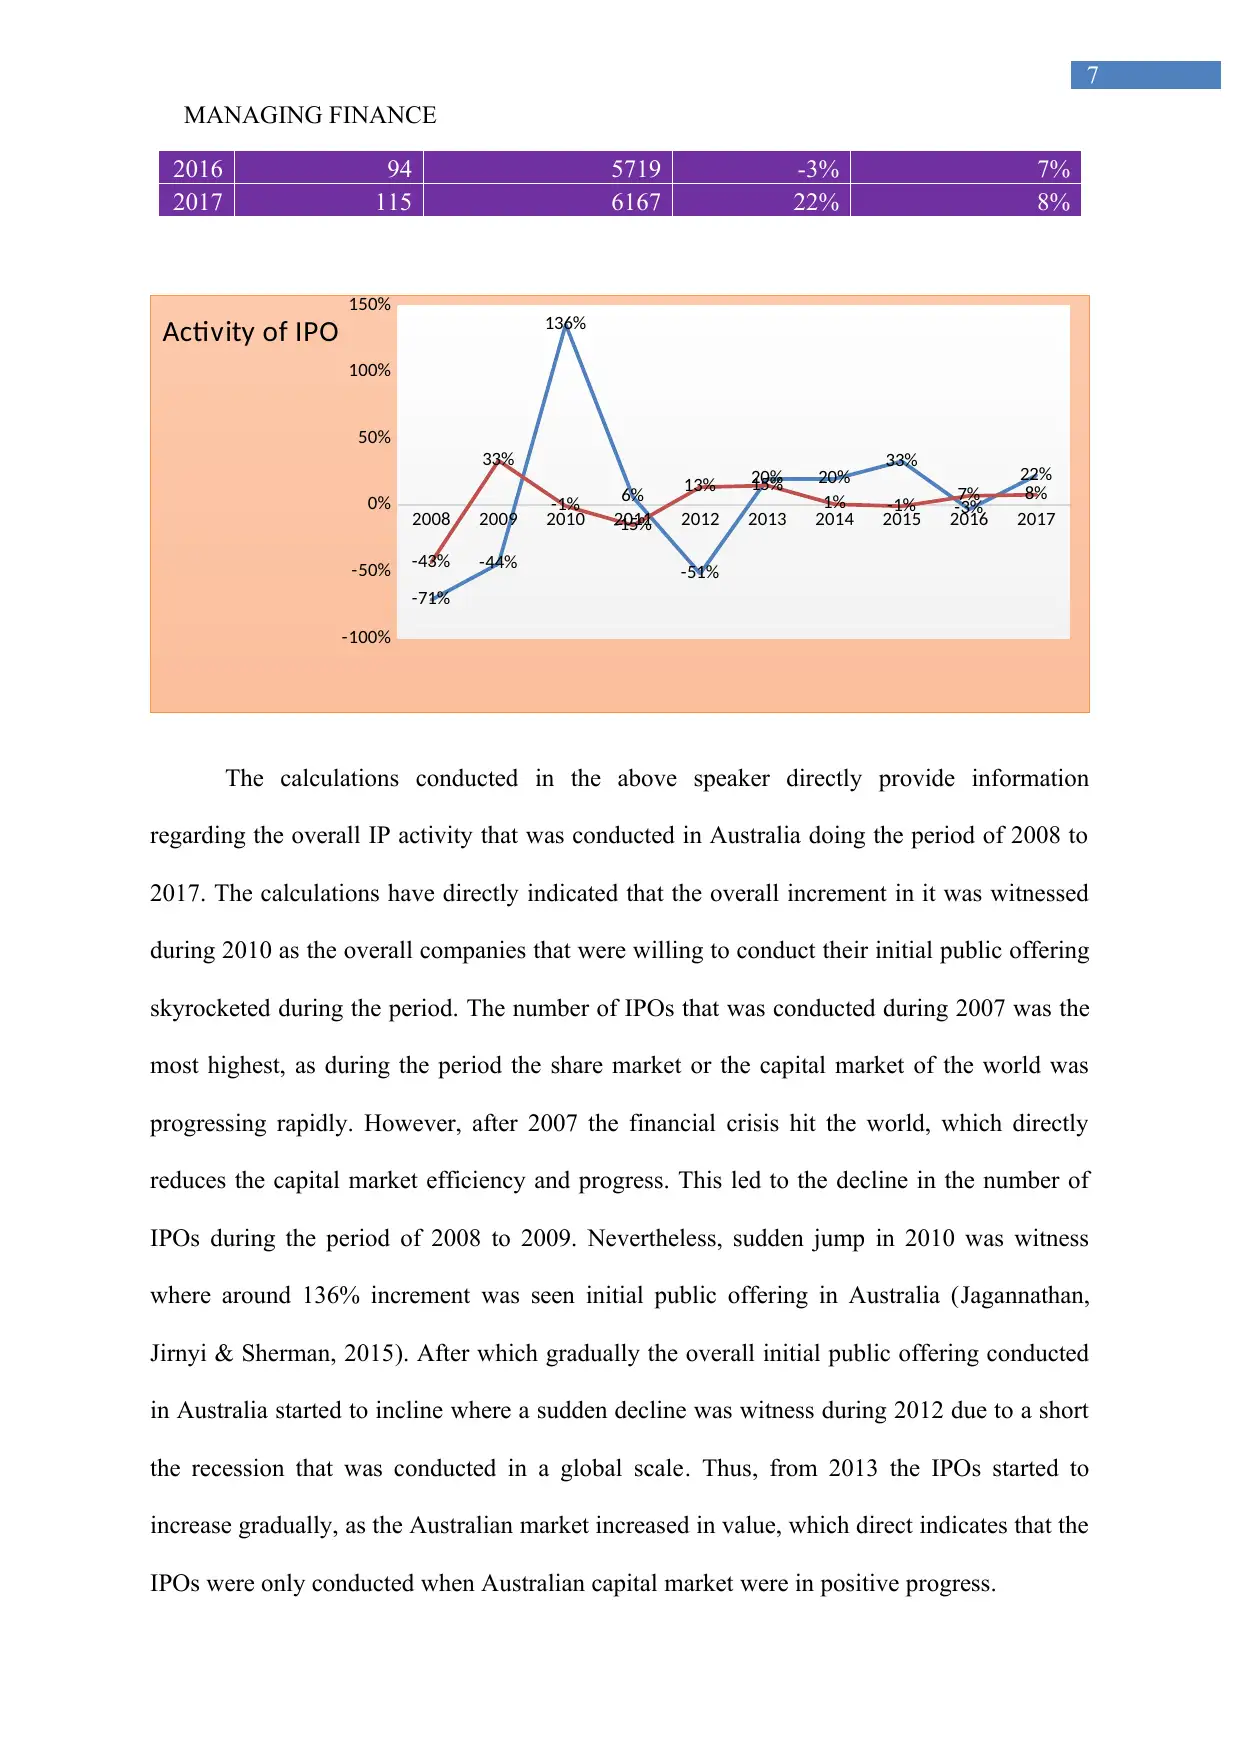
The calculations conducted in the above speaker directly provide information
regarding the overall IP activity that was conducted in Australia doing the period of 2008 to
2017. The calculations have directly indicated that the overall increment in it was witnessed
during 2010 as the overall companies that were willing to conduct their initial public offering
skyrocketed during the period. The number of IPOs that was conducted during 2007 was the
most highest, as during the period the share market or the capital market of the world was
progressing rapidly. However, after 2007 the financial crisis hit the world, which directly
reduces the capital market efficiency and progress. This led to the decline in the number of
IPOs during the period of 2008 to 2009. Nevertheless, sudden jump in 2010 was witness
where around 136% increment was seen initial public offering in Australia (Jagannathan,
Jirnyi & Sherman, 2015). After which gradually the overall initial public offering conducted
in Australia started to incline where a sudden decline was witness during 2012 due to a short
the recession that was conducted in a global scale. Thus, from 2013 the IPOs started to
increase gradually, as the Australian market increased in value, which direct indicates that the
IPOs were only conducted when Australian capital market were in positive progress.
7
2016 94 5719 -3% 7%
2017 115 6167 22% 8%
2008 2009 2010 2011 2012 2013 2014 2015 2016 2017
-100%
-50%
0%
50%
100%
150%
-71%
-44%
136%
6%
-51%
20% 20% 33%
-3%
22%
-43%
33%
-1%
-15%
13% 15% 1% -1% 7% 8%
Activity of IPO
The calculations conducted in the above speaker directly provide information
regarding the overall IP activity that was conducted in Australia doing the period of 2008 to
2017. The calculations have directly indicated that the overall increment in it was witnessed
during 2010 as the overall companies that were willing to conduct their initial public offering
skyrocketed during the period. The number of IPOs that was conducted during 2007 was the
most highest, as during the period the share market or the capital market of the world was
progressing rapidly. However, after 2007 the financial crisis hit the world, which directly
reduces the capital market efficiency and progress. This led to the decline in the number of
IPOs during the period of 2008 to 2009. Nevertheless, sudden jump in 2010 was witness
where around 136% increment was seen initial public offering in Australia (Jagannathan,
Jirnyi & Sherman, 2015). After which gradually the overall initial public offering conducted
in Australia started to incline where a sudden decline was witness during 2012 due to a short
the recession that was conducted in a global scale. Thus, from 2013 the IPOs started to
increase gradually, as the Australian market increased in value, which direct indicates that the
IPOs were only conducted when Australian capital market were in positive progress.
⊘ This is a preview!⊘
Do you want full access?
Subscribe today to unlock all pages.
Trusted by 1+ million students worldwide
MANAGING FINANCE
8
4. The performance within three years after the IPO without dividends:
11/1/2013
1/1/2014
3/1/2014
5/1/2014
7/1/2014
9/1/2014
11/1/2014
1/1/2015
3/1/2015
5/1/2015
7/1/2015
9/1/2015
11/1/2015
1/1/2016
3/1/2016
5/1/2016
7/1/2016
9/1/2016
11/1/2016
-25.00%
-20.00%
-15.00%
-10.00%
-5.00%
0.00%
5.00%
10.00%
15.00%
20.00%
25.00%
Return without dividends
All Ordinary Index Steadfast Group GDI Property Meridian Energy
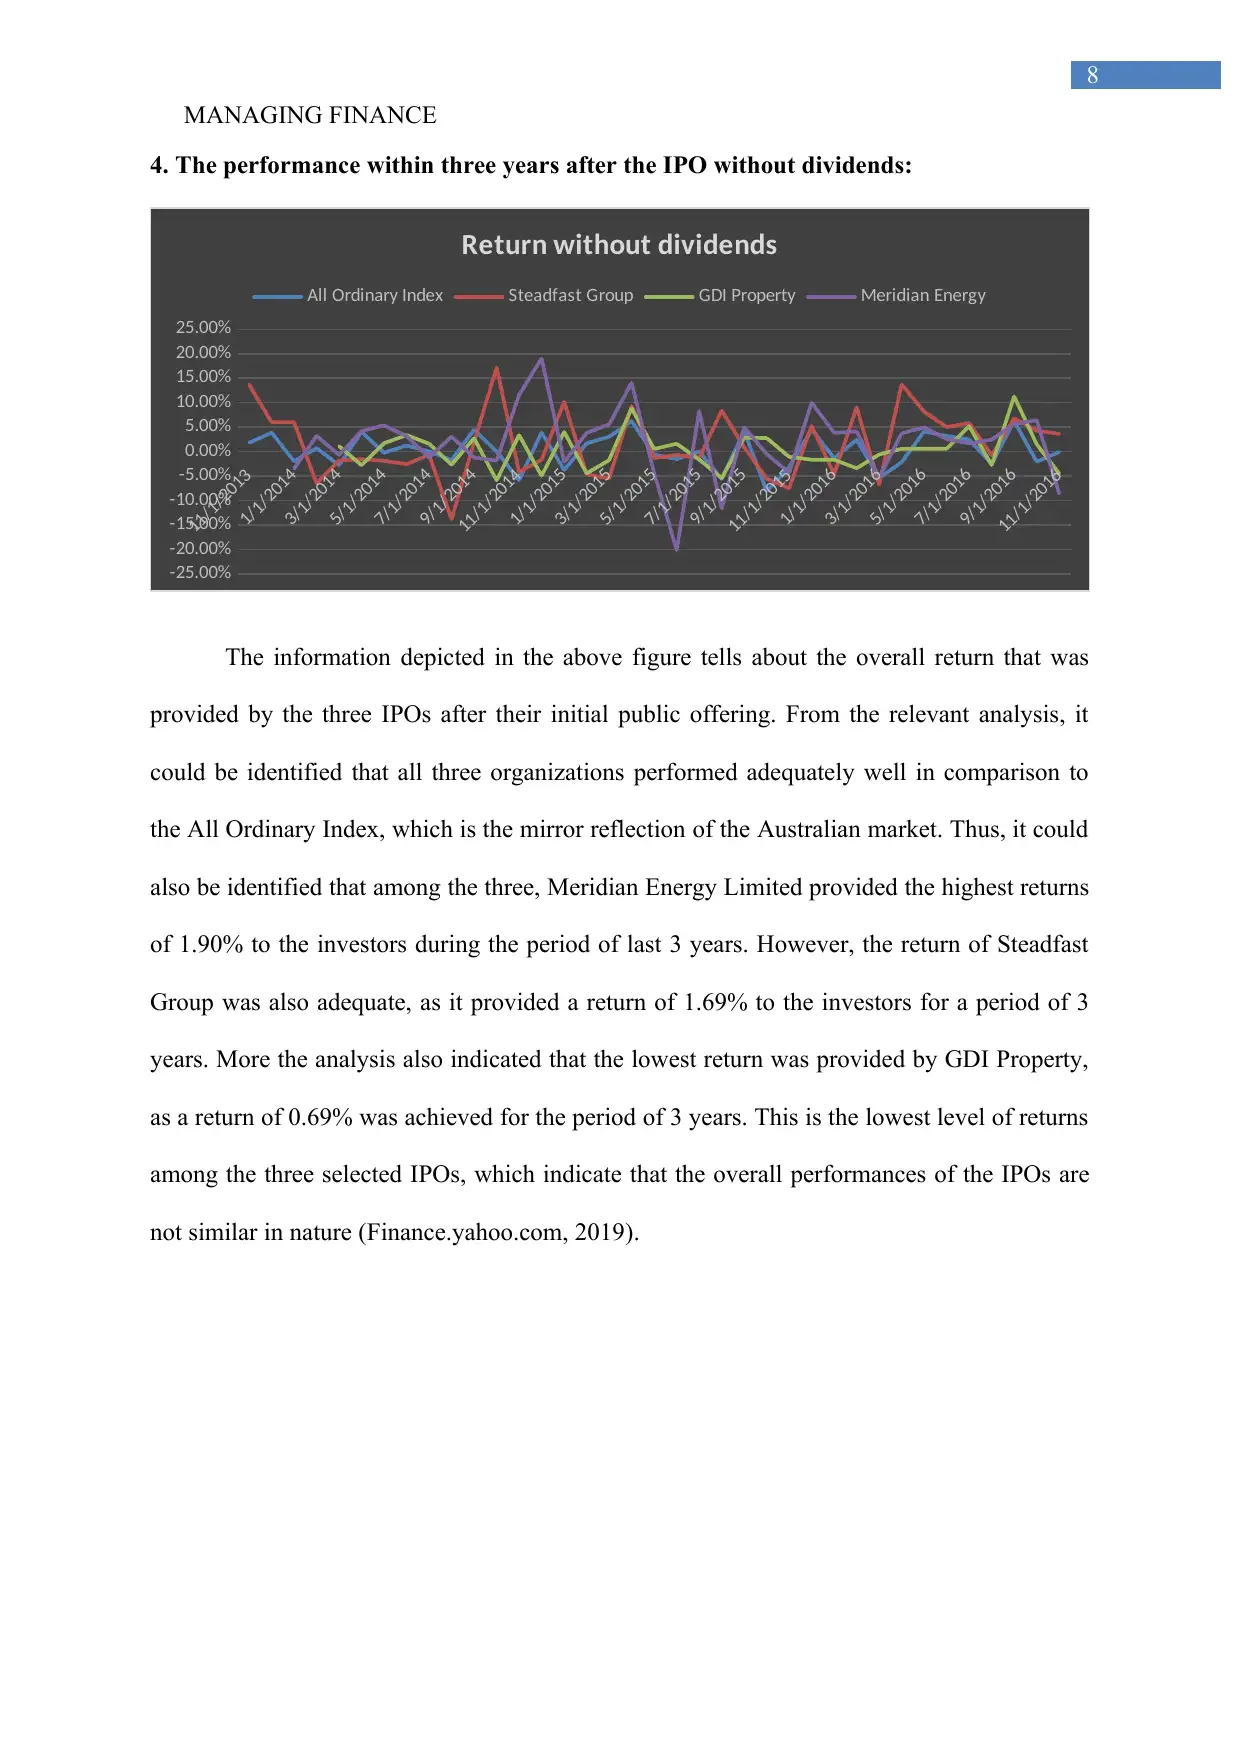
The information depicted in the above figure tells about the overall return that was
provided by the three IPOs after their initial public offering. From the relevant analysis, it
could be identified that all three organizations performed adequately well in comparison to
the All Ordinary Index, which is the mirror reflection of the Australian market. Thus, it could
also be identified that among the three, Meridian Energy Limited provided the highest returns
of 1.90% to the investors during the period of last 3 years. However, the return of Steadfast
Group was also adequate, as it provided a return of 1.69% to the investors for a period of 3
years. More the analysis also indicated that the lowest return was provided by GDI Property,
as a return of 0.69% was achieved for the period of 3 years. This is the lowest level of returns
among the three selected IPOs, which indicate that the overall performances of the IPOs are
not similar in nature (Finance.yahoo.com, 2019).
8
4. The performance within three years after the IPO without dividends:
11/1/2013
1/1/2014
3/1/2014
5/1/2014
7/1/2014
9/1/2014
11/1/2014
1/1/2015
3/1/2015
5/1/2015
7/1/2015
9/1/2015
11/1/2015
1/1/2016
3/1/2016
5/1/2016
7/1/2016
9/1/2016
11/1/2016
-25.00%
-20.00%
-15.00%
-10.00%
-5.00%
0.00%
5.00%
10.00%
15.00%
20.00%
25.00%
Return without dividends
All Ordinary Index Steadfast Group GDI Property Meridian Energy
The information depicted in the above figure tells about the overall return that was
provided by the three IPOs after their initial public offering. From the relevant analysis, it
could be identified that all three organizations performed adequately well in comparison to
the All Ordinary Index, which is the mirror reflection of the Australian market. Thus, it could
also be identified that among the three, Meridian Energy Limited provided the highest returns
of 1.90% to the investors during the period of last 3 years. However, the return of Steadfast
Group was also adequate, as it provided a return of 1.69% to the investors for a period of 3
years. More the analysis also indicated that the lowest return was provided by GDI Property,
as a return of 0.69% was achieved for the period of 3 years. This is the lowest level of returns
among the three selected IPOs, which indicate that the overall performances of the IPOs are
not similar in nature (Finance.yahoo.com, 2019).
Paraphrase This Document
Need a fresh take? Get an instant paraphrase of this document with our AI Paraphraser
MANAGING FINANCE
9
5. The performance within three years after the IPO with dividends:
11/1/2013
1/1/2014
3/1/2014
5/1/2014
7/1/2014
9/1/2014
11/1/2014
1/1/2015
3/1/2015
5/1/2015
7/1/2015
9/1/2015
11/1/2015
1/1/2016
3/1/2016
5/1/2016
7/1/2016
9/1/2016
11/1/2016
-25.00%
-20.00%
-15.00%
-10.00%
-5.00%
0.00%
5.00%
10.00%
15.00%
20.00%
25.00%
Return with dividends
Steadfast Group GDI Property Meridian Energy
All Ordinary
Index
Steadfast
Group
GDI
Property
Meridian
Energy
Return with
dividends 0.27% 2.03% 0.92% 2.23%
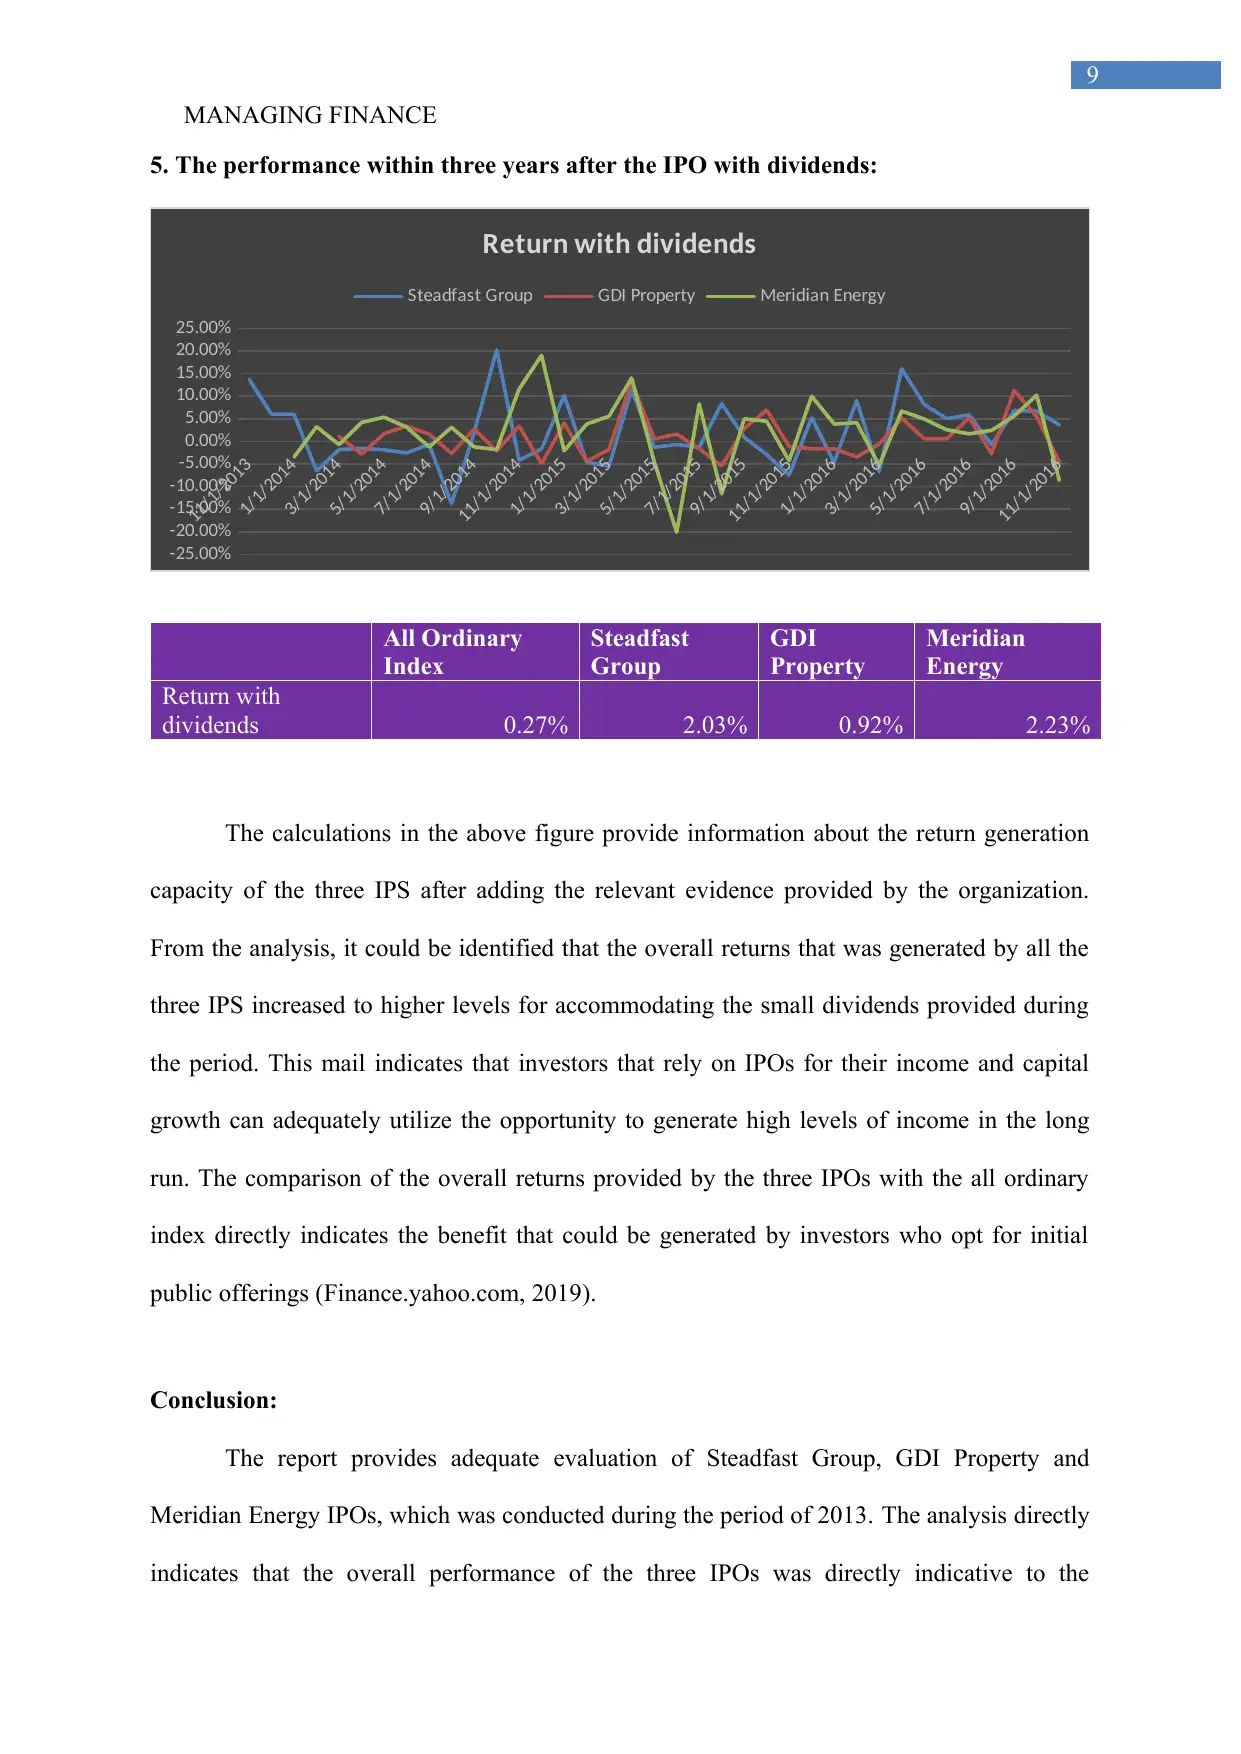
The calculations in the above figure provide information about the return generation
capacity of the three IPS after adding the relevant evidence provided by the organization.
From the analysis, it could be identified that the overall returns that was generated by all the
three IPS increased to higher levels for accommodating the small dividends provided during
the period. This mail indicates that investors that rely on IPOs for their income and capital
growth can adequately utilize the opportunity to generate high levels of income in the long
run. The comparison of the overall returns provided by the three IPOs with the all ordinary
index directly indicates the benefit that could be generated by investors who opt for initial
public offerings (Finance.yahoo.com, 2019).
Conclusion:
The report provides adequate evaluation of Steadfast Group, GDI Property and
Meridian Energy IPOs, which was conducted during the period of 2013. The analysis directly
indicates that the overall performance of the three IPOs was directly indicative to the
9
5. The performance within three years after the IPO with dividends:
11/1/2013
1/1/2014
3/1/2014
5/1/2014
7/1/2014
9/1/2014
11/1/2014
1/1/2015
3/1/2015
5/1/2015
7/1/2015
9/1/2015
11/1/2015
1/1/2016
3/1/2016
5/1/2016
7/1/2016
9/1/2016
11/1/2016
-25.00%
-20.00%
-15.00%
-10.00%
-5.00%
0.00%
5.00%
10.00%
15.00%
20.00%
25.00%
Return with dividends
Steadfast Group GDI Property Meridian Energy
All Ordinary
Index
Steadfast
Group
GDI
Property
Meridian
Energy
Return with
dividends 0.27% 2.03% 0.92% 2.23%
The calculations in the above figure provide information about the return generation
capacity of the three IPS after adding the relevant evidence provided by the organization.
From the analysis, it could be identified that the overall returns that was generated by all the
three IPS increased to higher levels for accommodating the small dividends provided during
the period. This mail indicates that investors that rely on IPOs for their income and capital
growth can adequately utilize the opportunity to generate high levels of income in the long
run. The comparison of the overall returns provided by the three IPOs with the all ordinary
index directly indicates the benefit that could be generated by investors who opt for initial
public offerings (Finance.yahoo.com, 2019).
Conclusion:
The report provides adequate evaluation of Steadfast Group, GDI Property and
Meridian Energy IPOs, which was conducted during the period of 2013. The analysis directly
indicates that the overall performance of the three IPOs was directly indicative to the
MANAGING FINANCE
10
performance of the organization and the attributes of their industry. The companies were able
to generate high level of returns in comparison to the All Ordinary Index, which indicates
about the significance of initial public offerings that could allow investors to increase their
investment scope and return generation capability. The presence of underpricing in IPOs is
also justified, as it benefits both the companies and investors in the long run. Further
evaluation indicated about the relationships that are present between the market performance
and IPO activity in Australia, which is significant.
⊘ This is a preview!⊘
Do you want full access?
Subscribe today to unlock all pages.
Trusted by 1+ million students worldwide
1 out of 14
Related Documents


Your All-in-One AI-Powered Toolkit for Academic Success.
+13062052269
info@desklib.com
Available 24*7 on WhatsApp / Email
![[object Object]](/_next/static/media/star-bottom.7253800d.svg)
Unlock your academic potential
Copyright © 2020–2026 A2Z Services. All Rights Reserved. Developed and managed by ZUCOL.