Finance Report: Australian IPO Performance and Underpricing

Verified

Added on  2021/05/27

|16
|3714
|155
Report
AI Summary
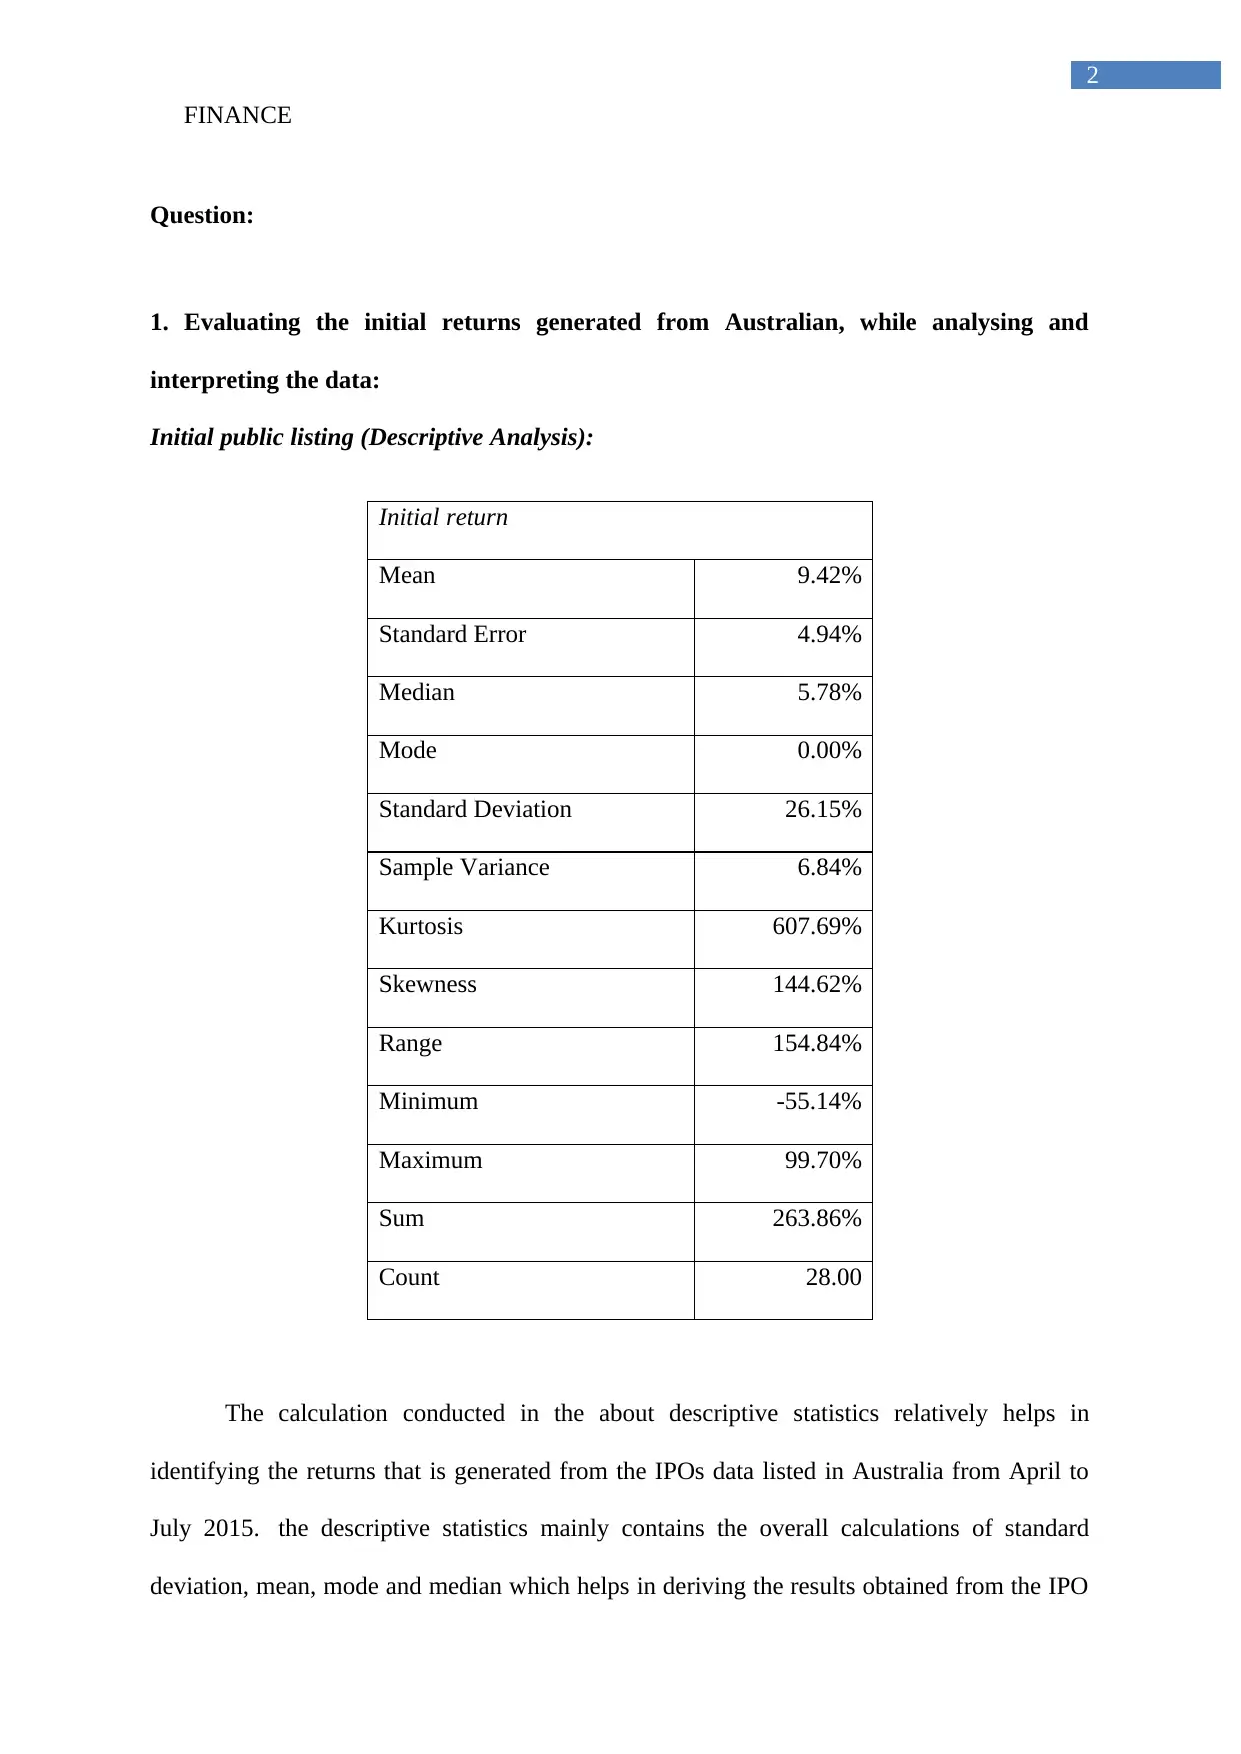
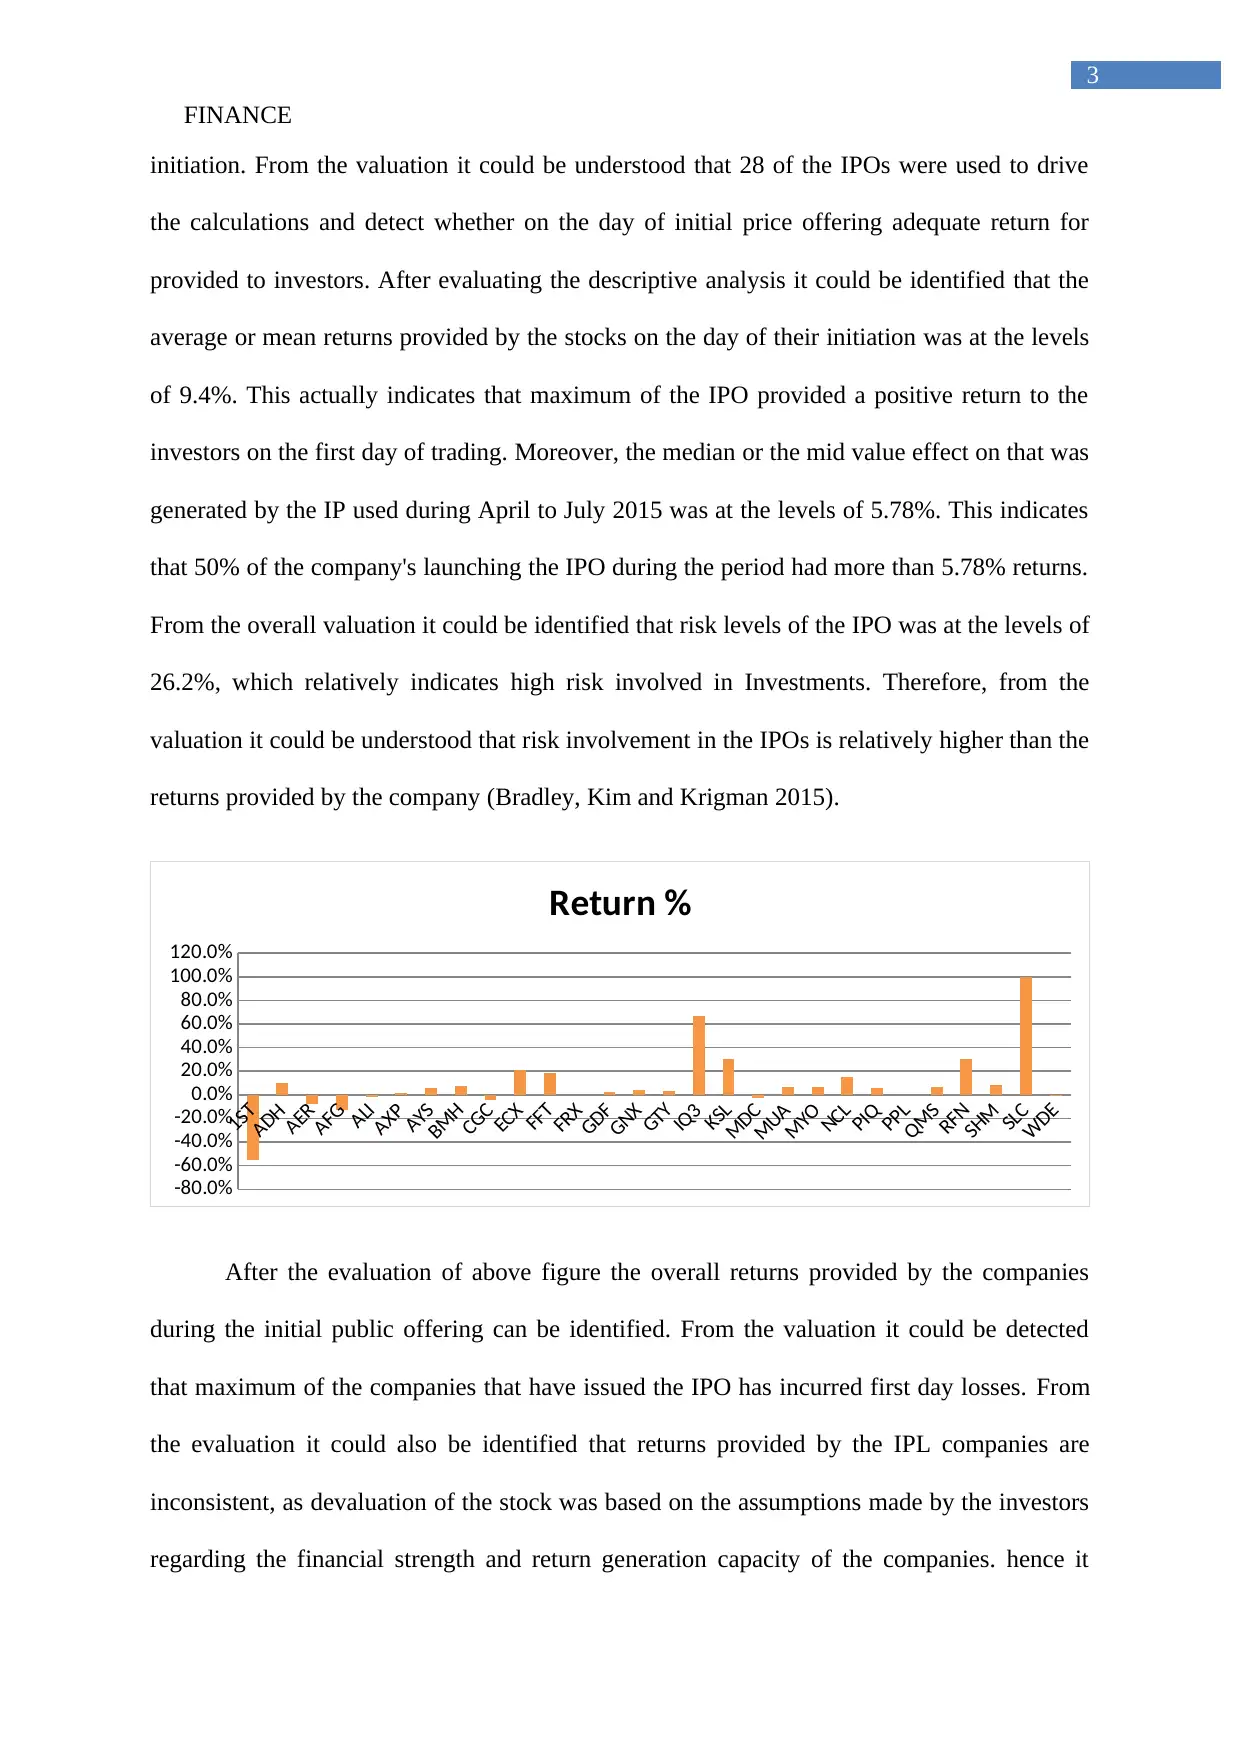
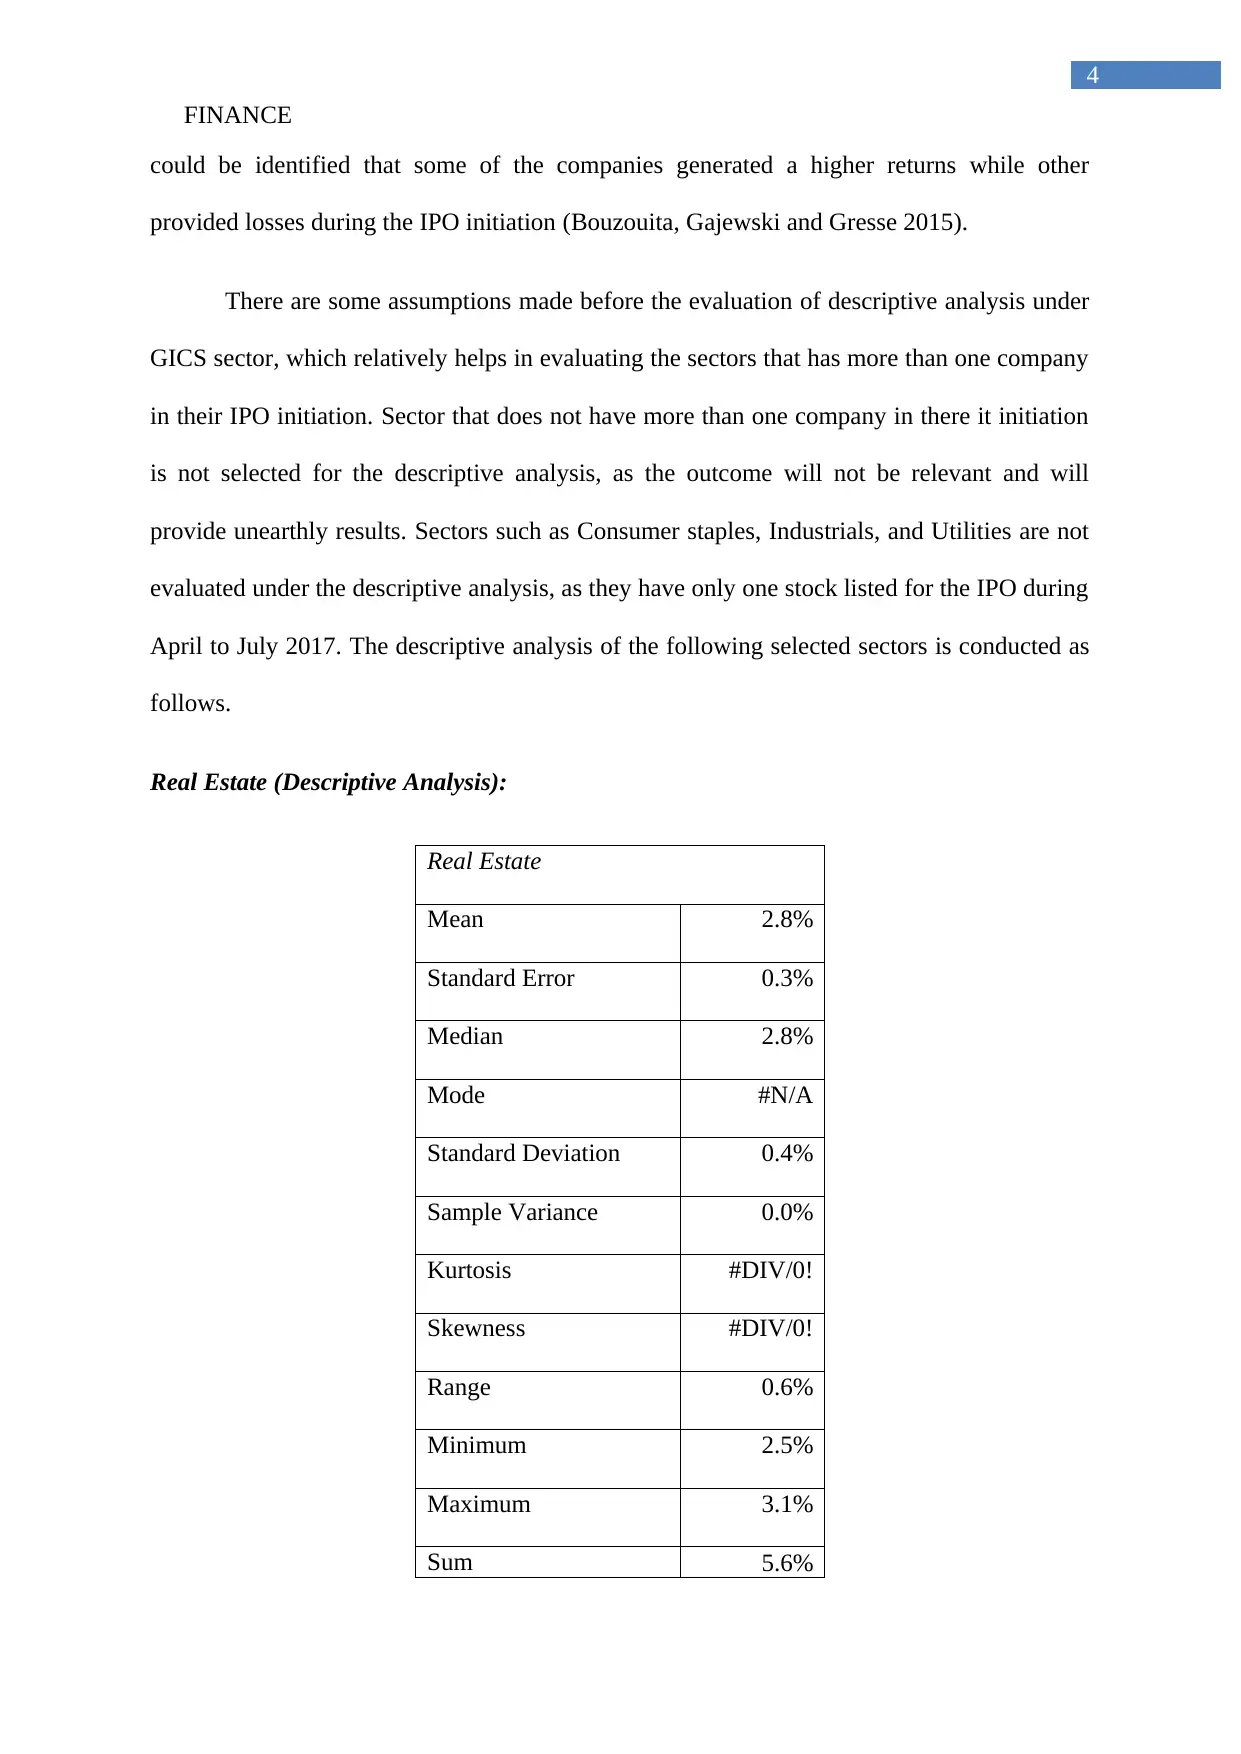
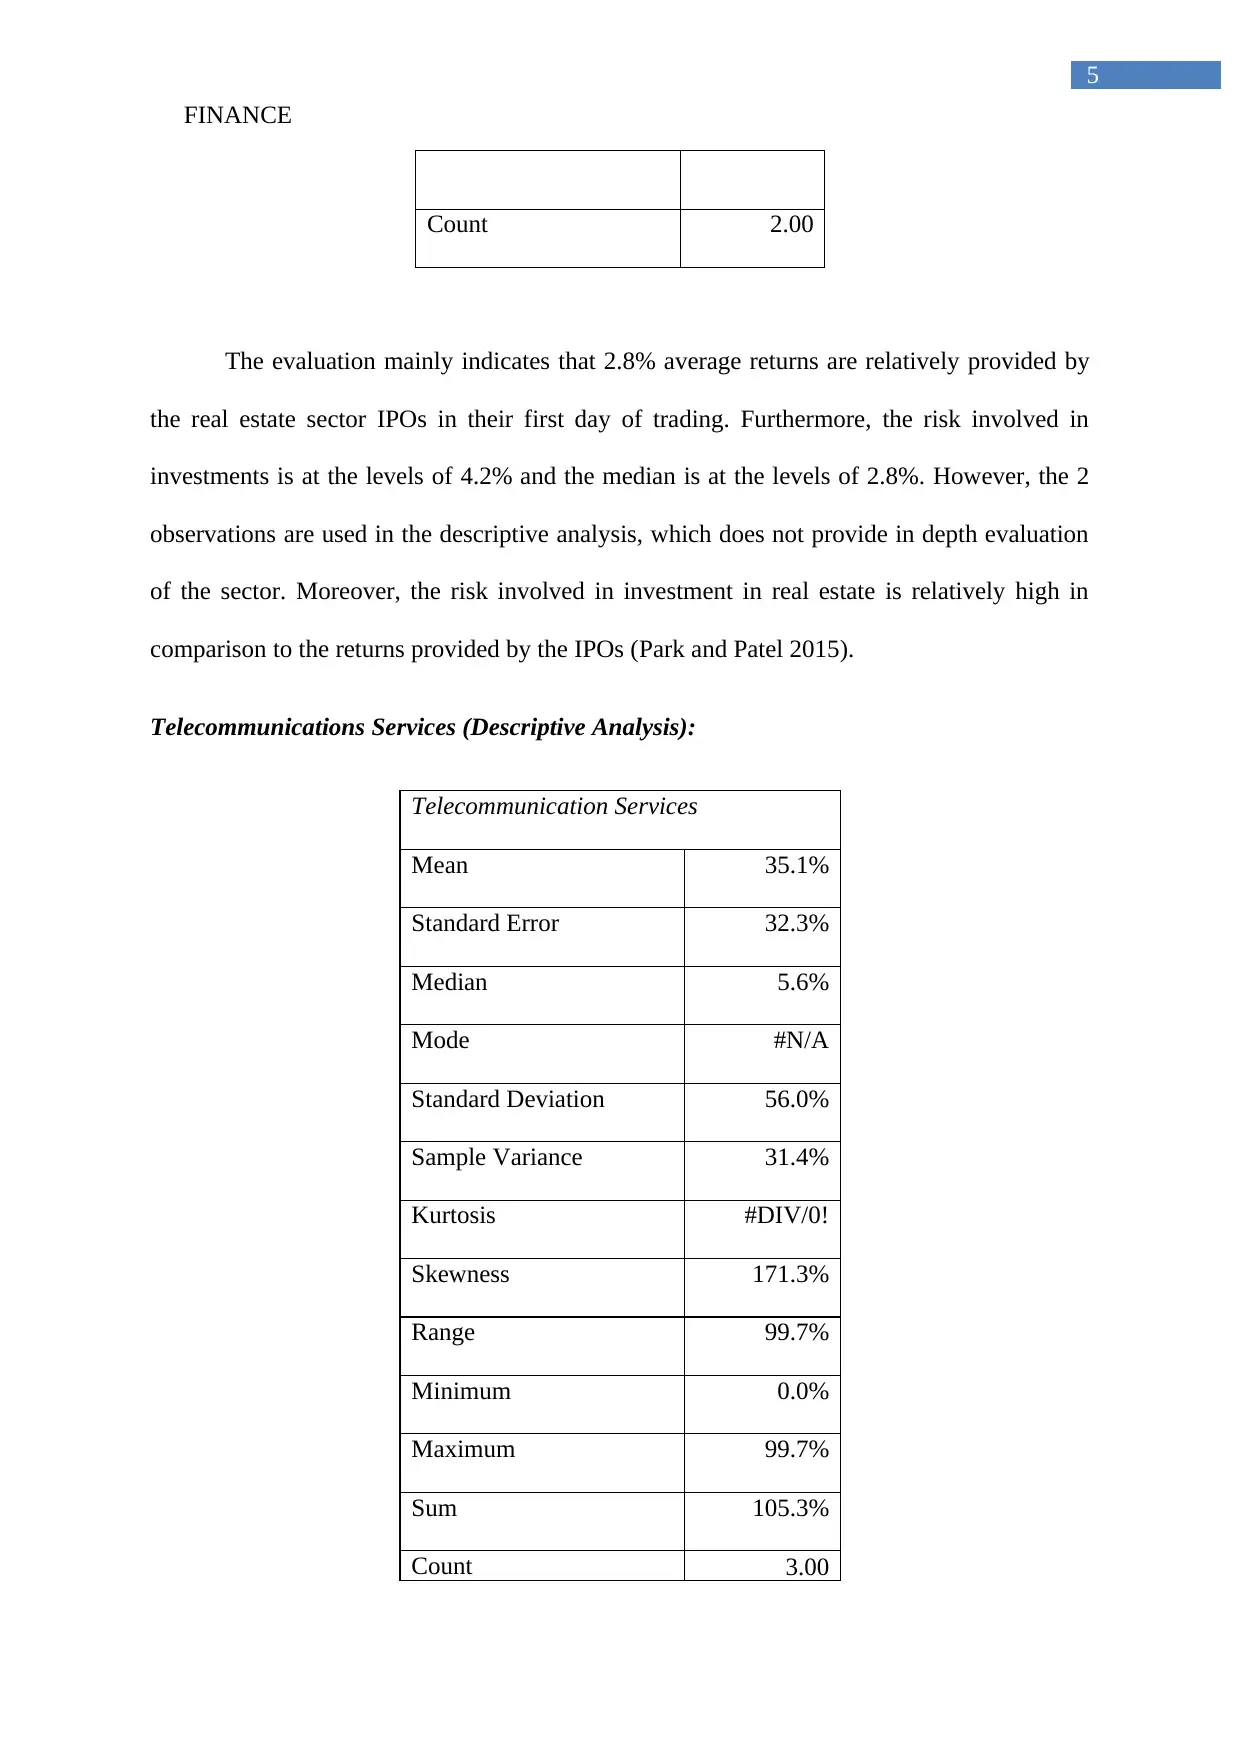
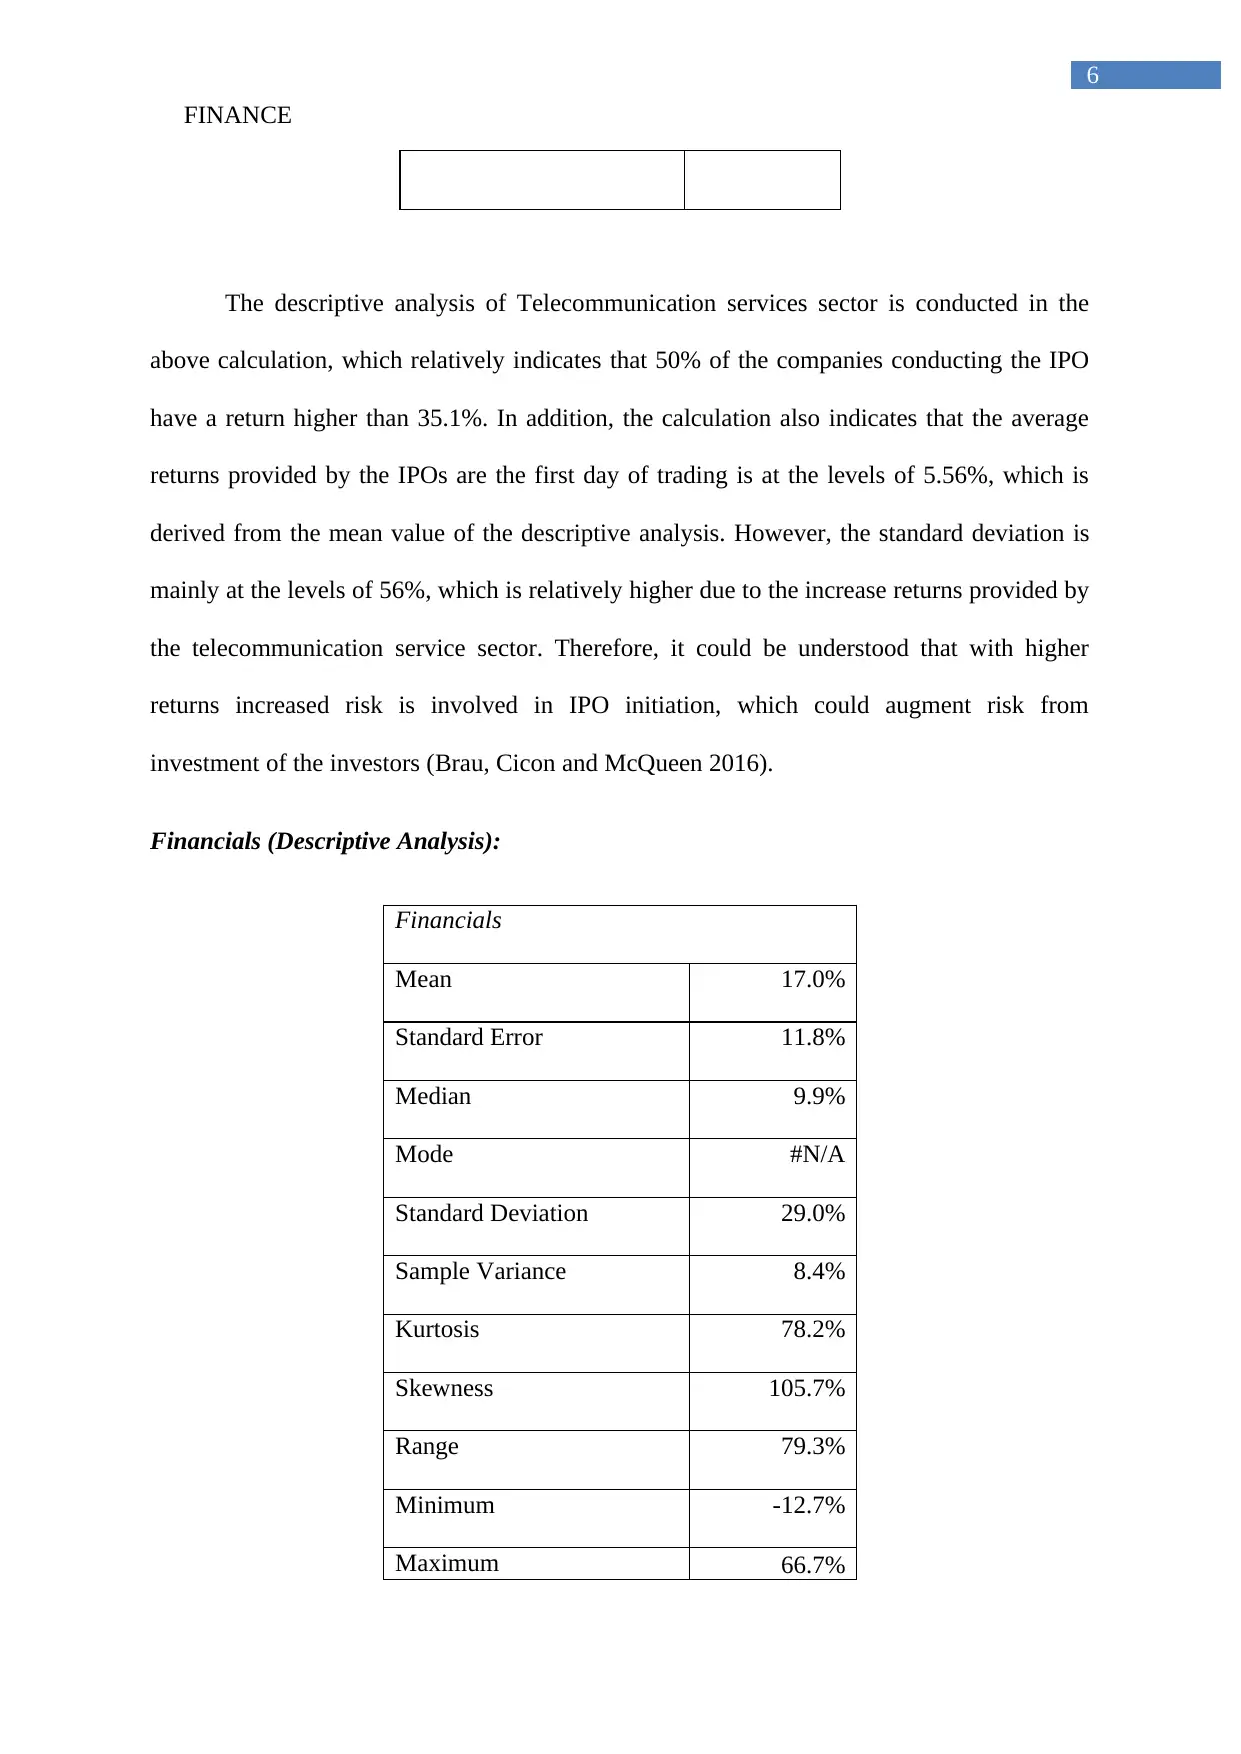
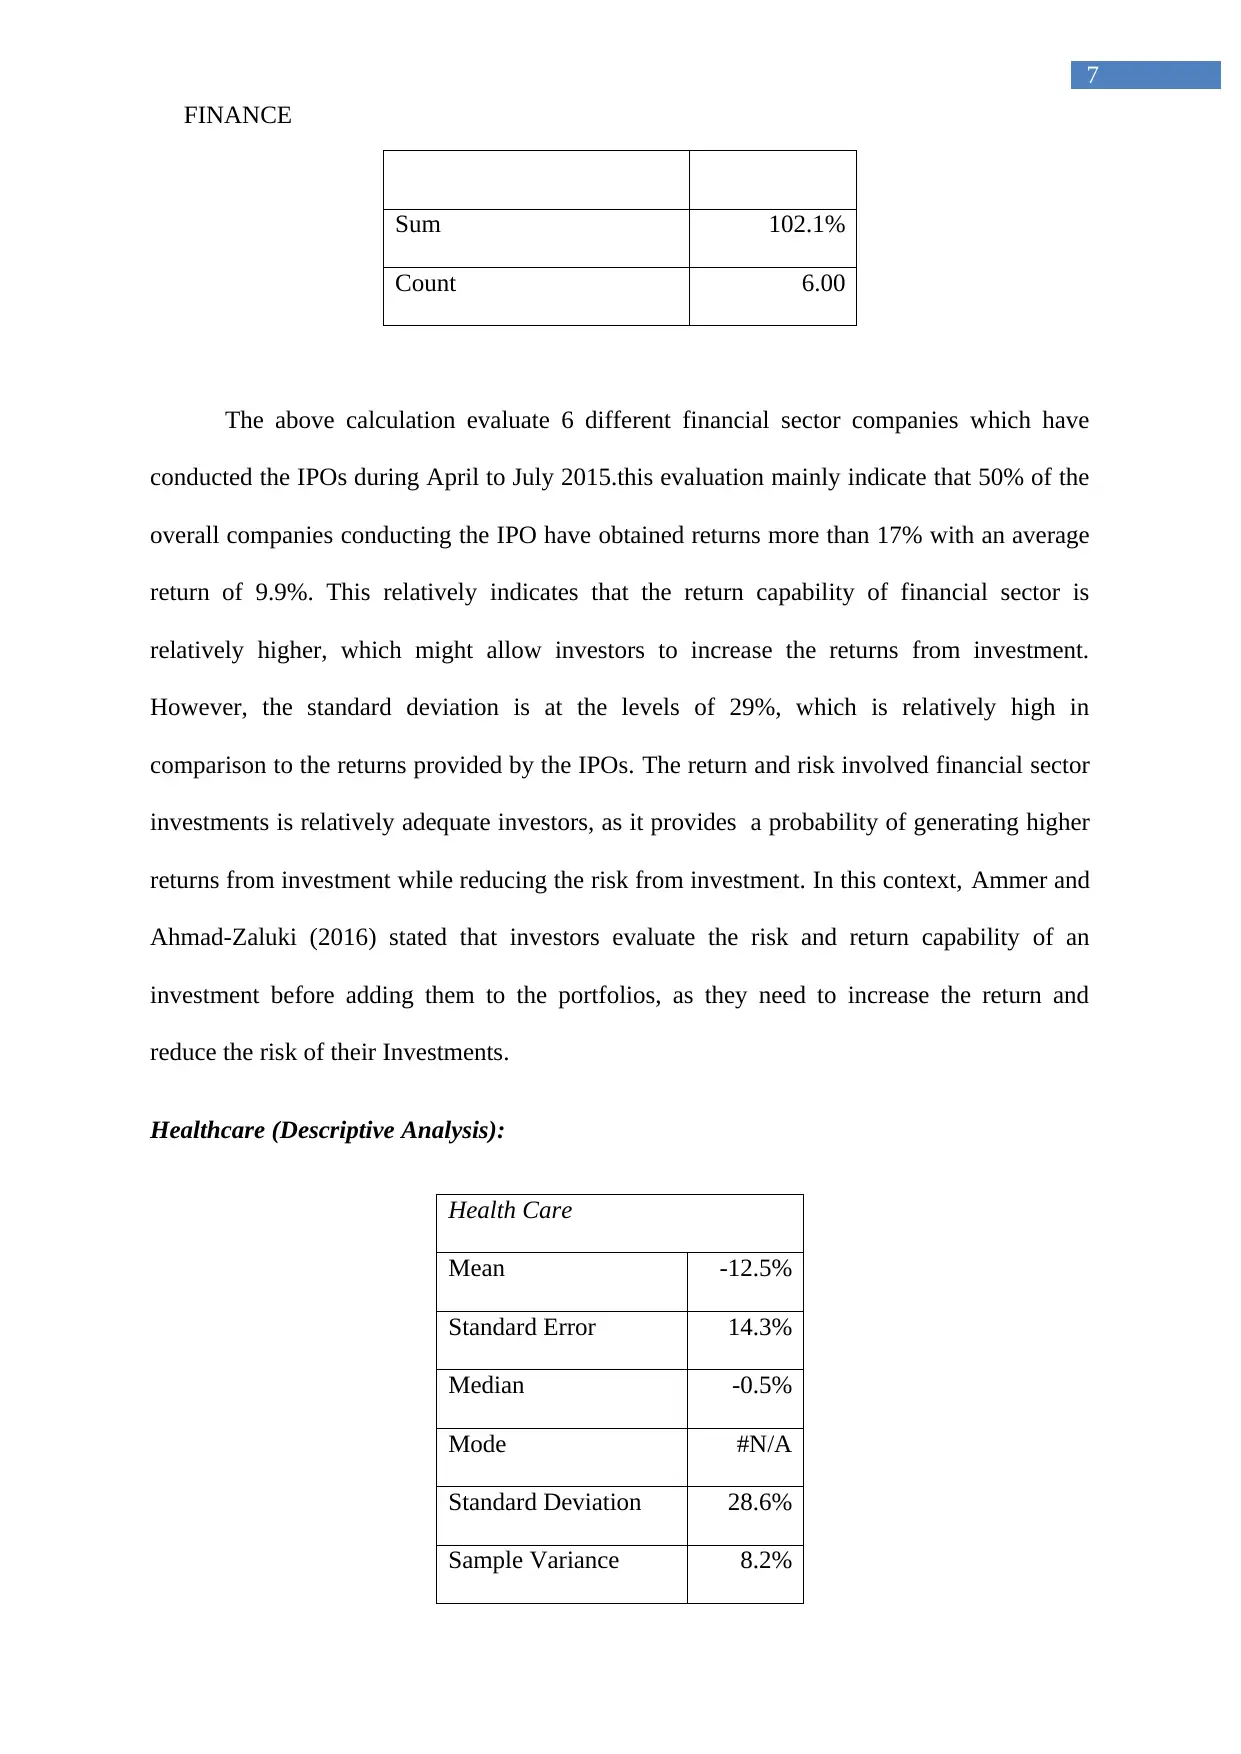
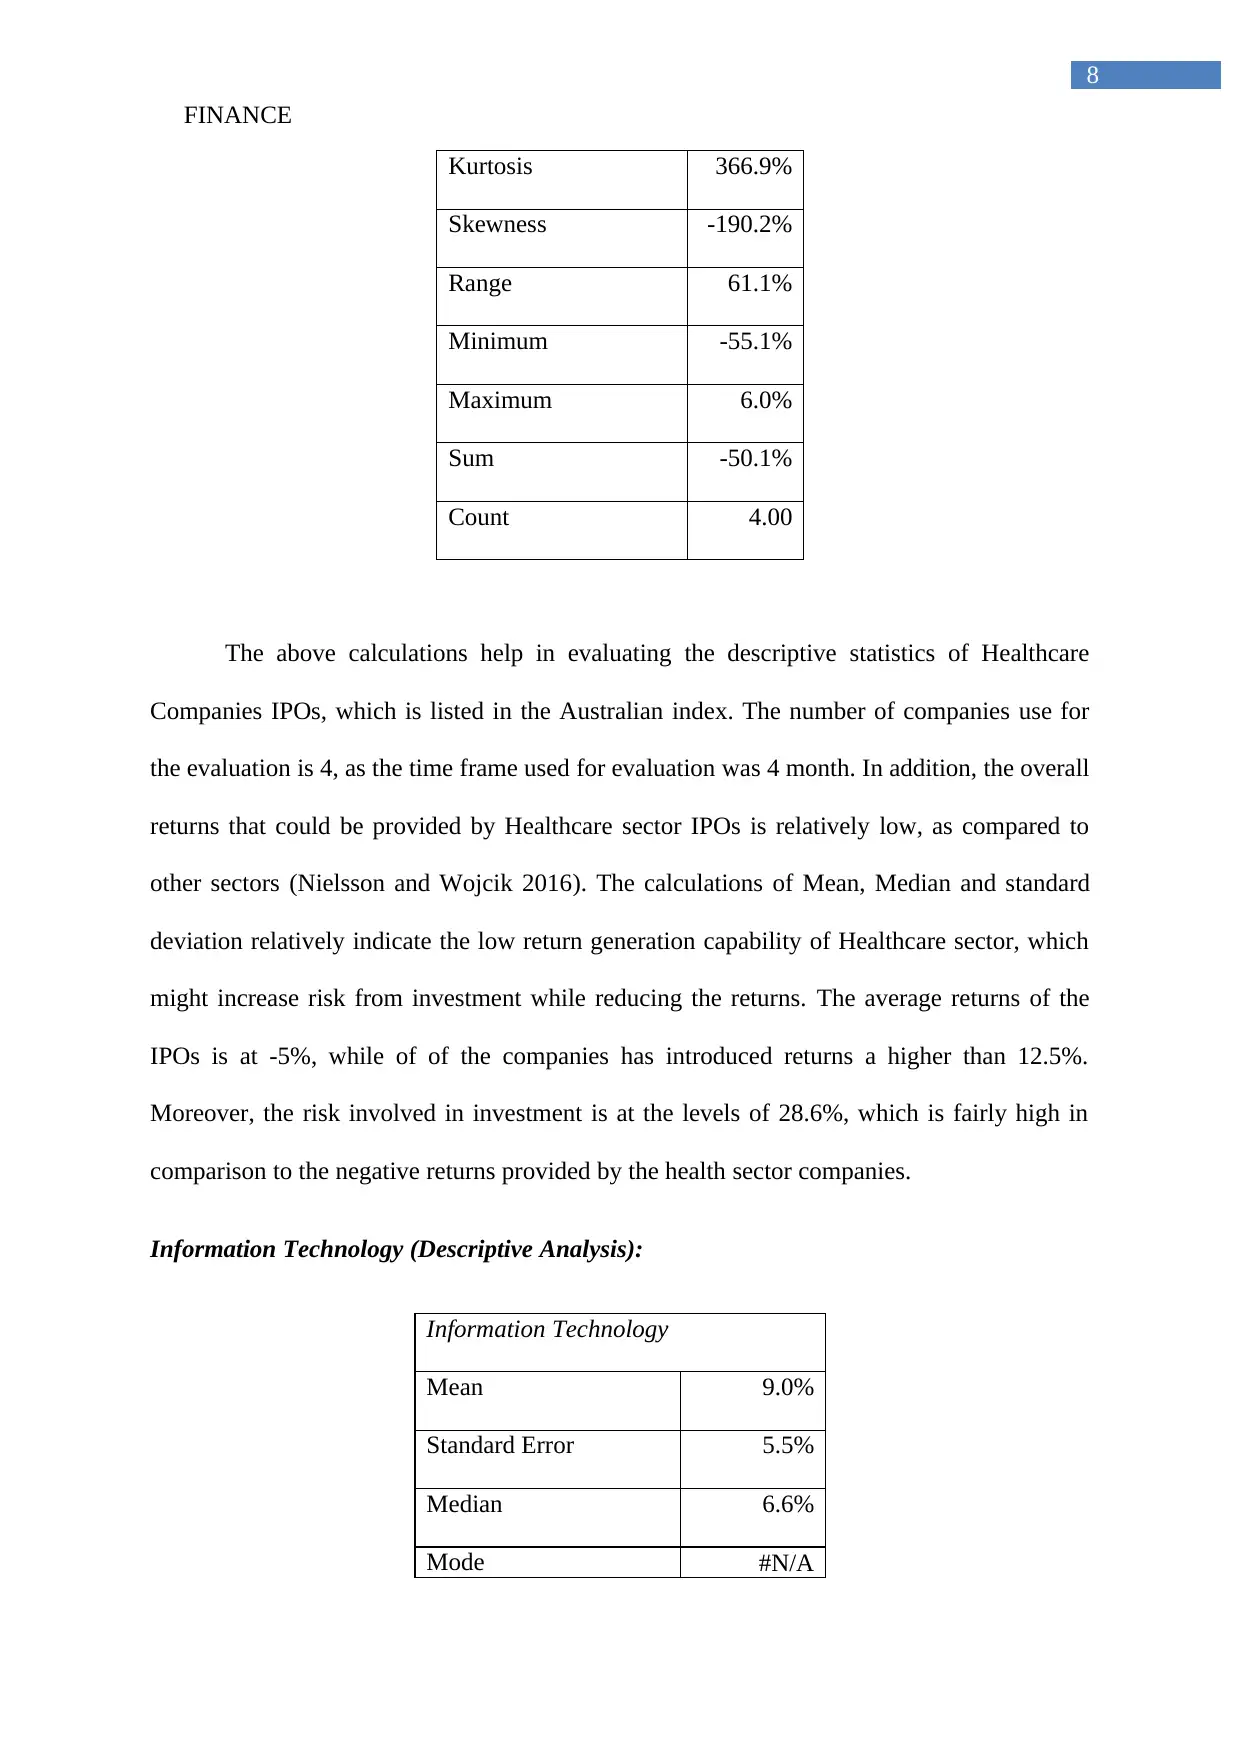
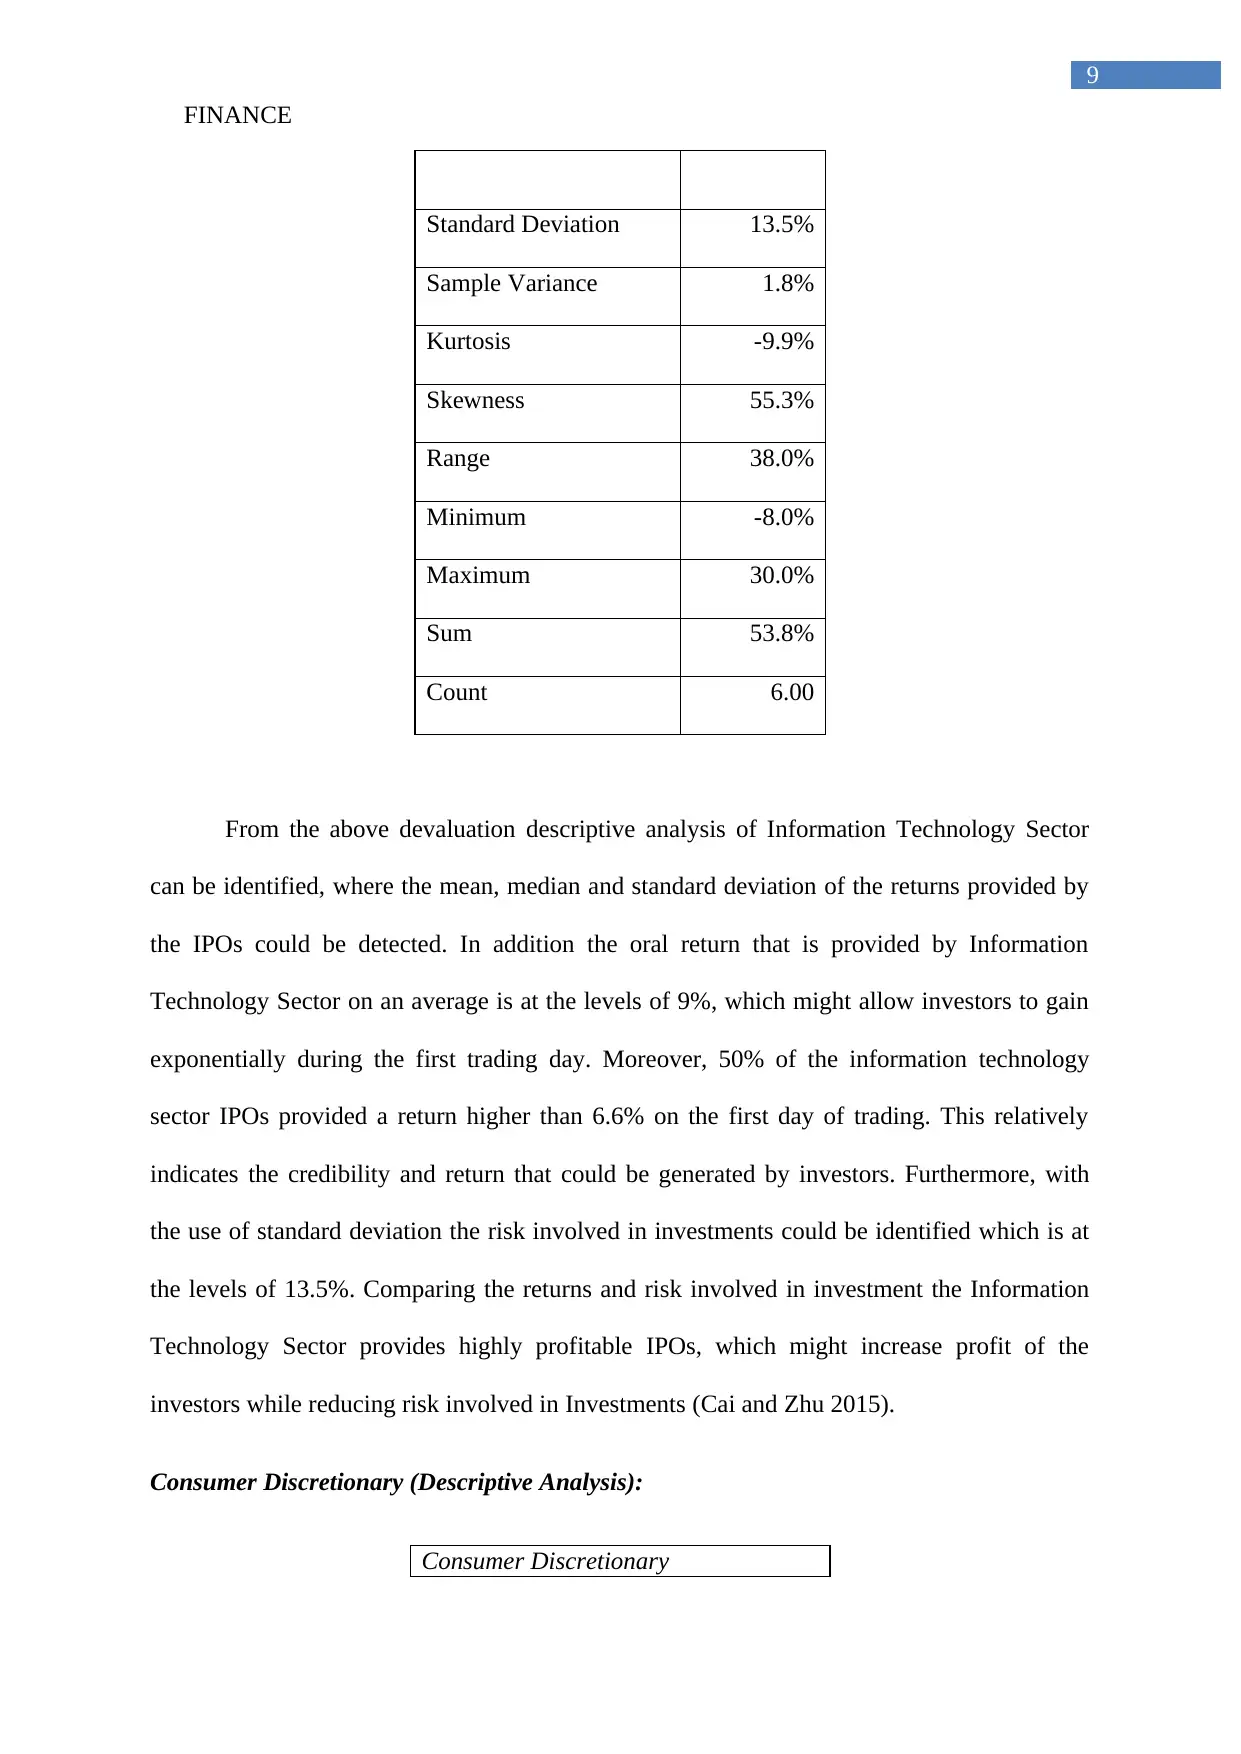
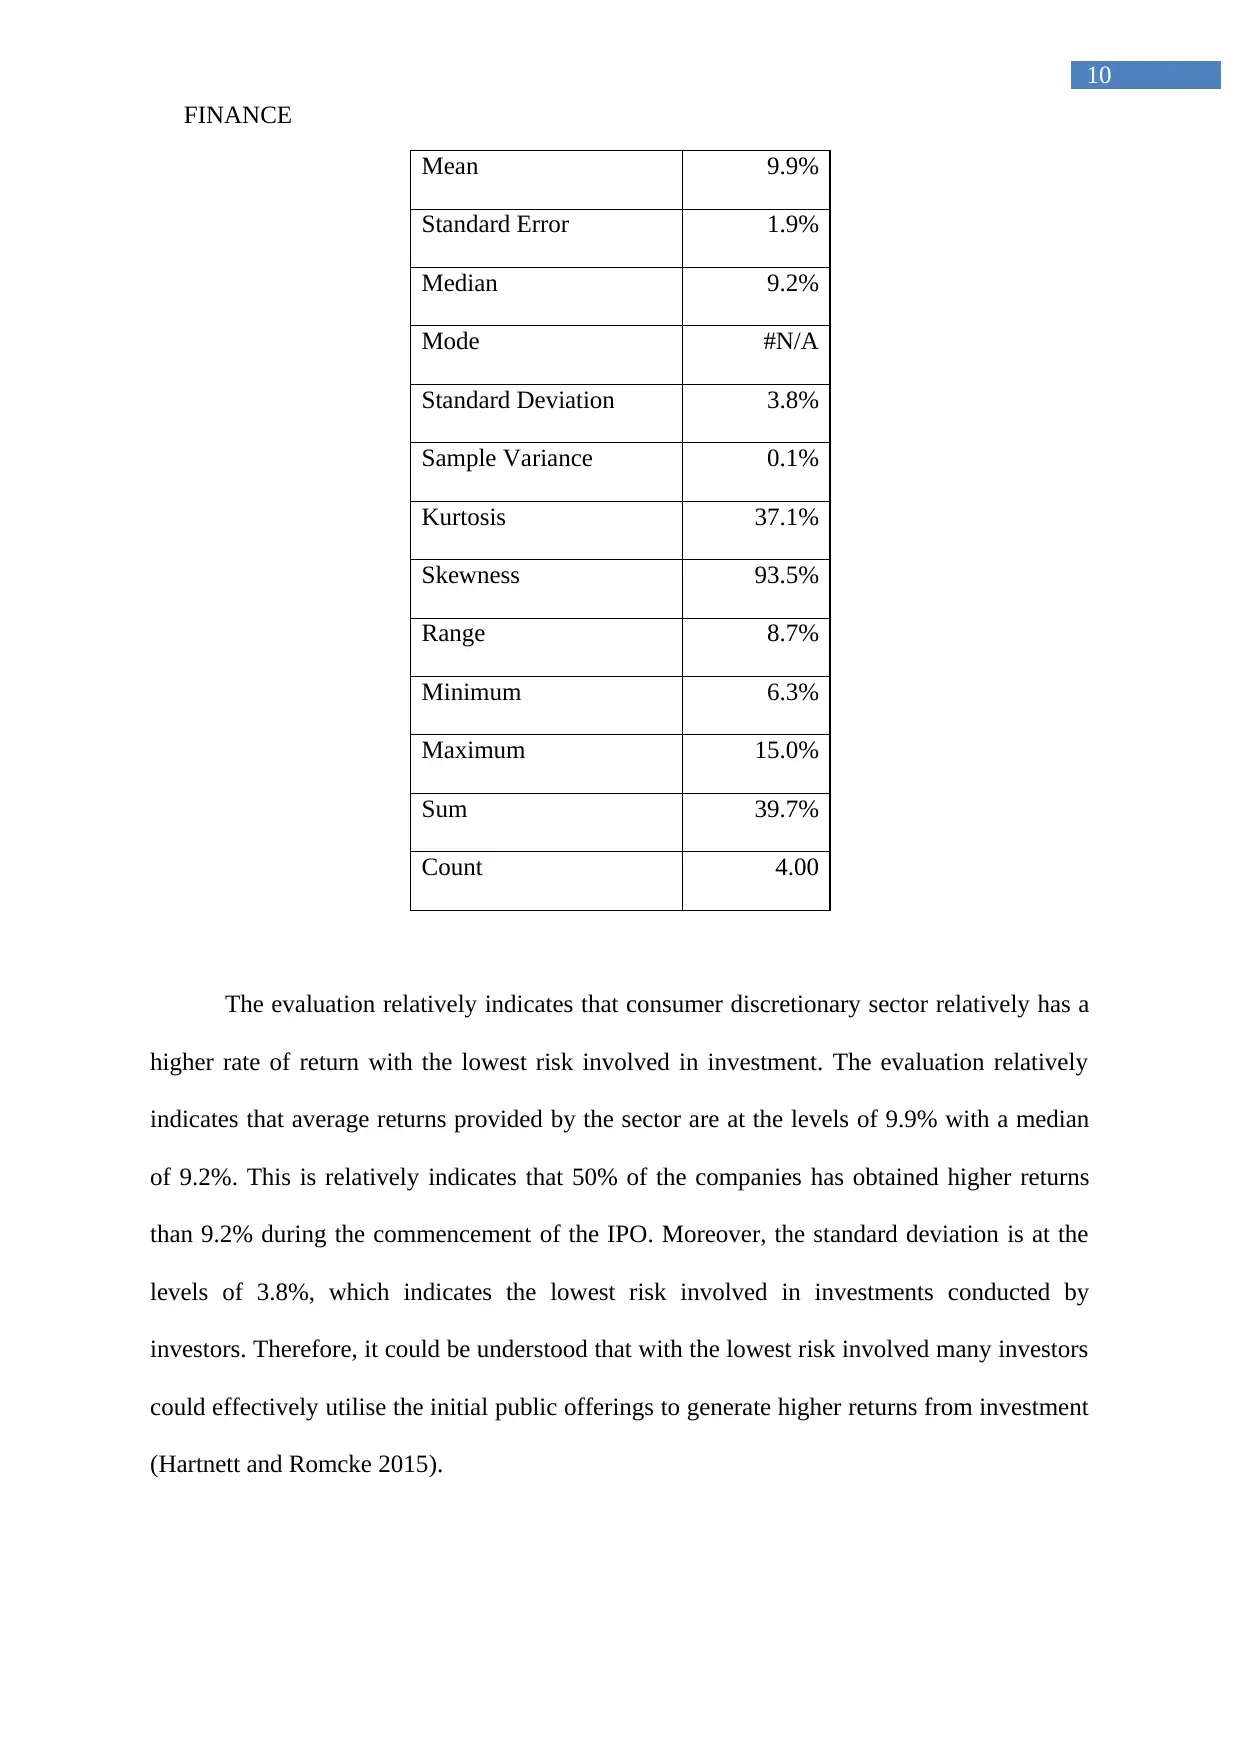
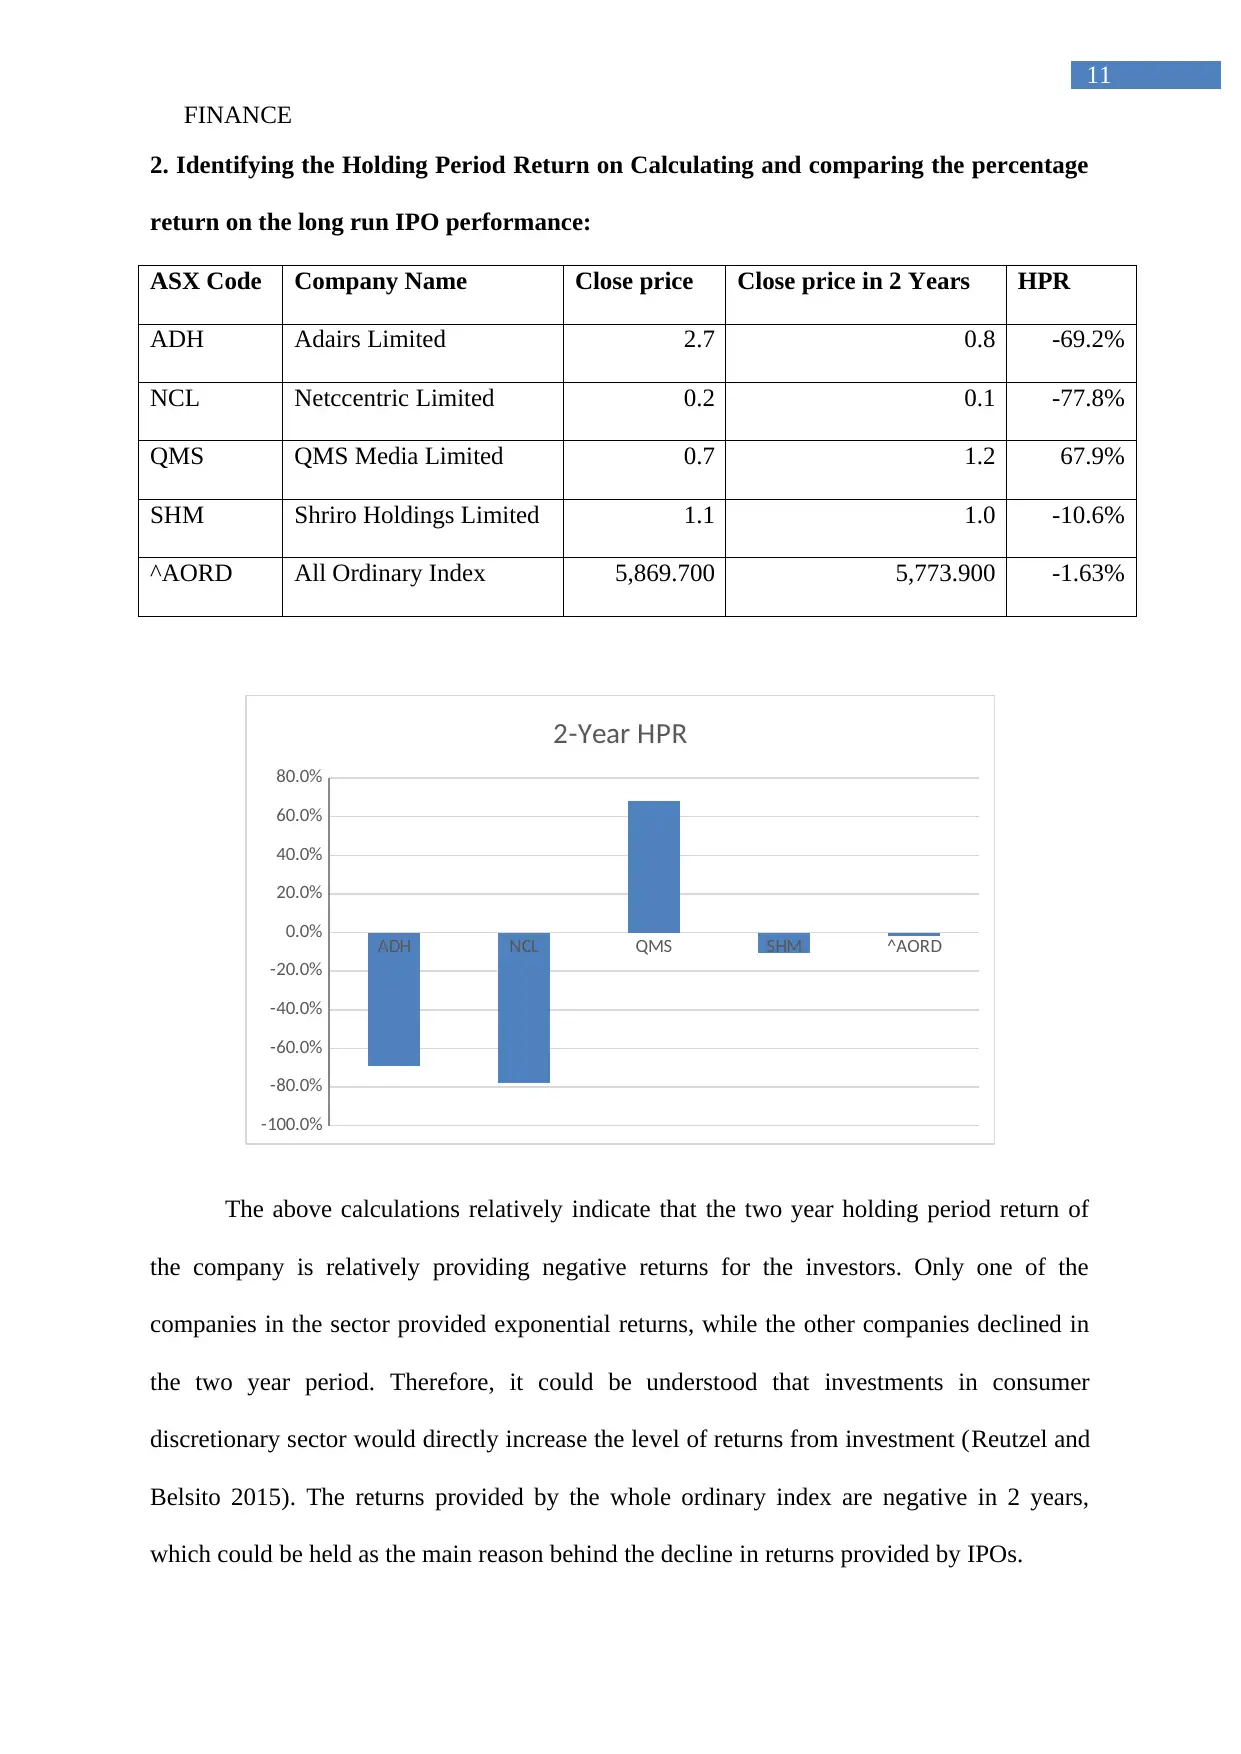
This report provides a comprehensive analysis of Initial Public Offerings (IPOs) in the Australian market, examining the initial returns generated from various sectors, including Real Estate, Telecommunications, Financials, Healthcare, Information Technology, and Consumer Discretionary. The report utilizes descriptive statistics to evaluate the performance of IPOs from April to July 2015, highlighting mean, median, standard deviation, and other relevant metrics. Furthermore, it identifies the Holding Period Return (HPR) over a two-year period for selected companies, comparing their performance against the All Ordinaries Index. The report also delves into the phenomenon of IPO underpricing, exploring the information asymmetry and behavioral theories that contribute to this practice in both the Australian and US markets, referencing empirical research from Hong Kong. The analysis aims to provide insights into the risks and returns associated with IPO investments, offering valuable information for investors and financial analysts.
Document Page
Running head: FINANCE
Finance
Name of the Student:
Name of the University:
Authors Note:
tabler-icon-diamond-filled.svg

Paraphrase This Document

Need a fresh take? Get an instant paraphrase of this document with our AI Paraphraser
Document Page
FINANCE
1
Table of Contents
Question:....................................................................................................................................2
1. Evaluating the initial returns generated from Australian, while analysing and interpreting
the data:......................................................................................................................................2
2. Identifying the Holding Period Return on Calculating and comparing the percentage return
on the long run IPO performance:............................................................................................11
3. Estimating the occurrence of IPO underpricing, which is been conducted in Australian and
US market by evaluating the empirical research on Hong Kong:............................................12
Reference and Bibliography:....................................................................................................15
Document Page
FINANCE
2
Question:
1. Evaluating the initial returns generated from Australian, while analysing and
interpreting the data:
Initial public listing (Descriptive Analysis):
Initial return
Mean 9.42%
Standard Error 4.94%
Median 5.78%
Mode 0.00%
Standard Deviation 26.15%
Sample Variance 6.84%
Kurtosis 607.69%
Skewness 144.62%
Range 154.84%
Minimum -55.14%
Maximum 99.70%
Sum 263.86%
Count 28.00
The calculation conducted in the about descriptive statistics relatively helps in
identifying the returns that is generated from the IPOs data listed in Australia from April to
July 2015. the descriptive statistics mainly contains the overall calculations of standard
deviation, mean, mode and median which helps in deriving the results obtained from the IPO
Document Page
FINANCE
3
initiation. From the valuation it could be understood that 28 of the IPOs were used to drive
the calculations and detect whether on the day of initial price offering adequate return for
provided to investors. After evaluating the descriptive analysis it could be identified that the
average or mean returns provided by the stocks on the day of their initiation was at the levels
of 9.4%. This actually indicates that maximum of the IPO provided a positive return to the
investors on the first day of trading. Moreover, the median or the mid value effect on that was
generated by the IP used during April to July 2015 was at the levels of 5.78%. This indicates
that 50% of the company's launching the IPO during the period had more than 5.78% returns.
From the overall valuation it could be identified that risk levels of the IPO was at the levels of
26.2%, which relatively indicates high risk involved in Investments. Therefore, from the
valuation it could be understood that risk involvement in the IPOs is relatively higher than the
returns provided by the company (Bradley, Kim and Krigman 2015).
1ST
ADH
AER
AFG
ALI
AXP
AYS
BMH
CGC
ECX
FFT
FRX
GDF
GNX
GTY
IQ3
KSL
MDC
MUA
MYO
NCL
PIQ
PPL
QMS
RFN
SHM
SLC
WDE
-80.0%
-60.0%
-40.0%
-20.0%
0.0%
20.0%
40.0%
60.0%
80.0%
100.0%
120.0%
Return %
After the evaluation of above figure the overall returns provided by the companies
during the initial public offering can be identified. From the valuation it could be detected
that maximum of the companies that have issued the IPO has incurred first day losses. From
the evaluation it could also be identified that returns provided by the IPL companies are
inconsistent, as devaluation of the stock was based on the assumptions made by the investors
regarding the financial strength and return generation capacity of the companies. hence it
tabler-icon-diamond-filled.svg

Paraphrase This Document

Need a fresh take? Get an instant paraphrase of this document with our AI Paraphraser
Document Page
FINANCE
4
could be identified that some of the companies generated a higher returns while other
provided losses during the IPO initiation (Bouzouita, Gajewski and Gresse 2015).
There are some assumptions made before the evaluation of descriptive analysis under
GICS sector, which relatively helps in evaluating the sectors that has more than one company
in their IPO initiation. Sector that does not have more than one company in there it initiation
is not selected for the descriptive analysis, as the outcome will not be relevant and will
provide unearthly results. Sectors such as Consumer staples, Industrials, and Utilities are not
evaluated under the descriptive analysis, as they have only one stock listed for the IPO during
April to July 2017. The descriptive analysis of the following selected sectors is conducted as
follows.
Real Estate (Descriptive Analysis):
Real Estate
Mean 2.8%
Standard Error 0.3%
Median 2.8%
Mode #N/A
Standard Deviation 0.4%
Sample Variance 0.0%
Kurtosis #DIV/0!
Skewness #DIV/0!
Range 0.6%
Minimum 2.5%
Maximum 3.1%
Sum 5.6%
Document Page
FINANCE
5
Count 2.00
The evaluation mainly indicates that 2.8% average returns are relatively provided by
the real estate sector IPOs in their first day of trading. Furthermore, the risk involved in
investments is at the levels of 4.2% and the median is at the levels of 2.8%. However, the 2
observations are used in the descriptive analysis, which does not provide in depth evaluation
of the sector. Moreover, the risk involved in investment in real estate is relatively high in
comparison to the returns provided by the IPOs (Park and Patel 2015).
Telecommunications Services (Descriptive Analysis):
Telecommunication Services
Mean 35.1%
Standard Error 32.3%
Median 5.6%
Mode #N/A
Standard Deviation 56.0%
Sample Variance 31.4%
Kurtosis #DIV/0!
Skewness 171.3%
Range 99.7%
Minimum 0.0%
Maximum 99.7%
Sum 105.3%
Count 3.00
Document Page
FINANCE
6
The descriptive analysis of Telecommunication services sector is conducted in the
above calculation, which relatively indicates that 50% of the companies conducting the IPO
have a return higher than 35.1%. In addition, the calculation also indicates that the average
returns provided by the IPOs are the first day of trading is at the levels of 5.56%, which is
derived from the mean value of the descriptive analysis. However, the standard deviation is
mainly at the levels of 56%, which is relatively higher due to the increase returns provided by
the telecommunication service sector. Therefore, it could be understood that with higher
returns increased risk is involved in IPO initiation, which could augment risk from
investment of the investors (Brau, Cicon and McQueen 2016).
Financials (Descriptive Analysis):
Financials
Mean 17.0%
Standard Error 11.8%
Median 9.9%
Mode #N/A
Standard Deviation 29.0%
Sample Variance 8.4%
Kurtosis 78.2%
Skewness 105.7%
Range 79.3%
Minimum -12.7%
Maximum 66.7%
tabler-icon-diamond-filled.svg

Paraphrase This Document

Need a fresh take? Get an instant paraphrase of this document with our AI Paraphraser
Document Page
FINANCE
7
Sum 102.1%
Count 6.00
The above calculation evaluate 6 different financial sector companies which have
conducted the IPOs during April to July 2015.this evaluation mainly indicate that 50% of the
overall companies conducting the IPO have obtained returns more than 17% with an average
return of 9.9%. This relatively indicates that the return capability of financial sector is
relatively higher, which might allow investors to increase the returns from investment.
However, the standard deviation is at the levels of 29%, which is relatively high in
comparison to the returns provided by the IPOs. The return and risk involved financial sector
investments is relatively adequate investors, as it provides a probability of generating higher
returns from investment while reducing the risk from investment. In this context, Ammer and
Ahmad-Zaluki (2016) stated that investors evaluate the risk and return capability of an
investment before adding them to the portfolios, as they need to increase the return and
reduce the risk of their Investments.
Healthcare (Descriptive Analysis):
Health Care
Mean -12.5%
Standard Error 14.3%
Median -0.5%
Mode #N/A
Standard Deviation 28.6%
Sample Variance 8.2%
Document Page
FINANCE
8
Kurtosis 366.9%
Skewness -190.2%
Range 61.1%
Minimum -55.1%
Maximum 6.0%
Sum -50.1%
Count 4.00
The above calculations help in evaluating the descriptive statistics of Healthcare
Companies IPOs, which is listed in the Australian index. The number of companies use for
the evaluation is 4, as the time frame used for evaluation was 4 month. In addition, the overall
returns that could be provided by Healthcare sector IPOs is relatively low, as compared to
other sectors (Nielsson and Wojcik 2016). The calculations of Mean, Median and standard
deviation relatively indicate the low return generation capability of Healthcare sector, which
might increase risk from investment while reducing the returns. The average returns of the
IPOs is at -5%, while of of the companies has introduced returns a higher than 12.5%.
Moreover, the risk involved in investment is at the levels of 28.6%, which is fairly high in
comparison to the negative returns provided by the health sector companies.
Information Technology (Descriptive Analysis):
Information Technology
Mean 9.0%
Standard Error 5.5%
Median 6.6%
Mode #N/A
Document Page
FINANCE
9
Standard Deviation 13.5%
Sample Variance 1.8%
Kurtosis -9.9%
Skewness 55.3%
Range 38.0%
Minimum -8.0%
Maximum 30.0%
Sum 53.8%
Count 6.00
From the above devaluation descriptive analysis of Information Technology Sector
can be identified, where the mean, median and standard deviation of the returns provided by
the IPOs could be detected. In addition the oral return that is provided by Information
Technology Sector on an average is at the levels of 9%, which might allow investors to gain
exponentially during the first trading day. Moreover, 50% of the information technology
sector IPOs provided a return higher than 6.6% on the first day of trading. This relatively
indicates the credibility and return that could be generated by investors. Furthermore, with
the use of standard deviation the risk involved in investments could be identified which is at
the levels of 13.5%. Comparing the returns and risk involved in investment the Information
Technology Sector provides highly profitable IPOs, which might increase profit of the
investors while reducing risk involved in Investments (Cai and Zhu 2015).
Consumer Discretionary (Descriptive Analysis):
Consumer Discretionary
tabler-icon-diamond-filled.svg

Paraphrase This Document

Need a fresh take? Get an instant paraphrase of this document with our AI Paraphraser
Document Page
FINANCE
10
Mean 9.9%
Standard Error 1.9%
Median 9.2%
Mode #N/A
Standard Deviation 3.8%
Sample Variance 0.1%
Kurtosis 37.1%
Skewness 93.5%
Range 8.7%
Minimum 6.3%
Maximum 15.0%
Sum 39.7%
Count 4.00
The evaluation relatively indicates that consumer discretionary sector relatively has a
higher rate of return with the lowest risk involved in investment. The evaluation relatively
indicates that average returns provided by the sector are at the levels of 9.9% with a median
of 9.2%. This is relatively indicates that 50% of the companies has obtained higher returns
than 9.2% during the commencement of the IPO. Moreover, the standard deviation is at the
levels of 3.8%, which indicates the lowest risk involved in investments conducted by
investors. Therefore, it could be understood that with the lowest risk involved many investors
could effectively utilise the initial public offerings to generate higher returns from investment
(Hartnett and Romcke 2015).
Document Page
FINANCE
11
2. Identifying the Holding Period Return on Calculating and comparing the percentage
return on the long run IPO performance:
ASX Code Company Name Close price Close price in 2 Years HPR
ADH Adairs Limited 2.7 0.8 -69.2%
NCL Netccentric Limited 0.2 0.1 -77.8%
QMS QMS Media Limited 0.7 1.2 67.9%
SHM Shriro Holdings Limited 1.1 1.0 -10.6%
^AORD All Ordinary Index 5,869.700 5,773.900 -1.63%
ADH NCL QMS SHM ^AORD
-100.0%
-80.0%
-60.0%
-40.0%
-20.0%
0.0%
20.0%
40.0%
60.0%
80.0%
2-Year HPR
The above calculations relatively indicate that the two year holding period return of
the company is relatively providing negative returns for the investors. Only one of the
companies in the sector provided exponential returns, while the other companies declined in
the two year period. Therefore, it could be understood that investments in consumer
discretionary sector would directly increase the level of returns from investment (Reutzel and
Belsito 2015). The returns provided by the whole ordinary index are negative in 2 years,
which could be held as the main reason behind the decline in returns provided by IPOs.
chevron_up_icon
1 out of 16
circle_padding
hide_on_mobile
zoom_out_icon
[object Object]