University of South Australia: Financial Performance Comparison Report
VerifiedAdded on 2020/03/28
|18
|3797
|30
Report
AI Summary
This report provides a detailed financial analysis of Iron Road Ltd (IRD) for the fiscal year 2017, comparing its performance with Kingston Resources Ltd (KSN). The analysis includes a review of IRD's consolidated statement of comprehensive income, financial position, and cash flow, highlighting a loss of $3,926,284. Ratio analysis is used to compare profitability, efficiency, liquidity, and capital structure ratios between the two companies. The report also examines IRD's operating results, changes in financial position, and overall financial performance, revealing challenges in revenue generation and increasing expenditure. Furthermore, the report discusses environmental practices adopted by KSN and recommends similar strategies for IRD. The conclusion summarizes the financial health of IRD and suggests potential solutions to address the identified issues. The report leverages financial data from 2015, 2016 and 2017 to make clarified comparisons between Iron Road Ltd and Kingston Resource Ltd.
University of South Australia
Iron Road Limited IRD.
2017 Financial Report based on Benchmarking Company
Kingston Resources Limited KSN.
Management Accounting
Iron Road Limited IRD.
2017 Financial Report based on Benchmarking Company
Kingston Resources Limited KSN.
Management Accounting
Paraphrase This Document
Need a fresh take? Get an instant paraphrase of this document with our AI Paraphraser
Table of Contents
1 Executive Summary.......................................................................................................................2
2 Introduction....................................................................................................................................2
3 Financial Performance & Position of Iron Road Ltd.....................................................................3
3.1 Consolidated statement of Comprehensive Income................................................................3
3.2 Consolidated statement of Financial Position.........................................................................4
3.3 Consolidated statement of Cash Flow.....................................................................................5
3.4 Operating Result.....................................................................................................................6
3.5 Changes in Financial Position.................................................................................................7
3.6 Financial performance.............................................................................................................7
4 Financial Proceed Comparison.......................................................................................................7
4.1 Ratio Analysis.........................................................................................................................8
4.2 Comparison of Profitability Ratios.........................................................................................8
4.2.1 Comparison of Efficiency Ratios.....................................................................................8
4.2.2 Comparison of Liquidity Ratios and Capital Structure Ratio..........................................9
5 Annual Report Analysis...............................................................................................................10
5.1 Strategy of investing on highly competitive market:............................................................10
5.2 Risk Management:................................................................................................................11
6 Environment Activities Report.....................................................................................................12
6.1 Kingston Resource Ltd KSN’s practices..............................................................................12
6.2 Recommendation on Environmental decisions to Iron Road Ltd.........................................12
7 Conclusion....................................................................................................................................12
8 References....................................................................................................................................13
9 Appendices...................................................................................................................................14
1
1 Executive Summary
Due to the inaccurate recording and reporting of business transactions and highly competitive market
in the mining industry, Iron Road Ltd faces a lots of issues due to which, Iron Road Ltd is facing a
loss of $3,926,284 in FY 2017(Iron Road Ltd, 2017). Financial data helps to measure the actual
performance of the overall business activities. This studybasically focuses on financial analysis of
Iron Road Ltd IRD and, to measure its financial performance in comparison to its benchmarking
company i.e. Kingston Resource Ltd KSN. This study indicates financial condition and position of
Iron Road Ltd IRD. Ratio Analysis tool is used to measure the financial performance and to make
clarified comparison with the benchmarking company. Environmental issues have become major
criteria, which plays a crucial role in determining the success or failure of any organization. This
study is also focused towards the environmental practices, which has already been adopted by the
benchmarking company and some of them are recommended to Iron Road Ltd.
2 Introduction
Iron Road Ltd IRD isoperating in iron ore exploration and mining industry in Australia since 2008.
The main activities of Iron Road Ltd during last few years were evaluation of its iron ore,
exploration and some additional metallurgical test functions & mine planning activities (Iron Road
Ltd, 2008). In the past few years, Iron Road Ltd is facing the problem with its declining revenue
along with high expenditure. As a result, the Company is facing loss and its share prices are
declining day by day(Reuters, 2017). To measure the financial performance of Iron Road Ltd, this
study used the financial records and compared it with its rival company i.e. Kingston Resource
2
⊘ This is a preview!⊘
Do you want full access?
Subscribe today to unlock all pages.
Trusted by 1+ million students worldwide
LtdKSN financial records. Here, we use the financial data of both the companies for the fiscal year
2016-17 to do the financial measurement.
The main aim of this study is to do the financial analysis of Iron Road Ltd with its benchmarking
company i.e. Kingston Resource Ltd. This study reveals the financial condition of Iron Road Ltd for
the fiscal year 2016-17. On the basis of the given financial data for the fiscal year 2016-17, this
study makes a clarified comparison with its benchmarking company. With the help of financial
statements of Iron Road Ltd, this study depicts actual financial condition or position of it. As ratio
analysis is one of the major tools of financial analysis, here we use this tool to make comparison
with benchmarking company of Iron Road Ltd. On the basis of the outcome ratios and result of its
operating activities, this report also suggests about the working technique of Iron Road Ltd. This
study also discusses about the adopted environmental practices by benchmarking company and
suggests some of these to Iron Road Ltd.
In end, we will discuss about the solutions to overcome the issues faced by IronRoad Ltd IRD.
3 Financial Performance & Position of Iron Road Ltd
With the help of the given financial data in the annual report of Iron Road Ltd for the FY 2016-17,
financial report or financial statement is being formed to show the actual financial condition of Iron
Road Ltd.
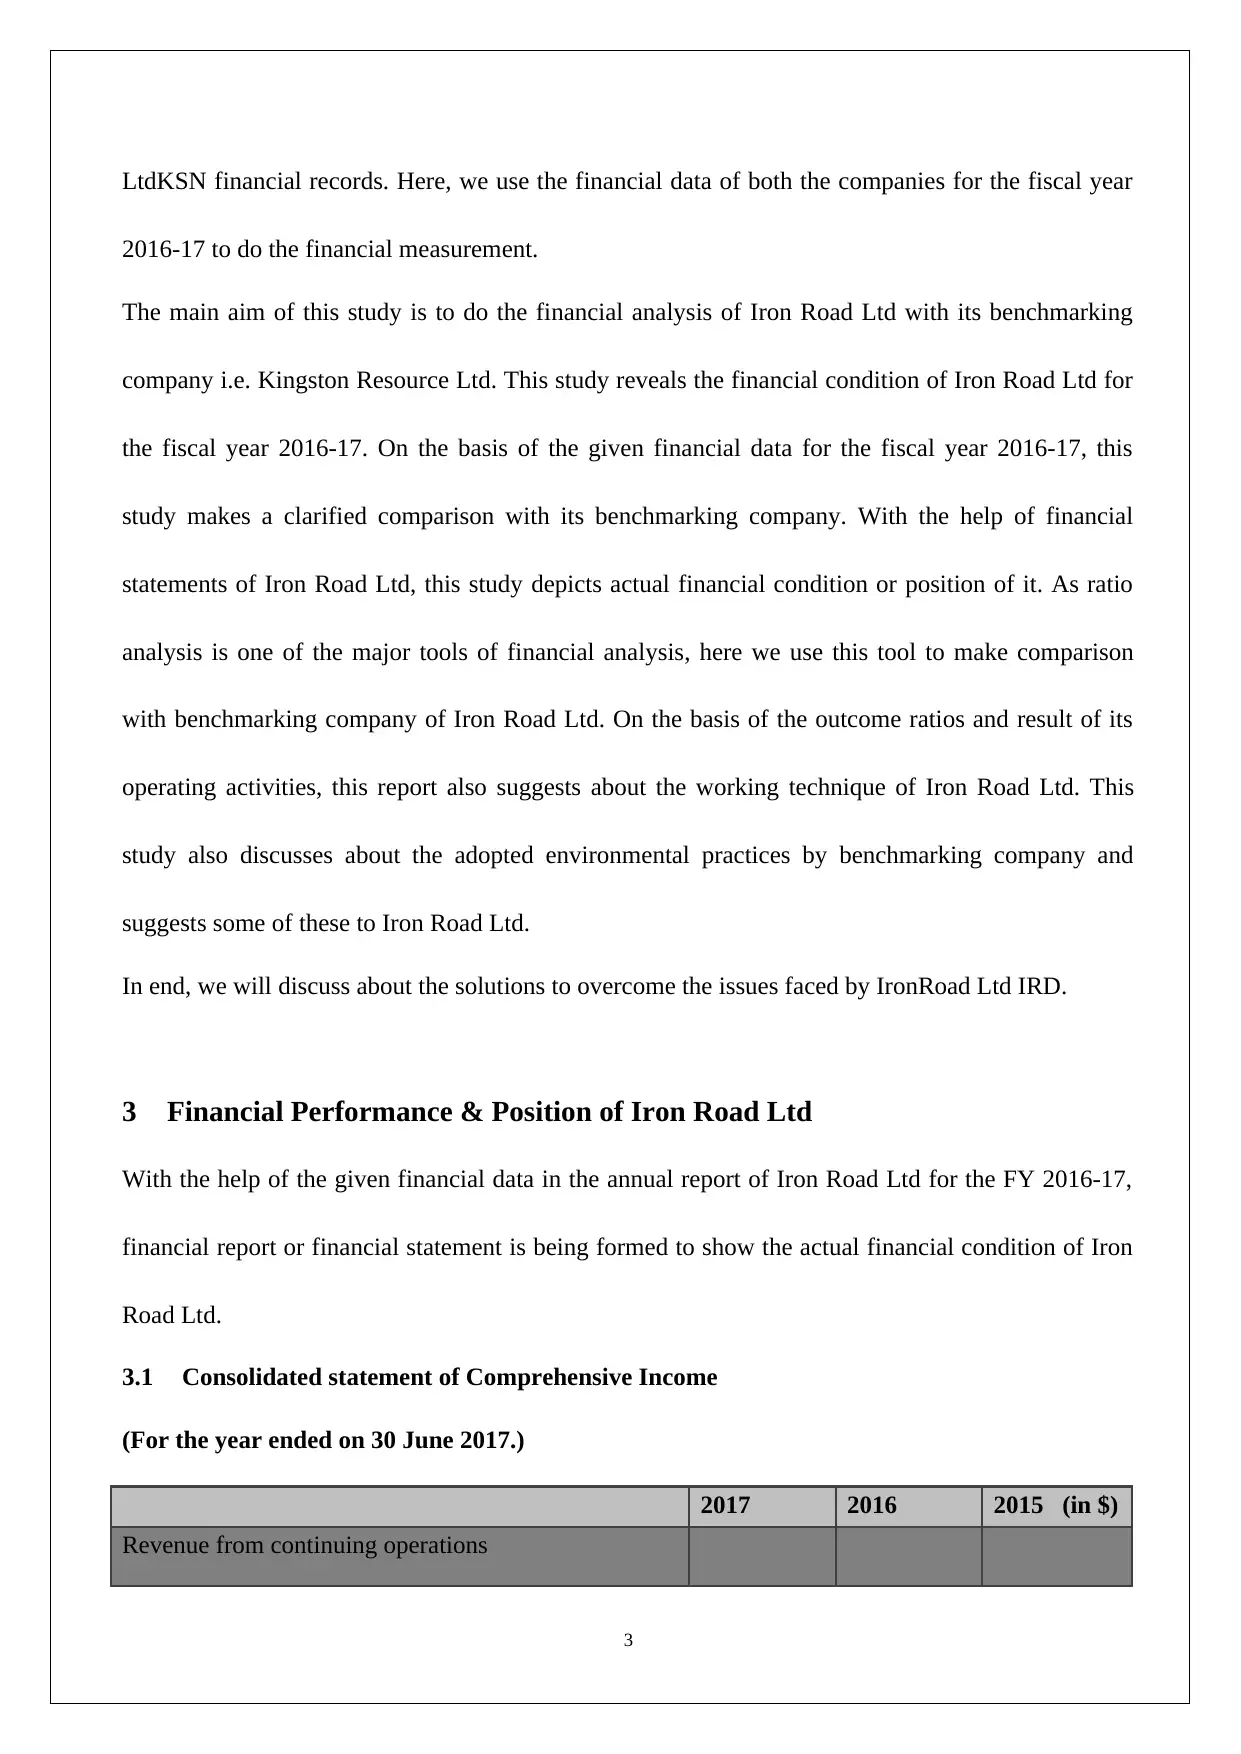
3.1 Consolidated statement of Comprehensive Income
(For the year ended on 30 June 2017.)
2017 2016 2015 (in $)
Revenue from continuing operations
3
2016-17 to do the financial measurement.
The main aim of this study is to do the financial analysis of Iron Road Ltd with its benchmarking
company i.e. Kingston Resource Ltd. This study reveals the financial condition of Iron Road Ltd for
the fiscal year 2016-17. On the basis of the given financial data for the fiscal year 2016-17, this
study makes a clarified comparison with its benchmarking company. With the help of financial
statements of Iron Road Ltd, this study depicts actual financial condition or position of it. As ratio
analysis is one of the major tools of financial analysis, here we use this tool to make comparison
with benchmarking company of Iron Road Ltd. On the basis of the outcome ratios and result of its
operating activities, this report also suggests about the working technique of Iron Road Ltd. This
study also discusses about the adopted environmental practices by benchmarking company and
suggests some of these to Iron Road Ltd.
In end, we will discuss about the solutions to overcome the issues faced by IronRoad Ltd IRD.
3 Financial Performance & Position of Iron Road Ltd
With the help of the given financial data in the annual report of Iron Road Ltd for the FY 2016-17,
financial report or financial statement is being formed to show the actual financial condition of Iron
Road Ltd.
3.1 Consolidated statement of Comprehensive Income
(For the year ended on 30 June 2017.)
2017 2016 2015 (in $)
Revenue from continuing operations
3
Paraphrase This Document
Need a fresh take? Get an instant paraphrase of this document with our AI Paraphraser
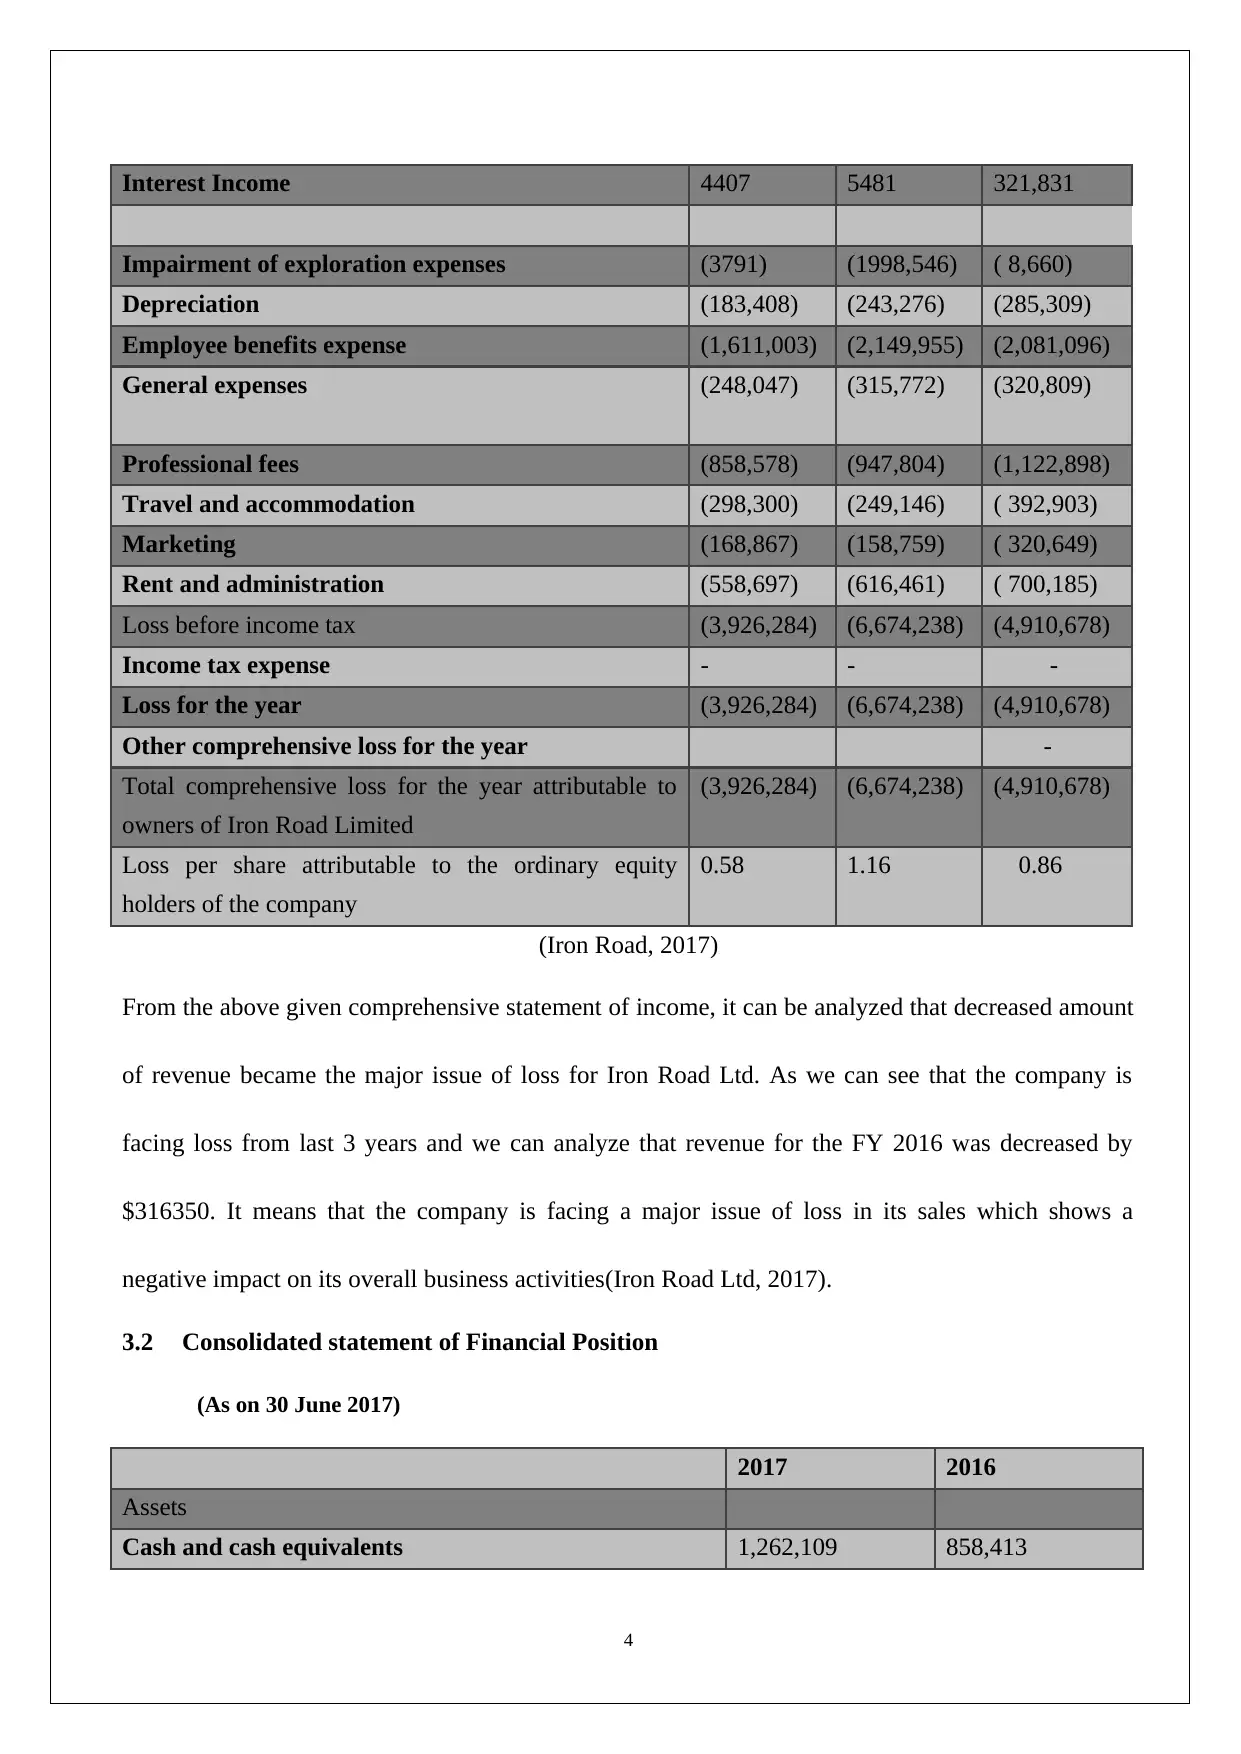
Interest Income 4407 5481 321,831
Impairment of exploration expenses (3791) (1998,546) ( 8,660)
Depreciation (183,408) (243,276) (285,309)
Employee benefits expense (1,611,003) (2,149,955) (2,081,096)
General expenses (248,047) (315,772) (320,809)
Professional fees (858,578) (947,804) (1,122,898)
Travel and accommodation (298,300) (249,146) ( 392,903)
Marketing (168,867) (158,759) ( 320,649)
Rent and administration (558,697) (616,461) ( 700,185)
Loss before income tax (3,926,284) (6,674,238) (4,910,678)
Income tax expense - - -
Loss for the year (3,926,284) (6,674,238) (4,910,678)
Other comprehensive loss for the year -
Total comprehensive loss for the year attributable to
owners of Iron Road Limited
(3,926,284) (6,674,238) (4,910,678)
Loss per share attributable to the ordinary equity
holders of the company
0.58 1.16 0.86
(Iron Road, 2017)
From the above given comprehensive statement of income, it can be analyzed that decreased amount
of revenue became the major issue of loss for Iron Road Ltd. As we can see that the company is
facing loss from last 3 years and we can analyze that revenue for the FY 2016 was decreased by
$316350. It means that the company is facing a major issue of loss in its sales which shows a
negative impact on its overall business activities(Iron Road Ltd, 2017).
3.2 Consolidated statement of Financial Position
(As on 30 June 2017)
2017 2016
Assets
Cash and cash equivalents 1,262,109 858,413
4
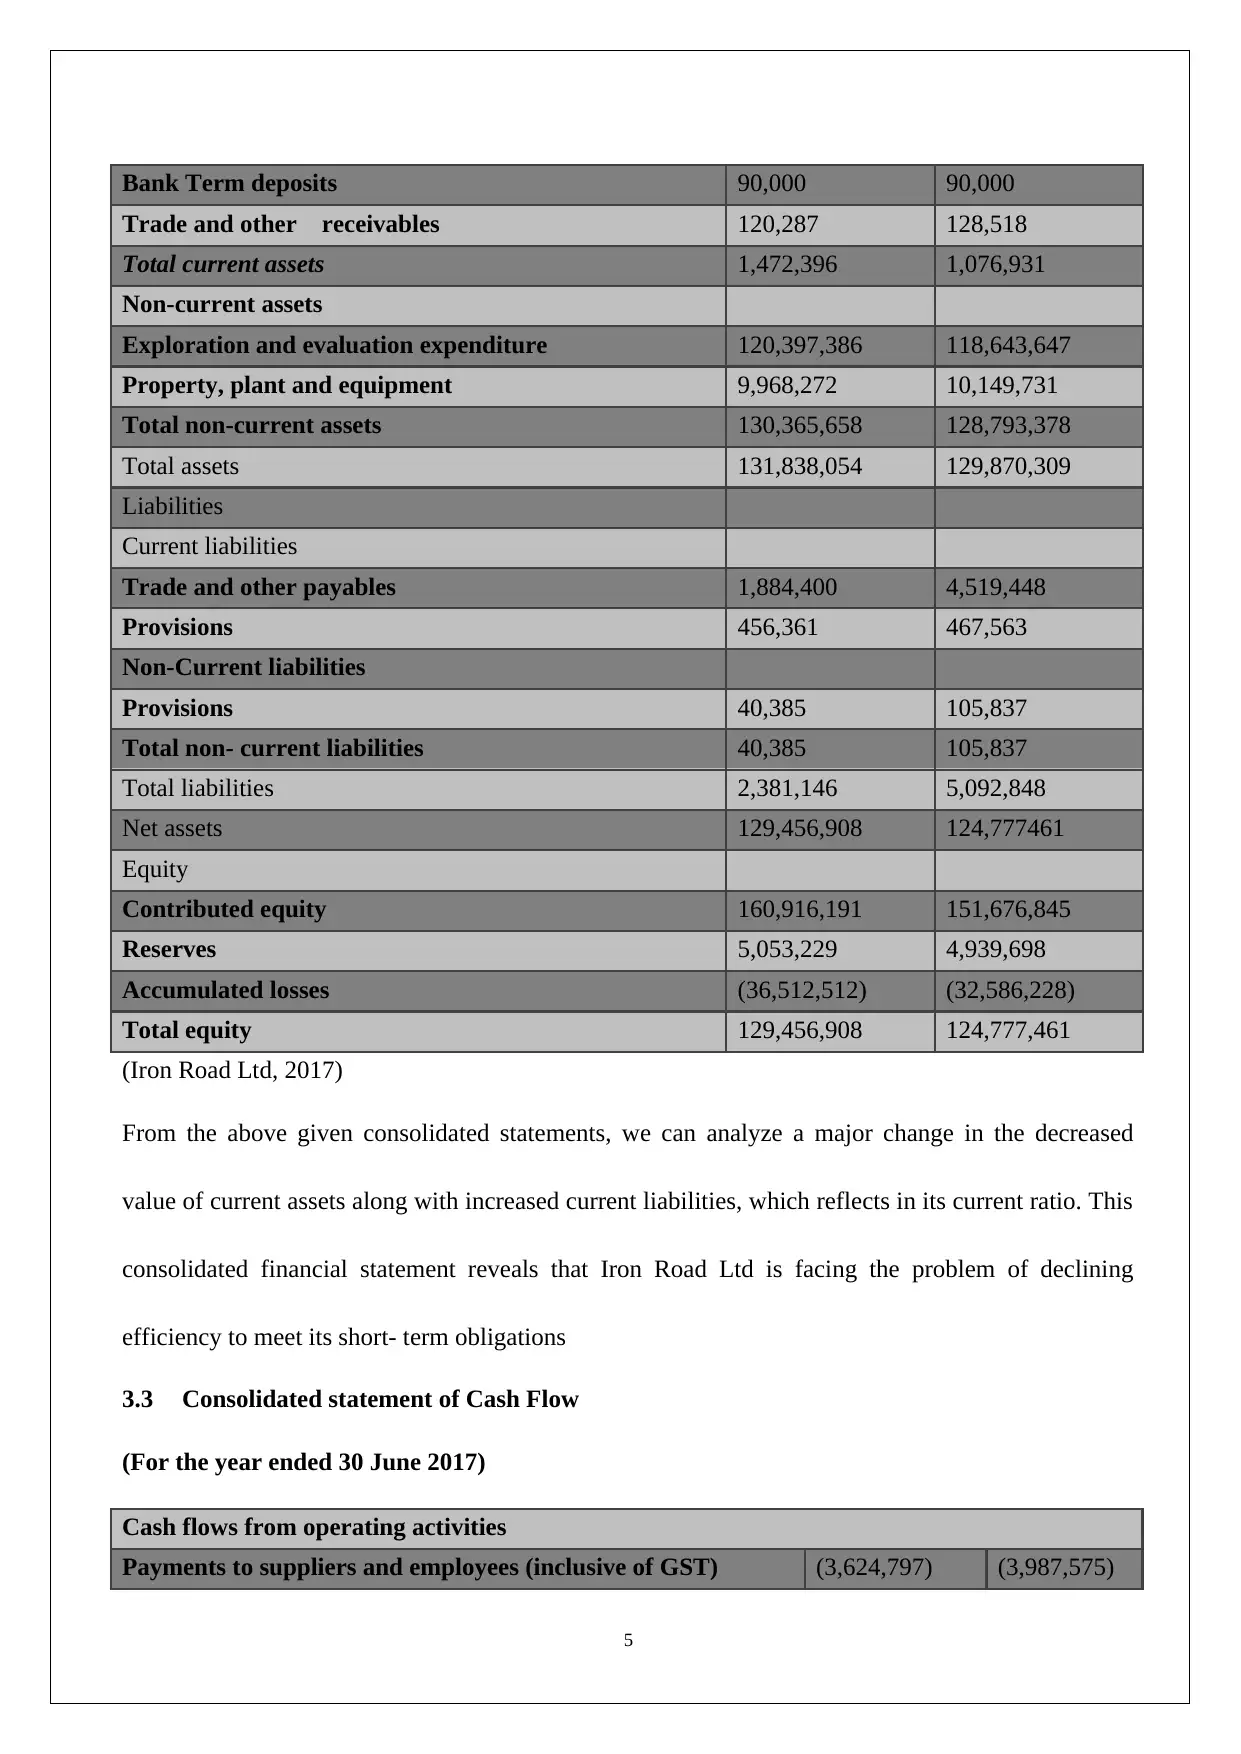
Bank Term deposits 90,000 90,000
Trade and other receivables 120,287 128,518
Total current assets 1,472,396 1,076,931
Non-current assets
Exploration and evaluation expenditure 120,397,386 118,643,647
Property, plant and equipment 9,968,272 10,149,731
Total non-current assets 130,365,658 128,793,378
Total assets 131,838,054 129,870,309
Liabilities
Current liabilities
Trade and other payables 1,884,400 4,519,448
Provisions 456,361 467,563
Non-Current liabilities
Provisions 40,385 105,837
Total non- current liabilities 40,385 105,837
Total liabilities 2,381,146 5,092,848
Net assets 129,456,908 124,777461
Equity
Contributed equity 160,916,191 151,676,845
Reserves 5,053,229 4,939,698
Accumulated losses (36,512,512) (32,586,228)
Total equity 129,456,908 124,777,461
(Iron Road Ltd, 2017)
From the above given consolidated statements, we can analyze a major change in the decreased
value of current assets along with increased current liabilities, which reflects in its current ratio. This
consolidated financial statement reveals that Iron Road Ltd is facing the problem of declining
efficiency to meet its short- term obligations
3.3 Consolidated statement of Cash Flow
(For the year ended 30 June 2017)
Cash flows from operating activities
Payments to suppliers and employees (inclusive of GST) (3,624,797) (3,987,575)
5
⊘ This is a preview!⊘
Do you want full access?
Subscribe today to unlock all pages.
Trusted by 1+ million students worldwide
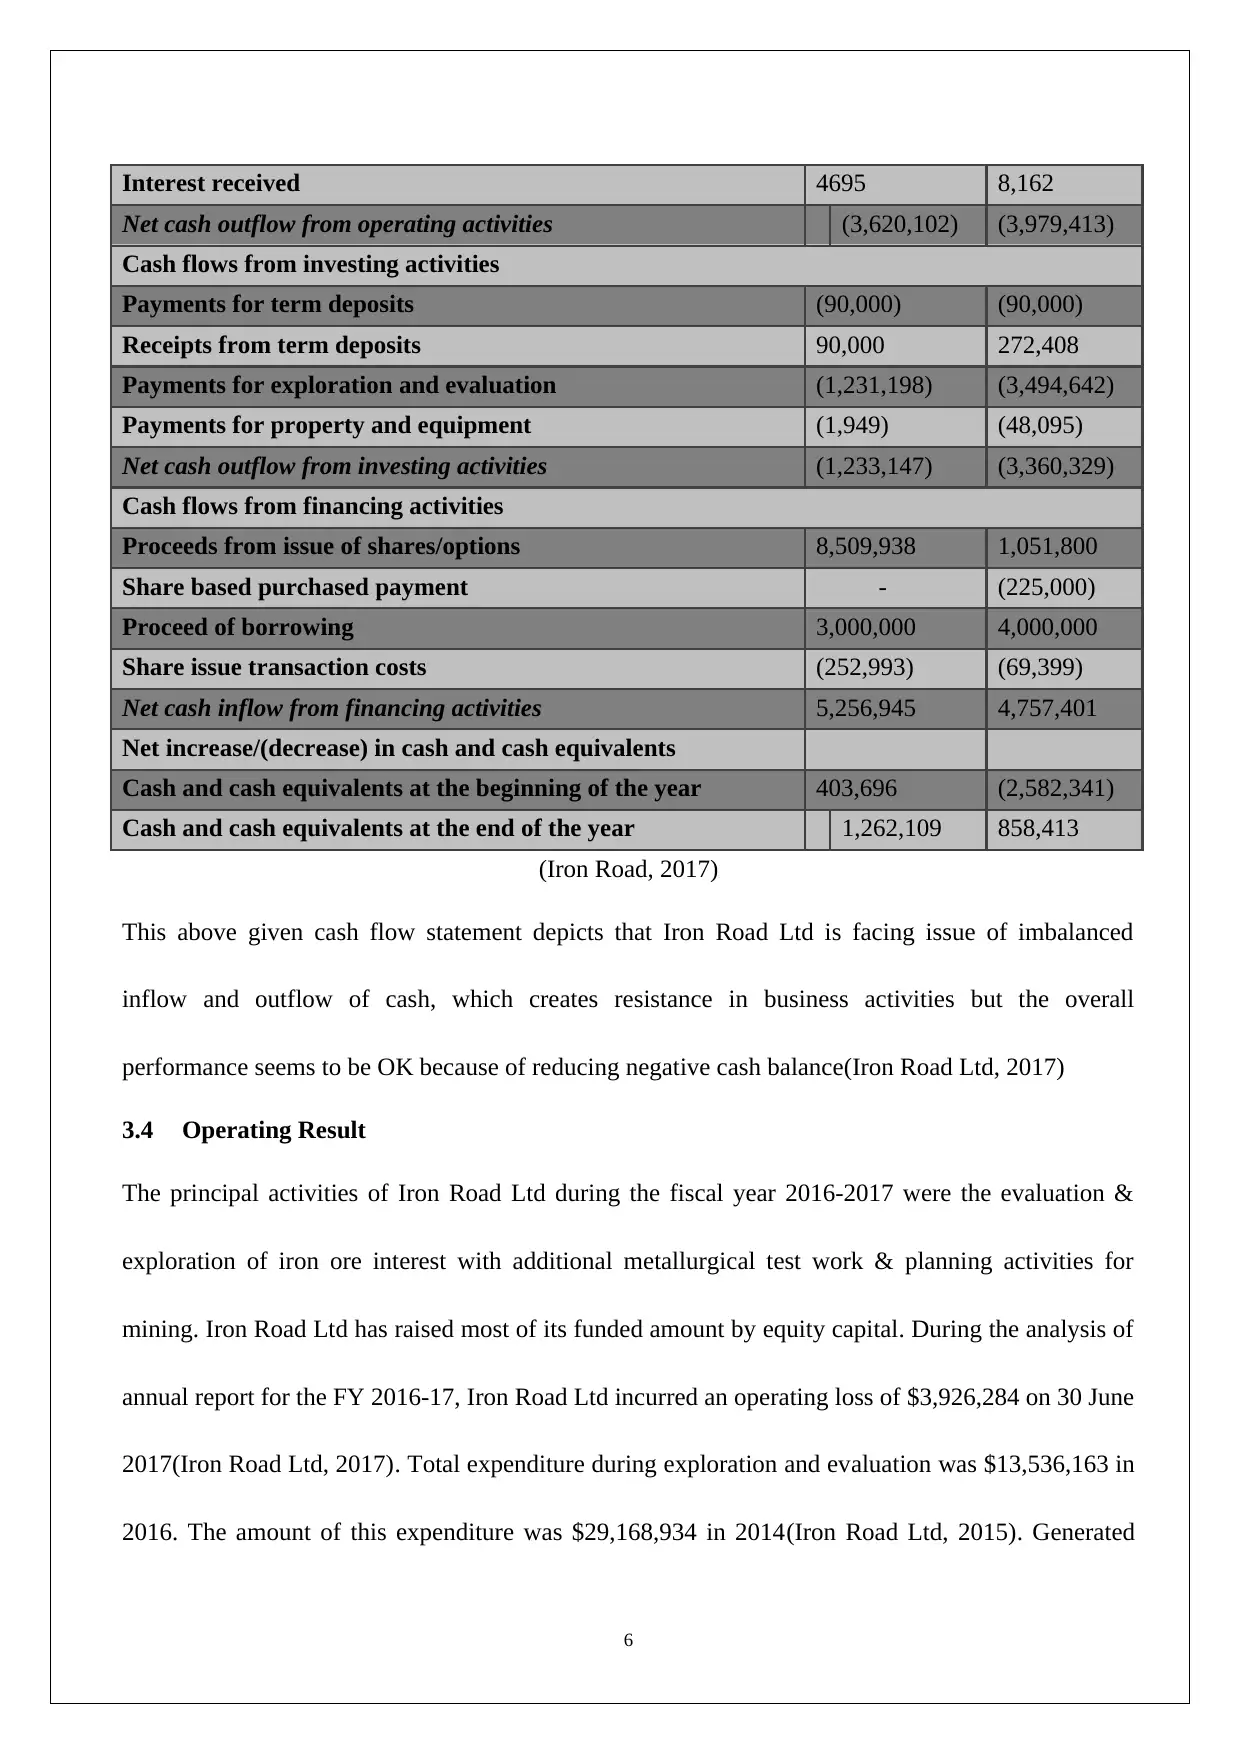
Interest received 4695 8,162
Net cash outflow from operating activities (3,620,102) (3,979,413)
Cash flows from investing activities
Payments for term deposits (90,000) (90,000)
Receipts from term deposits 90,000 272,408
Payments for exploration and evaluation (1,231,198) (3,494,642)
Payments for property and equipment (1,949) (48,095)
Net cash outflow from investing activities (1,233,147) (3,360,329)
Cash flows from financing activities
Proceeds from issue of shares/options 8,509,938 1,051,800
Share based purchased payment - (225,000)
Proceed of borrowing 3,000,000 4,000,000
Share issue transaction costs (252,993) (69,399)
Net cash inflow from financing activities 5,256,945 4,757,401
Net increase/(decrease) in cash and cash equivalents
Cash and cash equivalents at the beginning of the year 403,696 (2,582,341)
Cash and cash equivalents at the end of the year 1,262,109 858,413
(Iron Road, 2017)
This above given cash flow statement depicts that Iron Road Ltd is facing issue of imbalanced
inflow and outflow of cash, which creates resistance in business activities but the overall
performance seems to be OK because of reducing negative cash balance(Iron Road Ltd, 2017)
3.4 Operating Result
The principal activities of Iron Road Ltd during the fiscal year 2016-2017 were the evaluation &
exploration of iron ore interest with additional metallurgical test work & planning activities for
mining. Iron Road Ltd has raised most of its funded amount by equity capital. During the analysis of
annual report for the FY 2016-17, Iron Road Ltd incurred an operating loss of $3,926,284 on 30 June
2017(Iron Road Ltd, 2017). Total expenditure during exploration and evaluation was $13,536,163 in
2016. The amount of this expenditure was $29,168,934 in 2014(Iron Road Ltd, 2015). Generated
6
Paraphrase This Document
Need a fresh take? Get an instant paraphrase of this document with our AI Paraphraser
income from interest is $4,407 i.e. decreased by $1074 than its previous financial year(Iron Road,
2017). It can be analyzed that Iron Road Ltd has decreased its expenditure amount which shows
direct negative impact on its earning capacity and reduced revenue (Iron Road Ltd, 2017).
3.5 Changes in Financial Position
Iron Road Ltd’s assets remain unchanged during the year 2016 & 2017 due to its capitalization of
expenditure & optimization of the proposed mining operations. If we talked about net working
capital, then it can be measured that Iron Road Ltd has decreased its net working capital amount to
$868,365 ($20,637,935 in 2014). Iron Road Ltd has utilized its cash resource to expand its operating
activities. During the last few years, Iron Road Ltd has expanded its investment in the evaluation &
exploration of new mining projects (Iron Road, 2017). To expand its business operations, Iron Road
Ltd utilized its cash reserve which ultimately shows direct impact on current revenues (Iron Road
Ltd, 2017).
3.6 Financial performance
Overall financial performance of Iron Road Ltd is not satisfactory. The company is facing losses due
to decreasing amount of generated revenue with increasing expenditure amount. Return on equity is
enough to express the financial performance of any company but, in a case of Iron Road Ltd, we can
see that the company is showing loss per share which ultimately states that performance is not so
good(Iron Road, 2016).
7
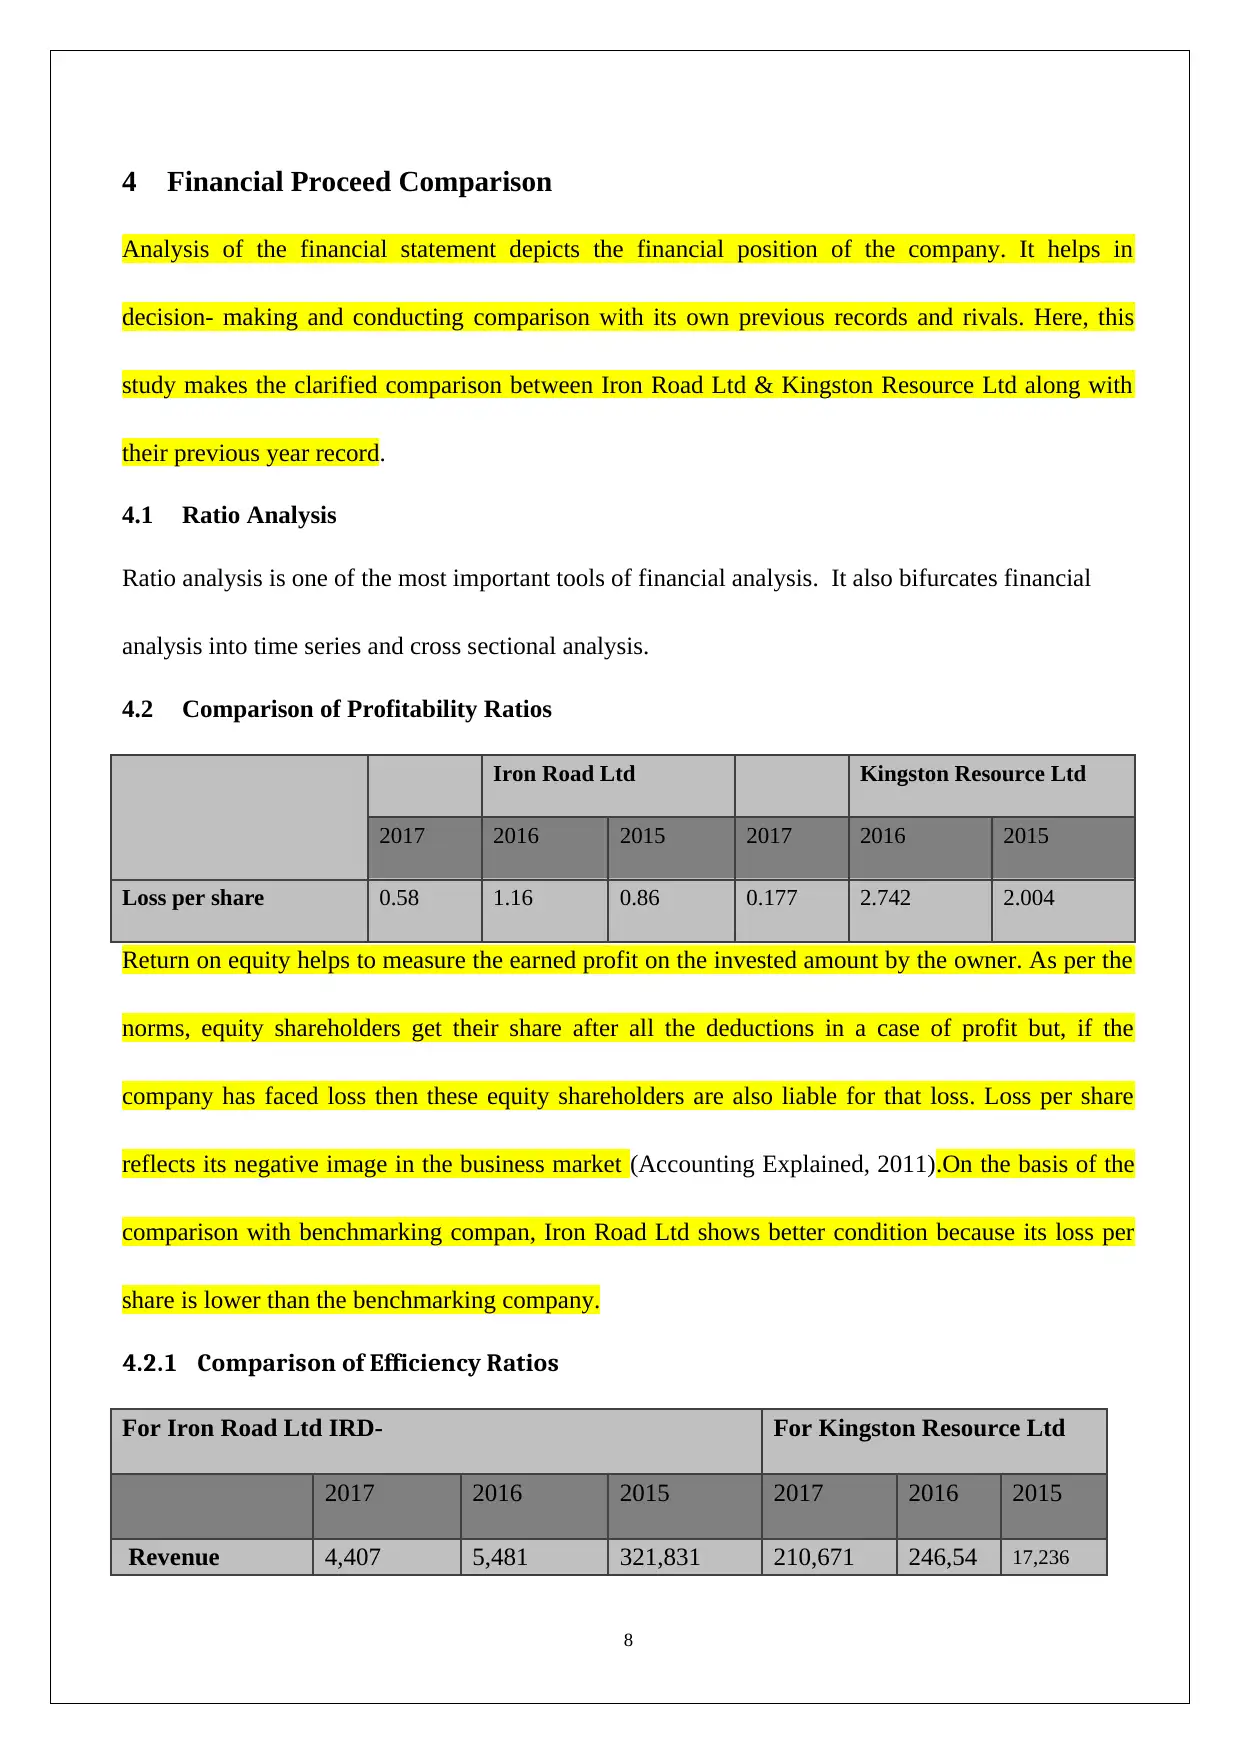
4 Financial Proceed Comparison
Analysis of the financial statement depicts the financial position of the company. It helps in
decision- making and conducting comparison with its own previous records and rivals. Here, this
study makes the clarified comparison between Iron Road Ltd & Kingston Resource Ltd along with
their previous year record.
4.1 Ratio Analysis
Ratio analysis is one of the most important tools of financial analysis. It also bifurcates financial
analysis into time series and cross sectional analysis.
4.2 Comparison of Profitability Ratios
Iron Road Ltd Kingston Resource Ltd
2017 2016 2015 2017 2016 2015
Loss per share 0.58 1.16 0.86 0.177 2.742 2.004
Return on equity helps to measure the earned profit on the invested amount by the owner. As per the
norms, equity shareholders get their share after all the deductions in a case of profit but, if the
company has faced loss then these equity shareholders are also liable for that loss. Loss per share
reflects its negative image in the business market (Accounting Explained, 2011).On the basis of the
comparison with benchmarking compan, Iron Road Ltd shows better condition because its loss per
share is lower than the benchmarking company.
4.2.1 Comparison of Efficiency Ratios
For Iron Road Ltd IRD- For Kingston Resource Ltd
2017 2016 2015 2017 2016 2015
Revenue 4,407 5,481 321,831 210,671 246,54 17,236
8
⊘ This is a preview!⊘
Do you want full access?
Subscribe today to unlock all pages.
Trusted by 1+ million students worldwide
6
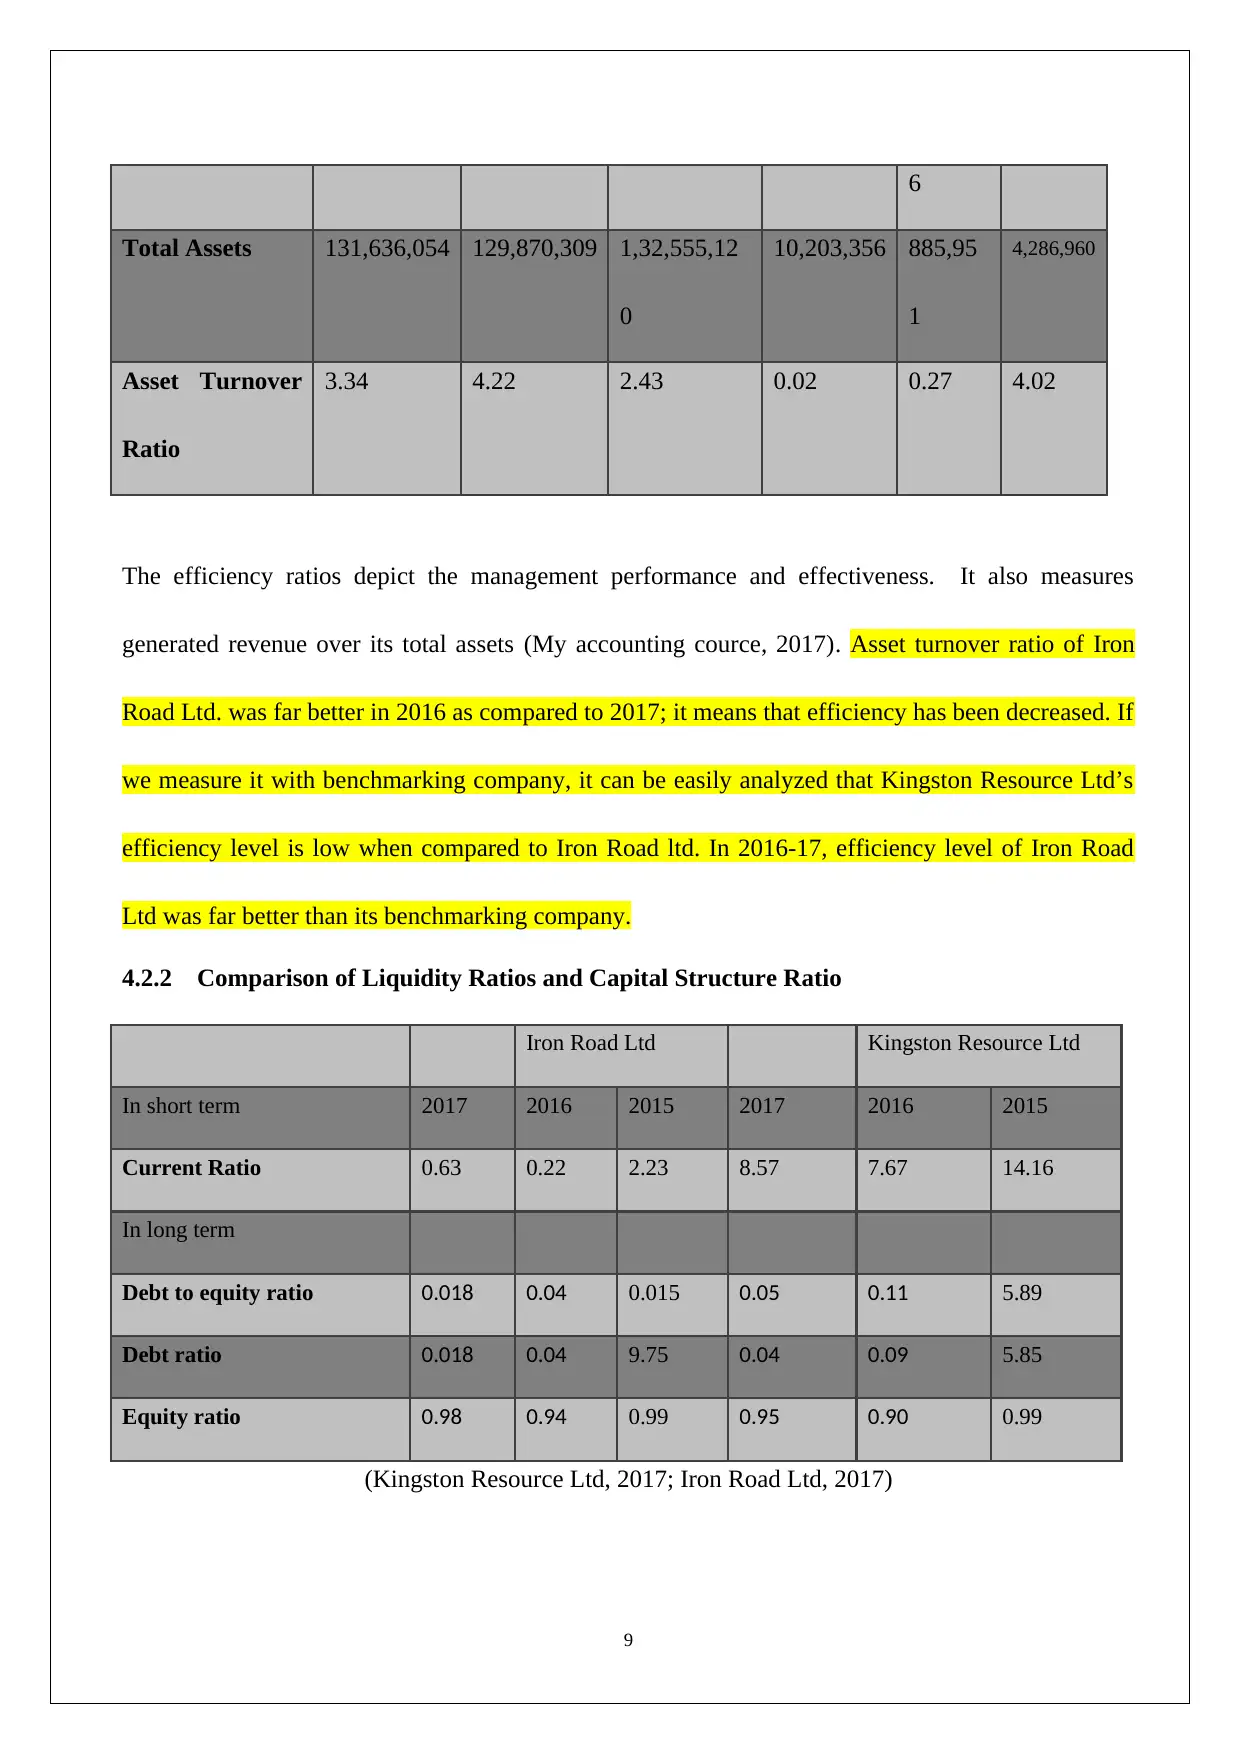
Total Assets 131,636,054 129,870,309 1,32,555,12
0
10,203,356 885,95
1
4,286,960
Asset Turnover
Ratio
3.34 4.22 2.43 0.02 0.27 4.02
The efficiency ratios depict the management performance and effectiveness. It also measures
generated revenue over its total assets (My accounting cource, 2017). Asset turnover ratio of Iron
Road Ltd. was far better in 2016 as compared to 2017; it means that efficiency has been decreased. If
we measure it with benchmarking company, it can be easily analyzed that Kingston Resource Ltd’s
efficiency level is low when compared to Iron Road ltd. In 2016-17, efficiency level of Iron Road
Ltd was far better than its benchmarking company.
4.2.2 Comparison of Liquidity Ratios and Capital Structure Ratio
Iron Road Ltd Kingston Resource Ltd
In short term 2017 2016 2015 2017 2016 2015
Current Ratio 0.63 0.22 2.23 8.57 7.67 14.16
In long term
Debt to equity ratio 0.018 0.04 0.015 0.05 0.11 5.89
Debt ratio 0.018 0.04 9.75 0.04 0.09 5.85
Equity ratio 0.98 0.94 0.99 0.95 0.90 0.99
(Kingston Resource Ltd, 2017; Iron Road Ltd, 2017)
9
Paraphrase This Document
Need a fresh take? Get an instant paraphrase of this document with our AI Paraphraser
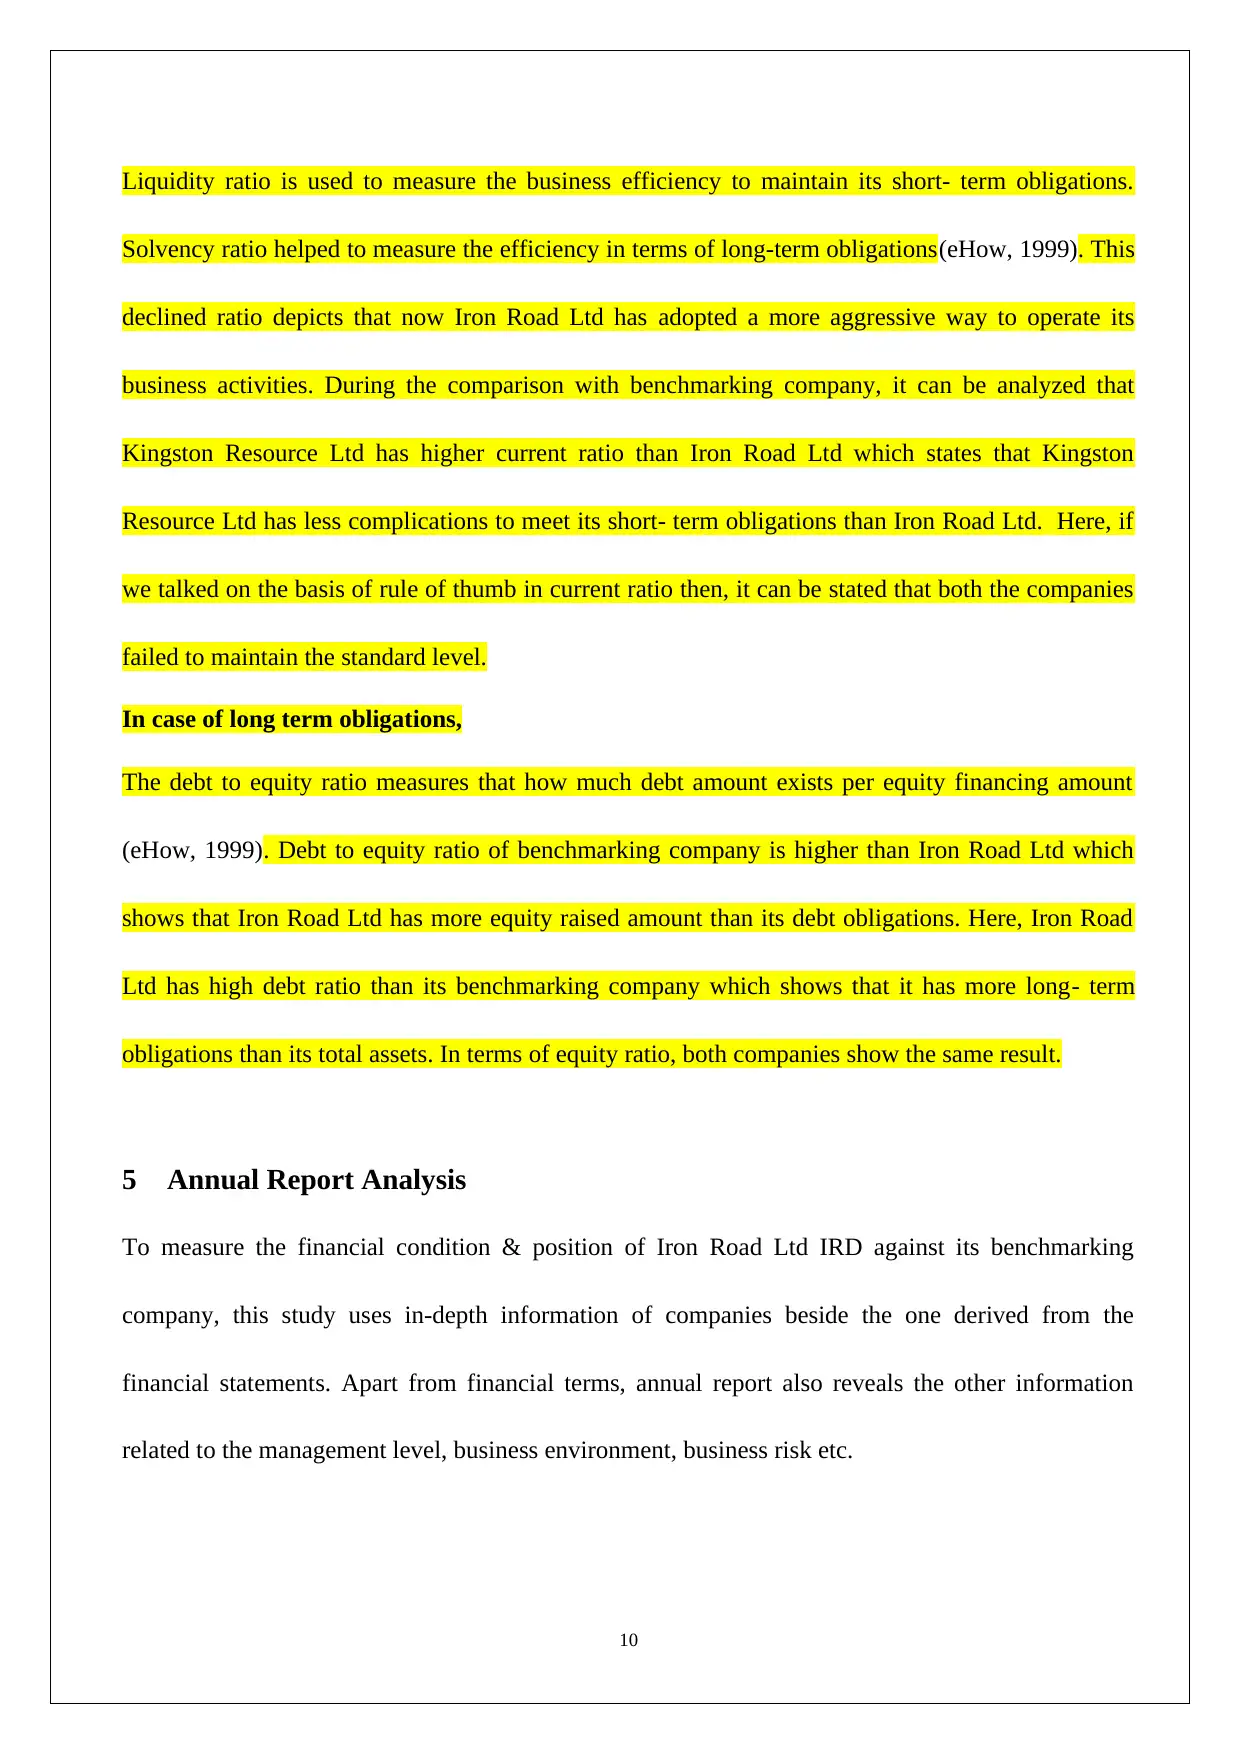
Liquidity ratio is used to measure the business efficiency to maintain its short- term obligations.
Solvency ratio helped to measure the efficiency in terms of long-term obligations(eHow, 1999). This
declined ratio depicts that now Iron Road Ltd has adopted a more aggressive way to operate its
business activities. During the comparison with benchmarking company, it can be analyzed that
Kingston Resource Ltd has higher current ratio than Iron Road Ltd which states that Kingston
Resource Ltd has less complications to meet its short- term obligations than Iron Road Ltd. Here, if
we talked on the basis of rule of thumb in current ratio then, it can be stated that both the companies
failed to maintain the standard level.
In case of long term obligations,
The debt to equity ratio measures that how much debt amount exists per equity financing amount
(eHow, 1999). Debt to equity ratio of benchmarking company is higher than Iron Road Ltd which
shows that Iron Road Ltd has more equity raised amount than its debt obligations. Here, Iron Road
Ltd has high debt ratio than its benchmarking company which shows that it has more long- term
obligations than its total assets. In terms of equity ratio, both companies show the same result.
5 Annual Report Analysis
To measure the financial condition & position of Iron Road Ltd IRD against its benchmarking
company, this study uses in-depth information of companies beside the one derived from the
financial statements. Apart from financial terms, annual report also reveals the other information
related to the management level, business environment, business risk etc.
10
5.1 Strategy of investing on highly competitive market:
An increasing demand for iron ore and mining resources enhance the opportunities for foreseeable
future. So, it is important to find the ways for the companies to operate in the mining industry. To
hunt the growing opportunity, Kingston Resource Ltd KSN decided to expand its business and
entered in Joint Venture Agreement/ Farm in over exploration license 5309. In July 2015, Kingston
Resource Ltd issued 916,666 shares at $0.024 and invested 20,000 $ for its Joint Venture Agreement
over Exploration License 5309. Kingston Resource Ltd also invested 2000 $ invoice to media
relation firm. On management level, Kingston Resource Ltd has done various changes like to replace
its non- executive director and modified remuneration policy(KSN, 2016). Kingston Resource Ltd
also received the confirmation of registration for Research & Development activities(Kingston
Resource Ltd, 2015). Due to high capital expenditure, it affects the financial ratios like Asset
turnover ratio decreased from 2017 to 2016 from 4.22 to 3.34. Current ratio also depicts a great
change from 22.32 (in 2014) to 7.67(in 2016)(KSN Kingston Resource Ltd, 2017).
5.2 Risk Management:
Availability of business risk cannot be neglected; Kingston Resource Ltd’s activities are also
exposed to the variety of market, credit risk, liquidity risk and financial risk. Liquidity & credit risk
are the major issues for Kingston Resource Ltd KSN because these risks directly affect it in
monetary terms. Due to these risks, various ups and down can be measured from its financial
statements along with increased current liabilities, which reflects in its current ratio that declined
from 22.32 to 7.67 in 2016(KSN Kingston Resource Ltd, 2017).Kingston Resource Ltd effectively
11
⊘ This is a preview!⊘
Do you want full access?
Subscribe today to unlock all pages.
Trusted by 1+ million students worldwide
1 out of 18
Related Documents


Your All-in-One AI-Powered Toolkit for Academic Success.
+13062052269
info@desklib.com
Available 24*7 on WhatsApp / Email
![[object Object]](/_next/static/media/star-bottom.7253800d.svg)
Unlock your academic potential
Copyright © 2020–2026 A2Z Services. All Rights Reserved. Developed and managed by ZUCOL.