Comparative Analysis: Islamic and Conventional Mutual Fund Performance
VerifiedAdded on 2020/02/03
|11
|3133
|49
Case Study
AI Summary
This case study provides a detailed analysis of Islamic and conventional mutual funds, comparing their investment strategies, returns, and risk profiles. The study begins with an introduction to investment options and the importance of portfolio diversification, followed by a comparison of Islamic and conventional mutual funds, including a discussion on active versus passive asset allocation. The analysis includes the examination of a portfolio of shares under the FTSE NASDAQ DUBAI SHARIAH INDEX, highlighting the performance of passive asset allocation. It further explores the application of active and passive strategies in Islamic asset management, using real-world examples like the impact of Brexit on market fluctuations. The case study also provides a comparative analysis of the returns of Tata ethnic fund and HDFC mid cap opportunity fund, along with a risk assessment using the Sharpe ratio. The findings highlight the importance of diversification and active management in maximizing returns while managing risks in both Islamic and conventional investment scenarios. The study concludes by summarizing the key differences and implications for investors.

CASE STUDY
Paraphrase This Document
Need a fresh take? Get an instant paraphrase of this document with our AI Paraphraser
TABLE OF CONTENTS
INTRODUCTION...........................................................................................................................3
Answer 1..........................................................................................................................................3
Answer 2..........................................................................................................................................5
Answer 3..........................................................................................................................................7
(A) Return...............................................................................................................................7
(B) Analyze individual level of risk.......................................................................................8
© Profitability of investment in long run...............................................................................9
CONCLUSION................................................................................................................................9
REFERENCES..............................................................................................................................11
APPENDIX..................................................................................................................................................12
Table 1Portfolio of shares that comes under FTSE NASDAQ DUBAI SHARIAH INDEX.........3
Table 2: Sharpe ratio of Tata ethic fund..........................................................................................8
Table 3: Sharpe ratio of HDFC mid cap opportunity fund..............................................................8
INTRODUCTION
In today era, numbers of investment options are available to the investors. Each financial
instrument has some positive or negative points. Needs of investors also different from each
other. Every investor wants to earn maximum profit at minimum risk. Hence, portfolio is
prepared in this report. Portfolio is prepared in balanced manner by considering number of
factors. Mutual funds are other safe heavens where investors are increasingly make investment.
In this report, Islamic and conventional mutual fund returns are compared with each other. In
line to this active and passive asset allocation is also discussed in the report in terms of their
suitability to Islamic mutual fund. By giving relevant example importance of active asset
allocation is explained in the report.
Answer 1
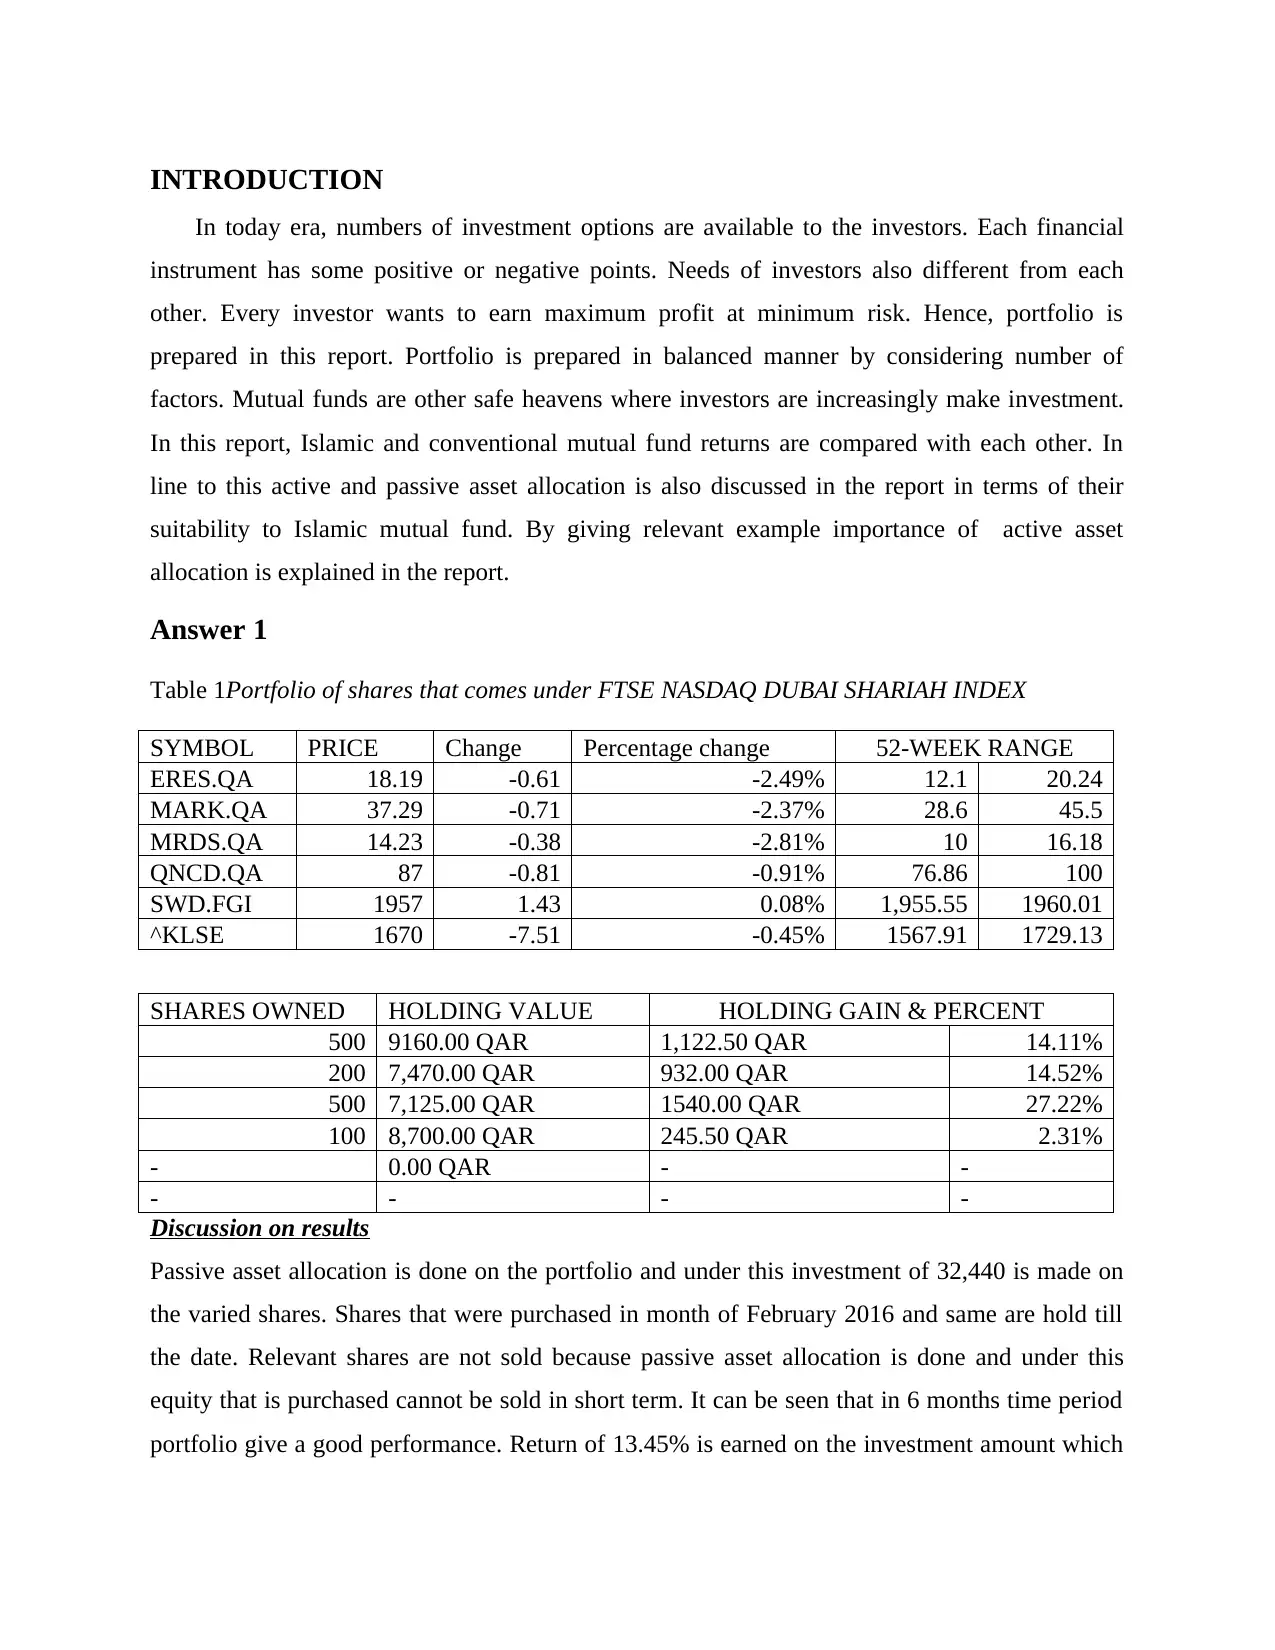
Table 1Portfolio of shares that comes under FTSE NASDAQ DUBAI SHARIAH INDEX
SYMBOL PRICE Change Percentage change 52-WEEK RANGE
ERES.QA 18.19 -0.61 -2.49% 12.1 20.24
MARK.QA 37.29 -0.71 -2.37% 28.6 45.5
MRDS.QA 14.23 -0.38 -2.81% 10 16.18
QNCD.QA 87 -0.81 -0.91% 76.86 100
SWD.FGI 1957 1.43 0.08% 1,955.55 1960.01
^KLSE 1670 -7.51 -0.45% 1567.91 1729.13
SHARES OWNED HOLDING VALUE HOLDING GAIN & PERCENT
500 9160.00 QAR 1,122.50 QAR 14.11%
200 7,470.00 QAR 932.00 QAR 14.52%
500 7,125.00 QAR 1540.00 QAR 27.22%
100 8,700.00 QAR 245.50 QAR 2.31%
- 0.00 QAR - -
- - - -
Discussion on results
Passive asset allocation is done on the portfolio and under this investment of 32,440 is made on
the varied shares. Shares that were purchased in month of February 2016 and same are hold till
the date. Relevant shares are not sold because passive asset allocation is done and under this
equity that is purchased cannot be sold in short term. It can be seen that in 6 months time period
portfolio give a good performance. Return of 13.45% is earned on the investment amount which
In today era, numbers of investment options are available to the investors. Each financial
instrument has some positive or negative points. Needs of investors also different from each
other. Every investor wants to earn maximum profit at minimum risk. Hence, portfolio is
prepared in this report. Portfolio is prepared in balanced manner by considering number of
factors. Mutual funds are other safe heavens where investors are increasingly make investment.
In this report, Islamic and conventional mutual fund returns are compared with each other. In
line to this active and passive asset allocation is also discussed in the report in terms of their
suitability to Islamic mutual fund. By giving relevant example importance of active asset
allocation is explained in the report.
Answer 1
Table 1Portfolio of shares that comes under FTSE NASDAQ DUBAI SHARIAH INDEX
SYMBOL PRICE Change Percentage change 52-WEEK RANGE
ERES.QA 18.19 -0.61 -2.49% 12.1 20.24
MARK.QA 37.29 -0.71 -2.37% 28.6 45.5
MRDS.QA 14.23 -0.38 -2.81% 10 16.18
QNCD.QA 87 -0.81 -0.91% 76.86 100
SWD.FGI 1957 1.43 0.08% 1,955.55 1960.01
^KLSE 1670 -7.51 -0.45% 1567.91 1729.13
SHARES OWNED HOLDING VALUE HOLDING GAIN & PERCENT
500 9160.00 QAR 1,122.50 QAR 14.11%
200 7,470.00 QAR 932.00 QAR 14.52%
500 7,125.00 QAR 1540.00 QAR 27.22%
100 8,700.00 QAR 245.50 QAR 2.31%
- 0.00 QAR - -
- - - -
Discussion on results
Passive asset allocation is done on the portfolio and under this investment of 32,440 is made on
the varied shares. Shares that were purchased in month of February 2016 and same are hold till
the date. Relevant shares are not sold because passive asset allocation is done and under this
equity that is purchased cannot be sold in short term. It can be seen that in 6 months time period
portfolio give a good performance. Return of 13.45% is earned on the investment amount which
⊘ This is a preview!⊘
Do you want full access?
Subscribe today to unlock all pages.
Trusted by 1+ million students worldwide
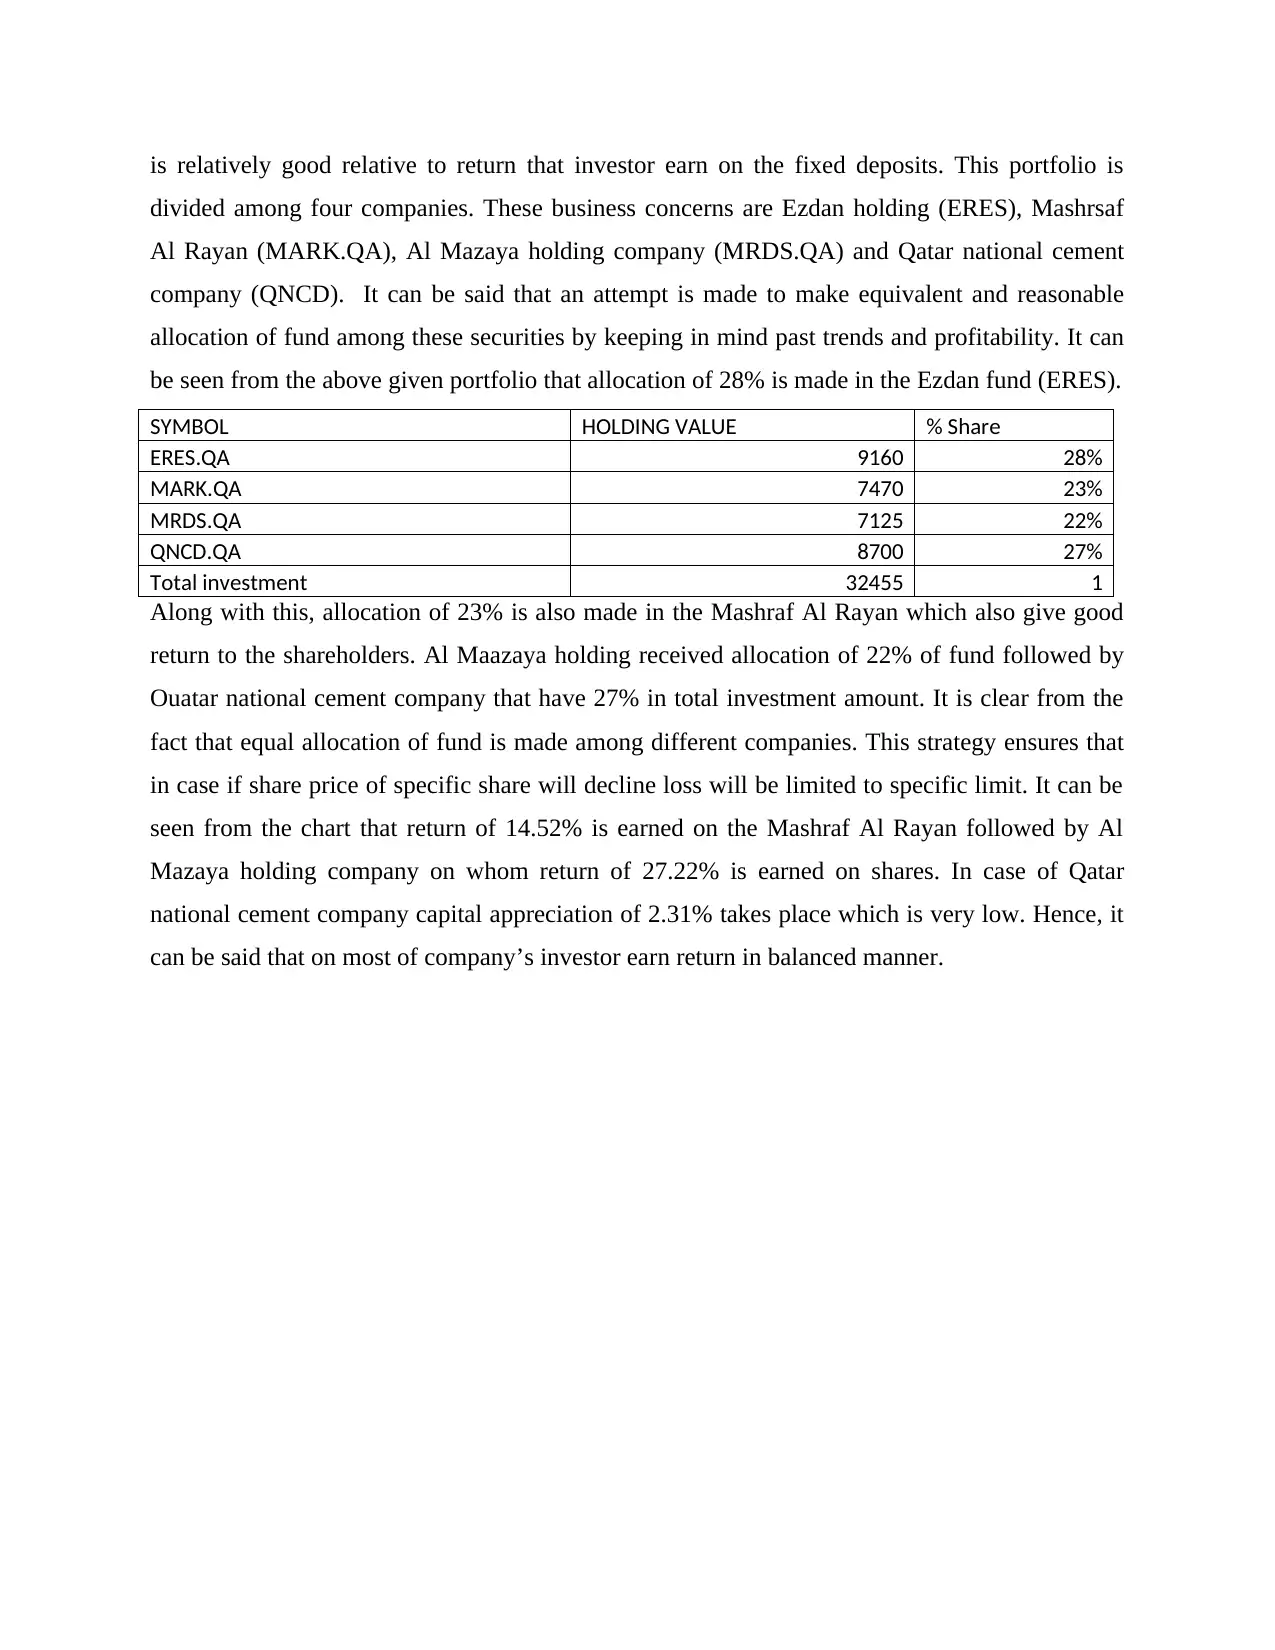
is relatively good relative to return that investor earn on the fixed deposits. This portfolio is
divided among four companies. These business concerns are Ezdan holding (ERES), Mashrsaf
Al Rayan (MARK.QA), Al Mazaya holding company (MRDS.QA) and Qatar national cement
company (QNCD). It can be said that an attempt is made to make equivalent and reasonable
allocation of fund among these securities by keeping in mind past trends and profitability. It can
be seen from the above given portfolio that allocation of 28% is made in the Ezdan fund (ERES).
SYMBOL HOLDING VALUE % Share
ERES.QA 9160 28%
MARK.QA 7470 23%
MRDS.QA 7125 22%
QNCD.QA 8700 27%
Total investment 32455 1
Along with this, allocation of 23% is also made in the Mashraf Al Rayan which also give good
return to the shareholders. Al Maazaya holding received allocation of 22% of fund followed by
Ouatar national cement company that have 27% in total investment amount. It is clear from the
fact that equal allocation of fund is made among different companies. This strategy ensures that
in case if share price of specific share will decline loss will be limited to specific limit. It can be
seen from the chart that return of 14.52% is earned on the Mashraf Al Rayan followed by Al
Mazaya holding company on whom return of 27.22% is earned on shares. In case of Qatar
national cement company capital appreciation of 2.31% takes place which is very low. Hence, it
can be said that on most of company’s investor earn return in balanced manner.
Paraphrase This Document
Need a fresh take? Get an instant paraphrase of this document with our AI Paraphraser
Answer 2
There are two kinds of strategies that are employed in the investment by fund managers.
Active and passive strategy is two different approaches that are followed by the fund managers.
In active tactics, often portfolio is changed and according to the situation, shares are sold and buy
in the stock market. Inverse to this, other investment tactic is passive under which buy and hold
approach is followed. In this, investor buys shares and holds them for long term (Hoepner,
Rammal and Rezec, 2011). Those fund managers who make investment in the shares believe in
efficient market hypothesis theory. They think that shares are always valued at fair price and they
always incorporate the impact of any news that come in the market. Hence, one cannot beat
market returns and make extra profit on shares. This technique is not useful in Islamic asset
management. This is because; Islamic fund management is not different from other types of
funds. In Islamic fund management investment on banks and firms are not made that produce
items that are prohibited for consumption in Islam like alcohol. On this basis, it can be said that
under Islamic asset management, investment in companies of specific sectors is not made. So,
the fundamental question arises, that is, can passive asset allocation or passive investment
strategy be fruitful for earning maximum returns on assets that come under Islamic asset
management or not? In my point of view, passive asset allocation is not useful in Islamic asset
management as it indicates the professional investment controlling of Shariah compliant
securities like equity, Sukuk and others. Islamic asset management is focused on equitable
wealth distribution (Hassan and Mahlknecht, 2011). Thus, generating a wealth is essence of
Islamic asset management.
This objective cannot be achieved by using passive asset allocation. This is because; if
this approach will be followed then fund manager will buy and hold securities for long term. In
current time period, economic conditions are changing at a fast pace. Stock markets are very
sensitive. This is proved from the fact that when news come that specific nation GDP will get
decline then turmoil is observed in the market and index value falls sharply or vice-verse. In case
of Islamic asset management, if passive allocation approach will be followed then even shares
value erode portfolio will not change by fund manager (Farook, Kabir Hassan and Lanis, 2011).
Results will like, return of portfolio of securities that come under Islamic asset management will
get decline and wealth will not be generated. Hence, by following passive asset allocation
approach, wealth cannot be generated specially in short term.
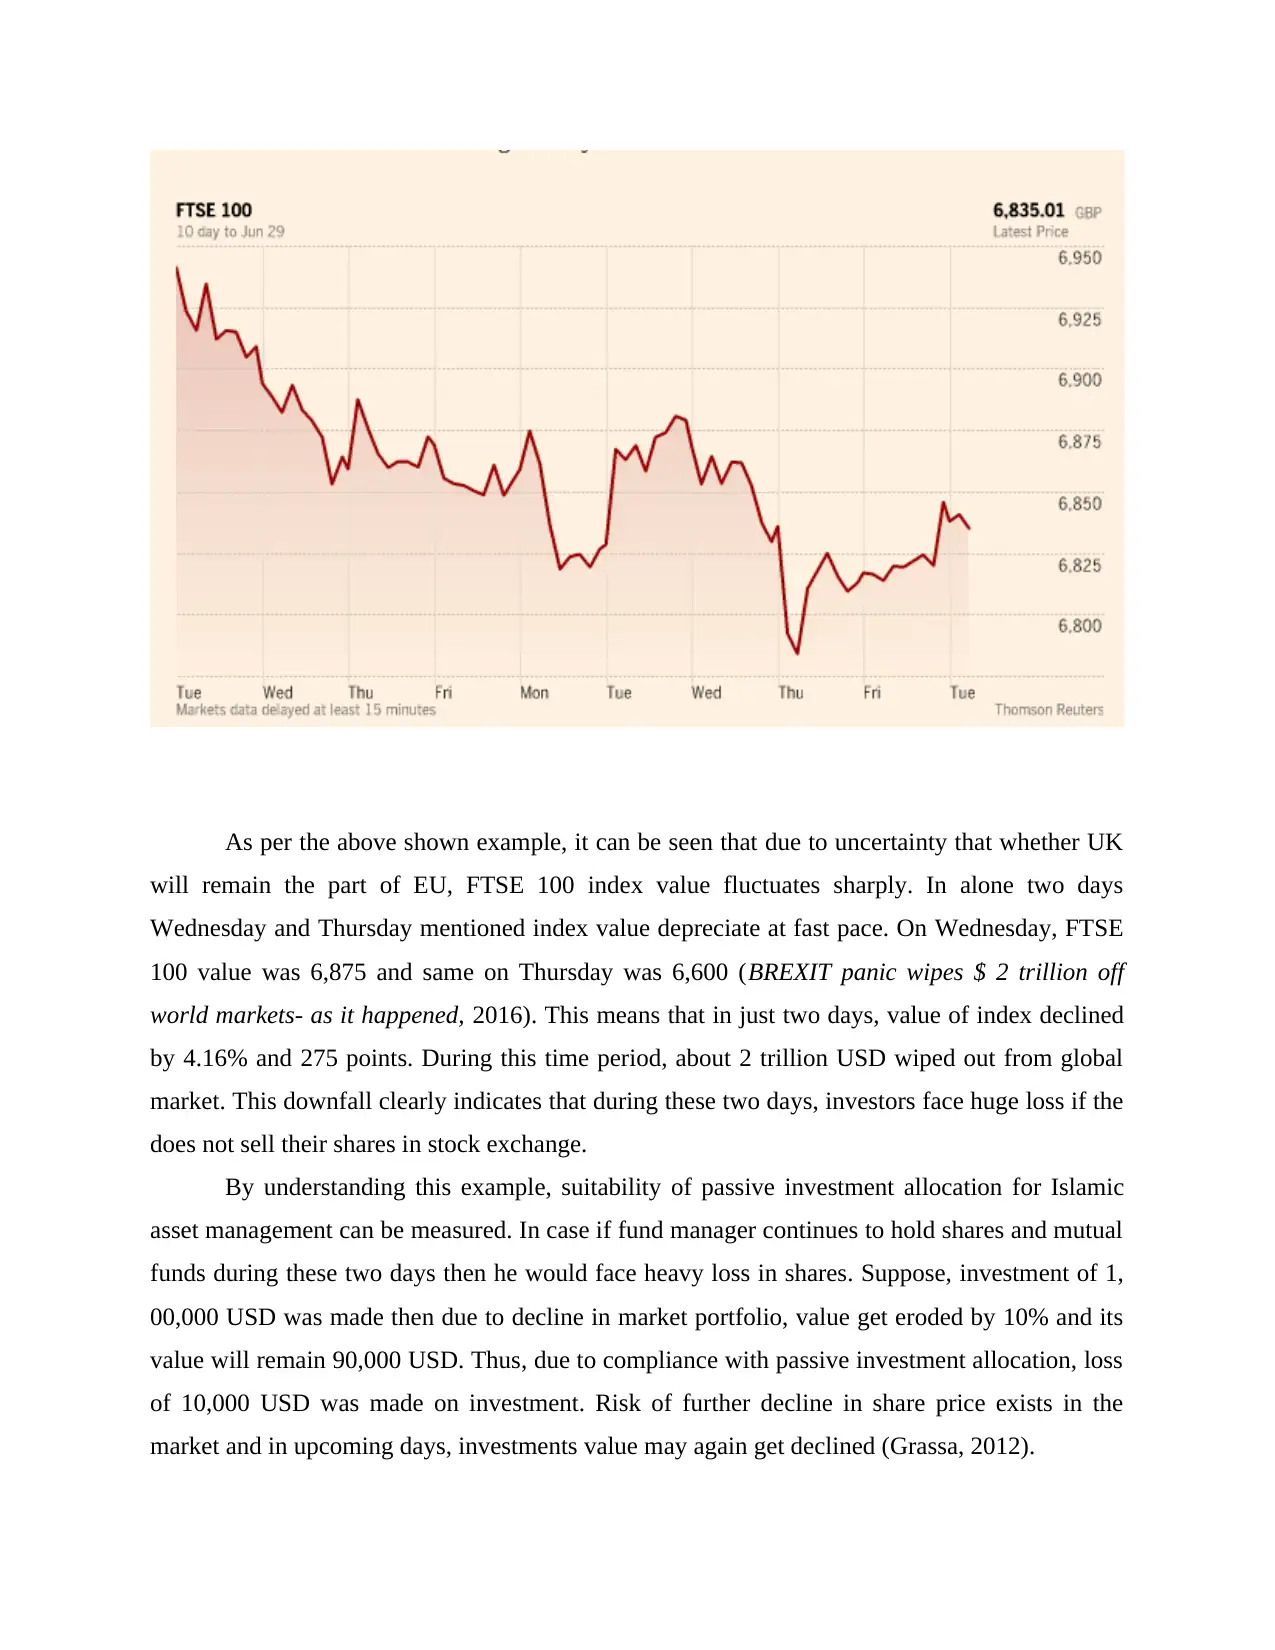
As per the above shown example, it can be seen that due to uncertainty that whether UK
will remain the part of EU, FTSE 100 index value fluctuates sharply. In alone two days
Wednesday and Thursday mentioned index value depreciate at fast pace. On Wednesday, FTSE
100 value was 6,875 and same on Thursday was 6,600 (BREXIT panic wipes $ 2 trillion off
world markets- as it happened, 2016). This means that in just two days, value of index declined
by 4.16% and 275 points. During this time period, about 2 trillion USD wiped out from global
market. This downfall clearly indicates that during these two days, investors face huge loss if the
does not sell their shares in stock exchange.
By understanding this example, suitability of passive investment allocation for Islamic
asset management can be measured. In case if fund manager continues to hold shares and mutual
funds during these two days then he would face heavy loss in shares. Suppose, investment of 1,
00,000 USD was made then due to decline in market portfolio, value get eroded by 10% and its
value will remain 90,000 USD. Thus, due to compliance with passive investment allocation, loss
of 10,000 USD was made on investment. Risk of further decline in share price exists in the
market and in upcoming days, investments value may again get declined (Grassa, 2012).
⊘ This is a preview!⊘
Do you want full access?
Subscribe today to unlock all pages.
Trusted by 1+ million students worldwide
Contrary to this, if investment is made in Islamic asset management by following active
investment allocation then in that situation fund manager is expected to sale open positions in
stock exchange on Wednesday morning when stock market decline commenced at fast pace. In
situation it was possible that mere loss of 4,000 USD faced by fund manager. Mentioned entity
can make investment of 96,000 USD in bond market or fixed deposit and can earn return of 3-
4%. It can be said that fund manager followed active asset allocation approach then even stock
market was falling it was possible to earn appropriate amount of return. By doing so wealth can
be generated by the fund manager even market was declining. Hence, it is clear from above
example that the main aim of wealth generation of Islamic asset management cannot be achieved
by using passive asset allocation approach (Khan, 2010). This is because by remaining on long
position one cannot prevent erosion in value of securities. Thus, it is not possible to generate
wealth by following passive asset allocation approach when market conditions are not favorable
e for investment.
Answer 3
(A) Return
On year basis on comparison of NAV or net asset value it can be seen that in case of Tata
ethnic fund return percentage is 5.65%. On other hand, HDFC mid cap opportunity fund which is
conventional fund earn a return of 8% on year basis. Tata ethic fund is an Islamic shariah fund
under which investment is made in companies that does not produce products or make available
services that are prohibited in the Islam. On comparison of return it can be seen that HDFC mid
cap opportunity fund is earning good amount of return than Tata ethic fund. In order to compare
return of both mutual funds return of both of them can be compared to the risk free rate of return.
It is a rate that one can earn by making investment in treasury bill (Askari, Iqbal and Mirakhor,
2011). Both mutual fund schemes are giving nearby return to risk free rate of return. On this
ground it can be said that HDFC mid cap opportunity fund and Tata ethnic fund does not give
sufficient return to the unit holders for risk they take on the investment. However, it is clear that
former fund is giving better return to investors then latter fund. This happened because in Tata
ethnic fund investment is made only in few sectors like Automotive, IT, Pharmaceutical, Cement
and construction, Engineering, Consumer non durable, Service and Telecommunication.
Contrary to this, in case of HDFC mid cap opportunity fund investment is made in 23 sectors
Paraphrase This Document
Need a fresh take? Get an instant paraphrase of this document with our AI Paraphraser
(Karim and Archer, S., 2013). Hence, asset allocation is more diversified in HDFC mid cap
opportunity fund then Tata ethnic fund. Due to less allocation of fund in Tata ethnic fund among
different sectors there is high risk on investment and low return on same. Thus, it is very
important for fund managers to develop well diversified portfolio of equities.
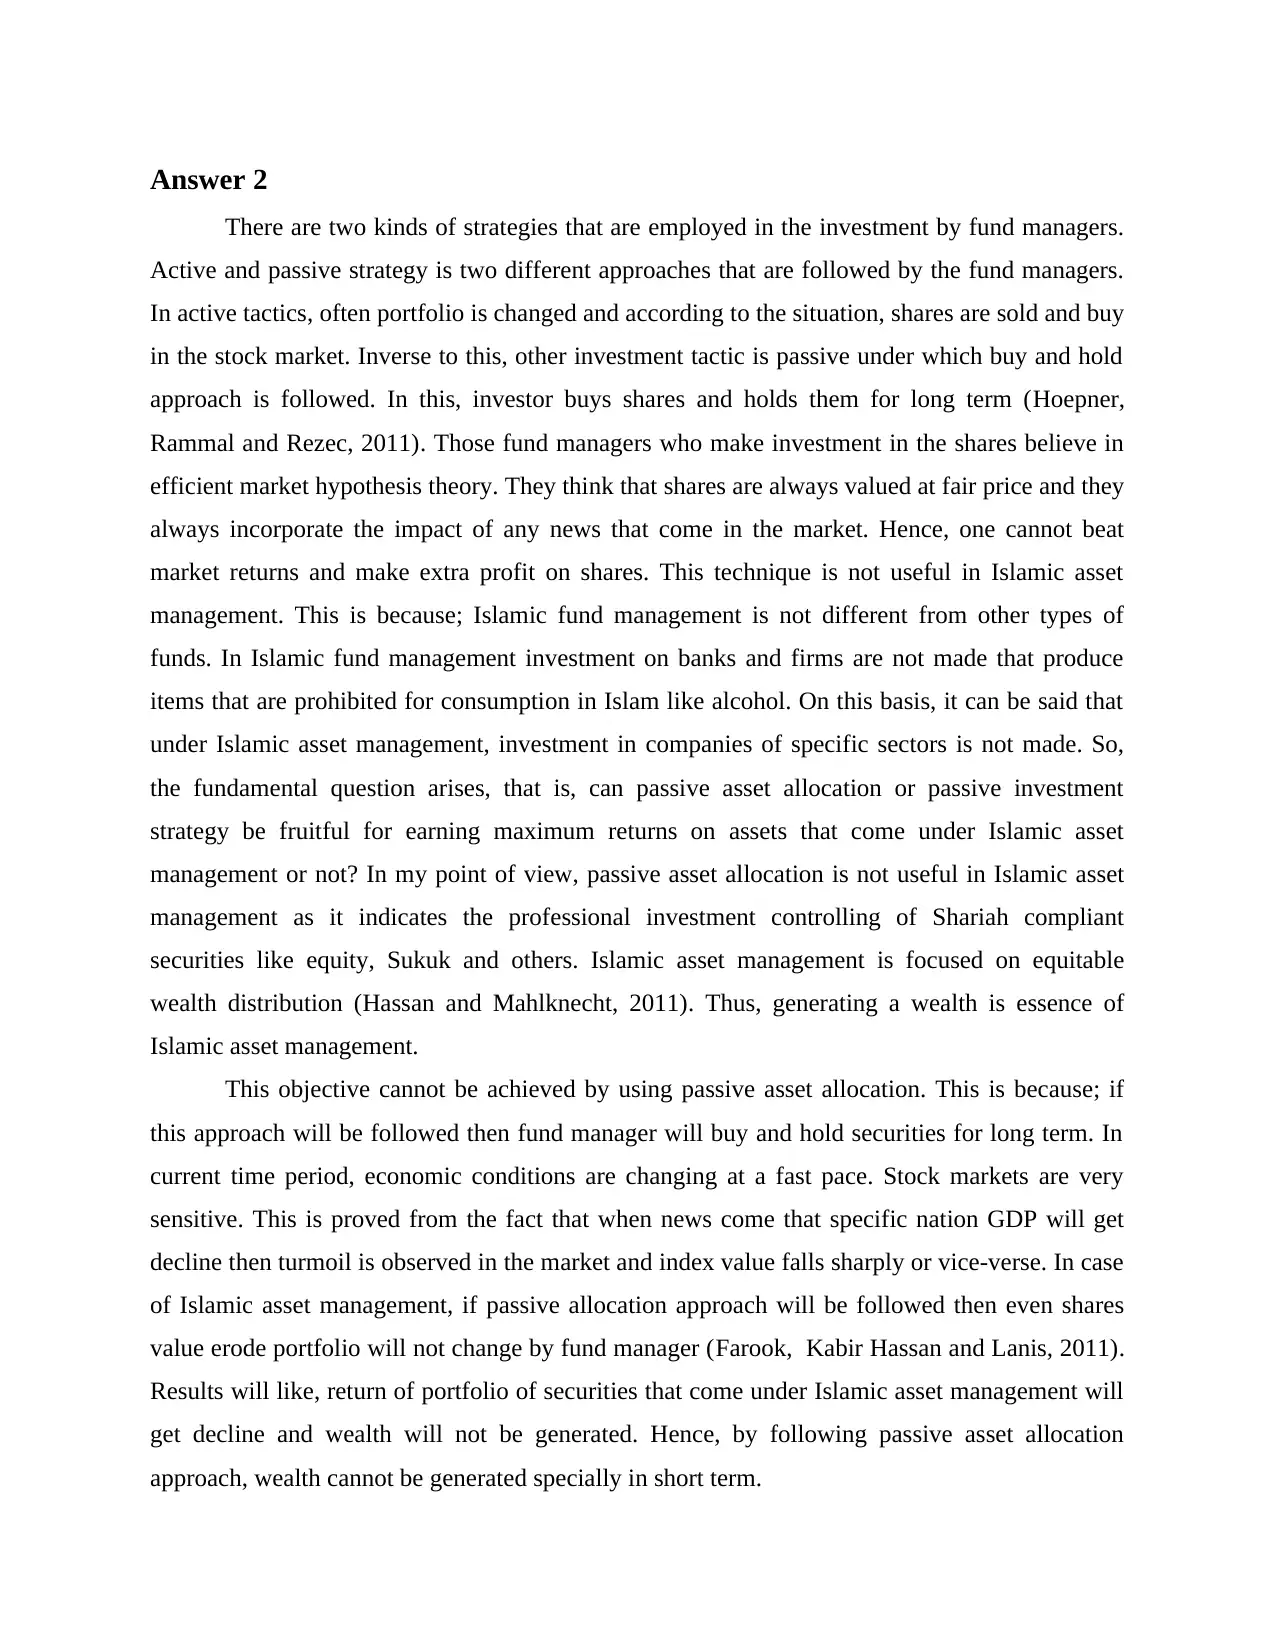
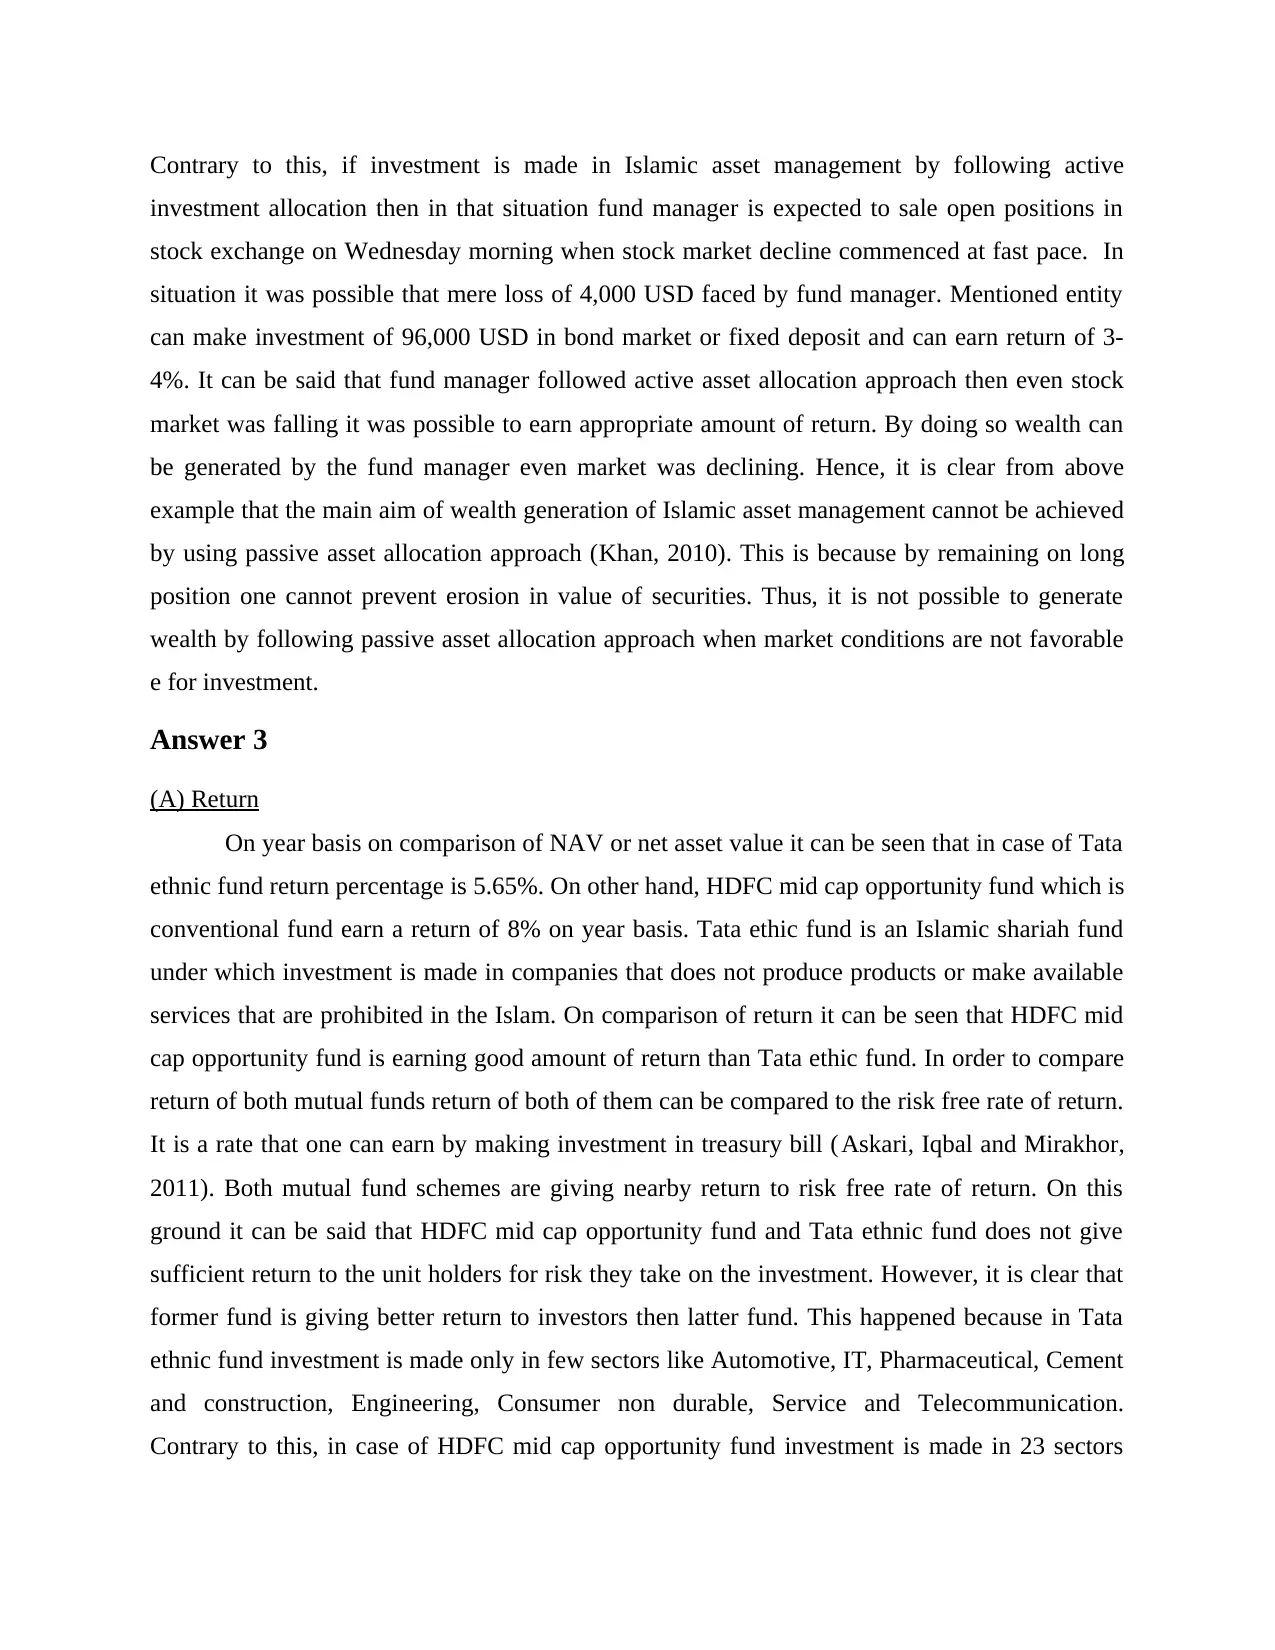
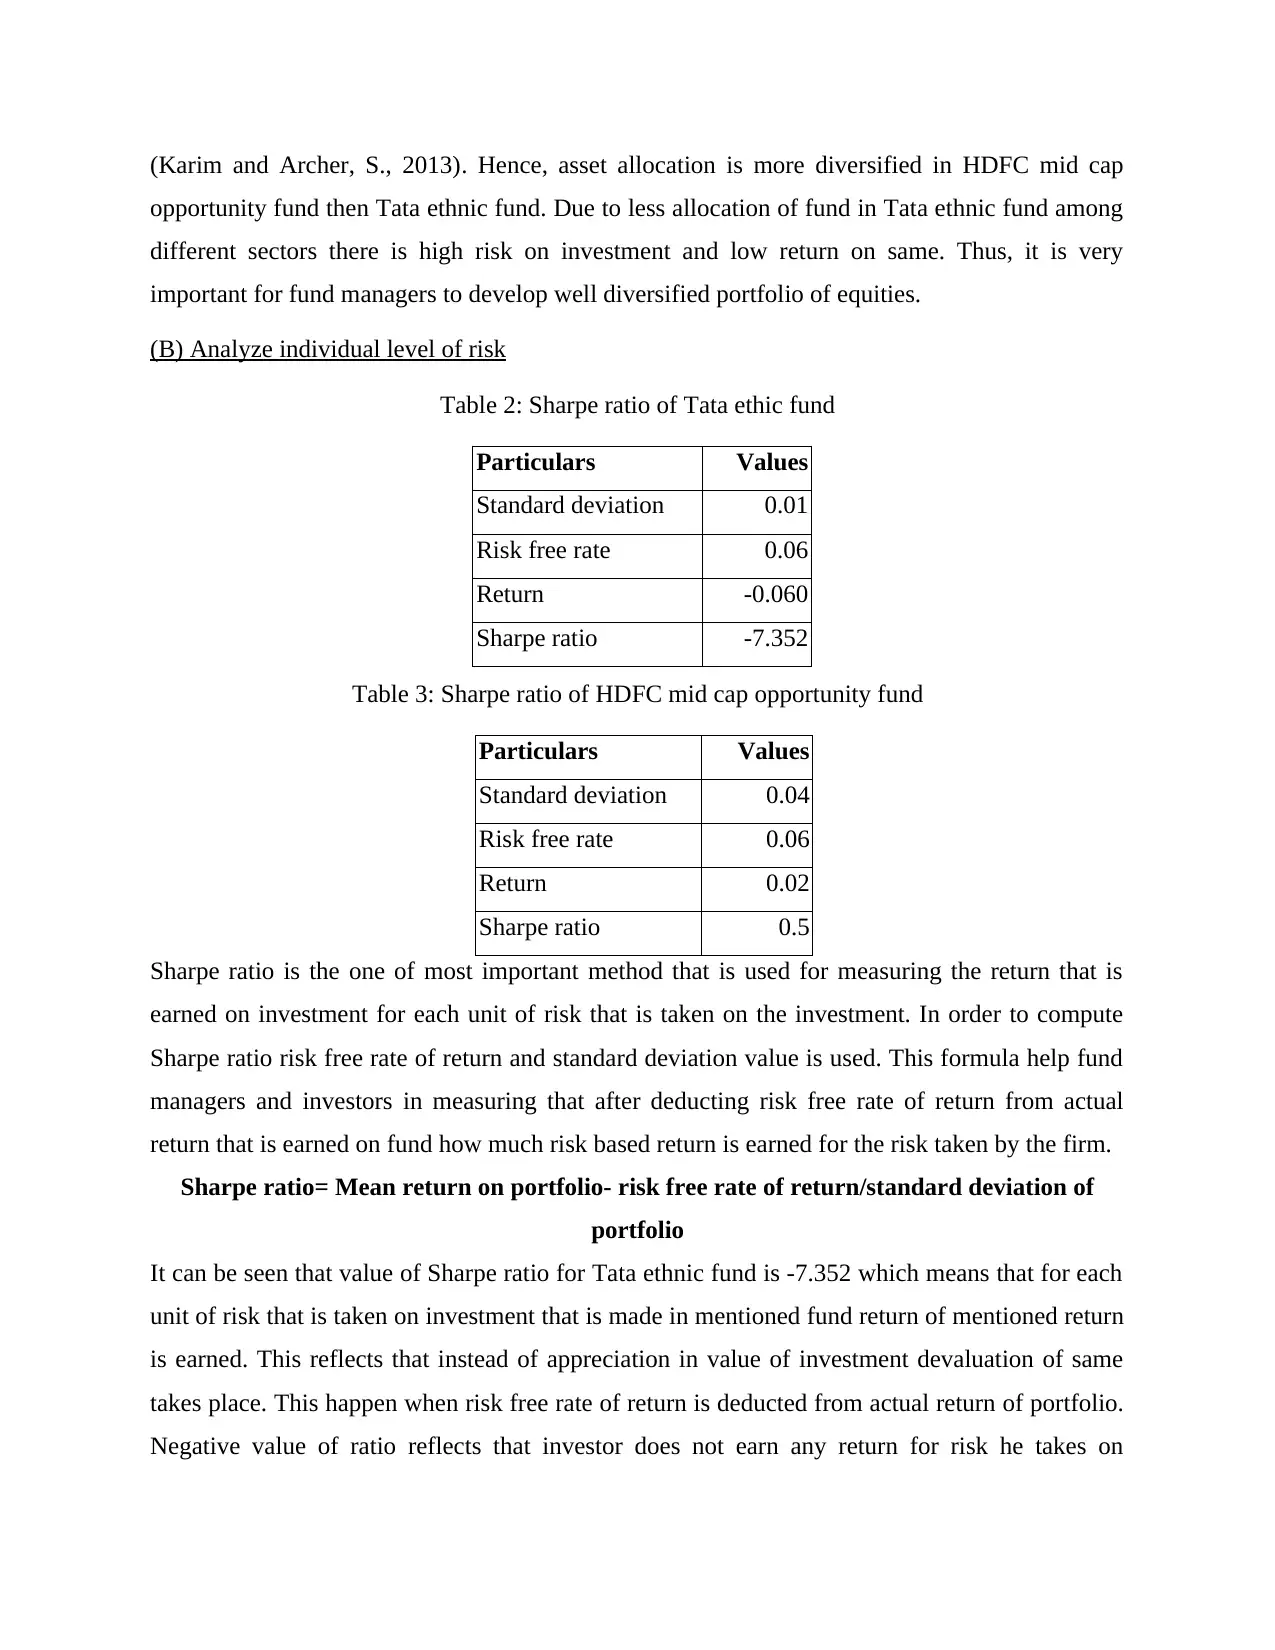
(B) Analyze individual level of risk
Table 2: Sharpe ratio of Tata ethic fund
Particulars Values
Standard deviation 0.01
Risk free rate 0.06
Return -0.060
Sharpe ratio -7.352
Table 3: Sharpe ratio of HDFC mid cap opportunity fund
Particulars Values
Standard deviation 0.04
Risk free rate 0.06
Return 0.02
Sharpe ratio 0.5
Sharpe ratio is the one of most important method that is used for measuring the return that is
earned on investment for each unit of risk that is taken on the investment. In order to compute
Sharpe ratio risk free rate of return and standard deviation value is used. This formula help fund
managers and investors in measuring that after deducting risk free rate of return from actual
return that is earned on fund how much risk based return is earned for the risk taken by the firm.
Sharpe ratio= Mean return on portfolio- risk free rate of return/standard deviation of
portfolio
It can be seen that value of Sharpe ratio for Tata ethnic fund is -7.352 which means that for each
unit of risk that is taken on investment that is made in mentioned fund return of mentioned return
is earned. This reflects that instead of appreciation in value of investment devaluation of same
takes place. This happen when risk free rate of return is deducted from actual return of portfolio.
Negative value of ratio reflects that investor does not earn any return for risk he takes on
opportunity fund then Tata ethnic fund. Due to less allocation of fund in Tata ethnic fund among
different sectors there is high risk on investment and low return on same. Thus, it is very
important for fund managers to develop well diversified portfolio of equities.
(B) Analyze individual level of risk
Table 2: Sharpe ratio of Tata ethic fund
Particulars Values
Standard deviation 0.01
Risk free rate 0.06
Return -0.060
Sharpe ratio -7.352
Table 3: Sharpe ratio of HDFC mid cap opportunity fund
Particulars Values
Standard deviation 0.04
Risk free rate 0.06
Return 0.02
Sharpe ratio 0.5
Sharpe ratio is the one of most important method that is used for measuring the return that is
earned on investment for each unit of risk that is taken on the investment. In order to compute
Sharpe ratio risk free rate of return and standard deviation value is used. This formula help fund
managers and investors in measuring that after deducting risk free rate of return from actual
return that is earned on fund how much risk based return is earned for the risk taken by the firm.
Sharpe ratio= Mean return on portfolio- risk free rate of return/standard deviation of
portfolio
It can be seen that value of Sharpe ratio for Tata ethnic fund is -7.352 which means that for each
unit of risk that is taken on investment that is made in mentioned fund return of mentioned return
is earned. This reflects that instead of appreciation in value of investment devaluation of same
takes place. This happen when risk free rate of return is deducted from actual return of portfolio.
Negative value of ratio reflects that investor does not earn any return for risk he takes on
investment. In case of HDFC mid cap opportunity fund value of Sharpe ratio is 0.5 which means
that investor earn some return on mentioned fund. However, this return is also insufficient.
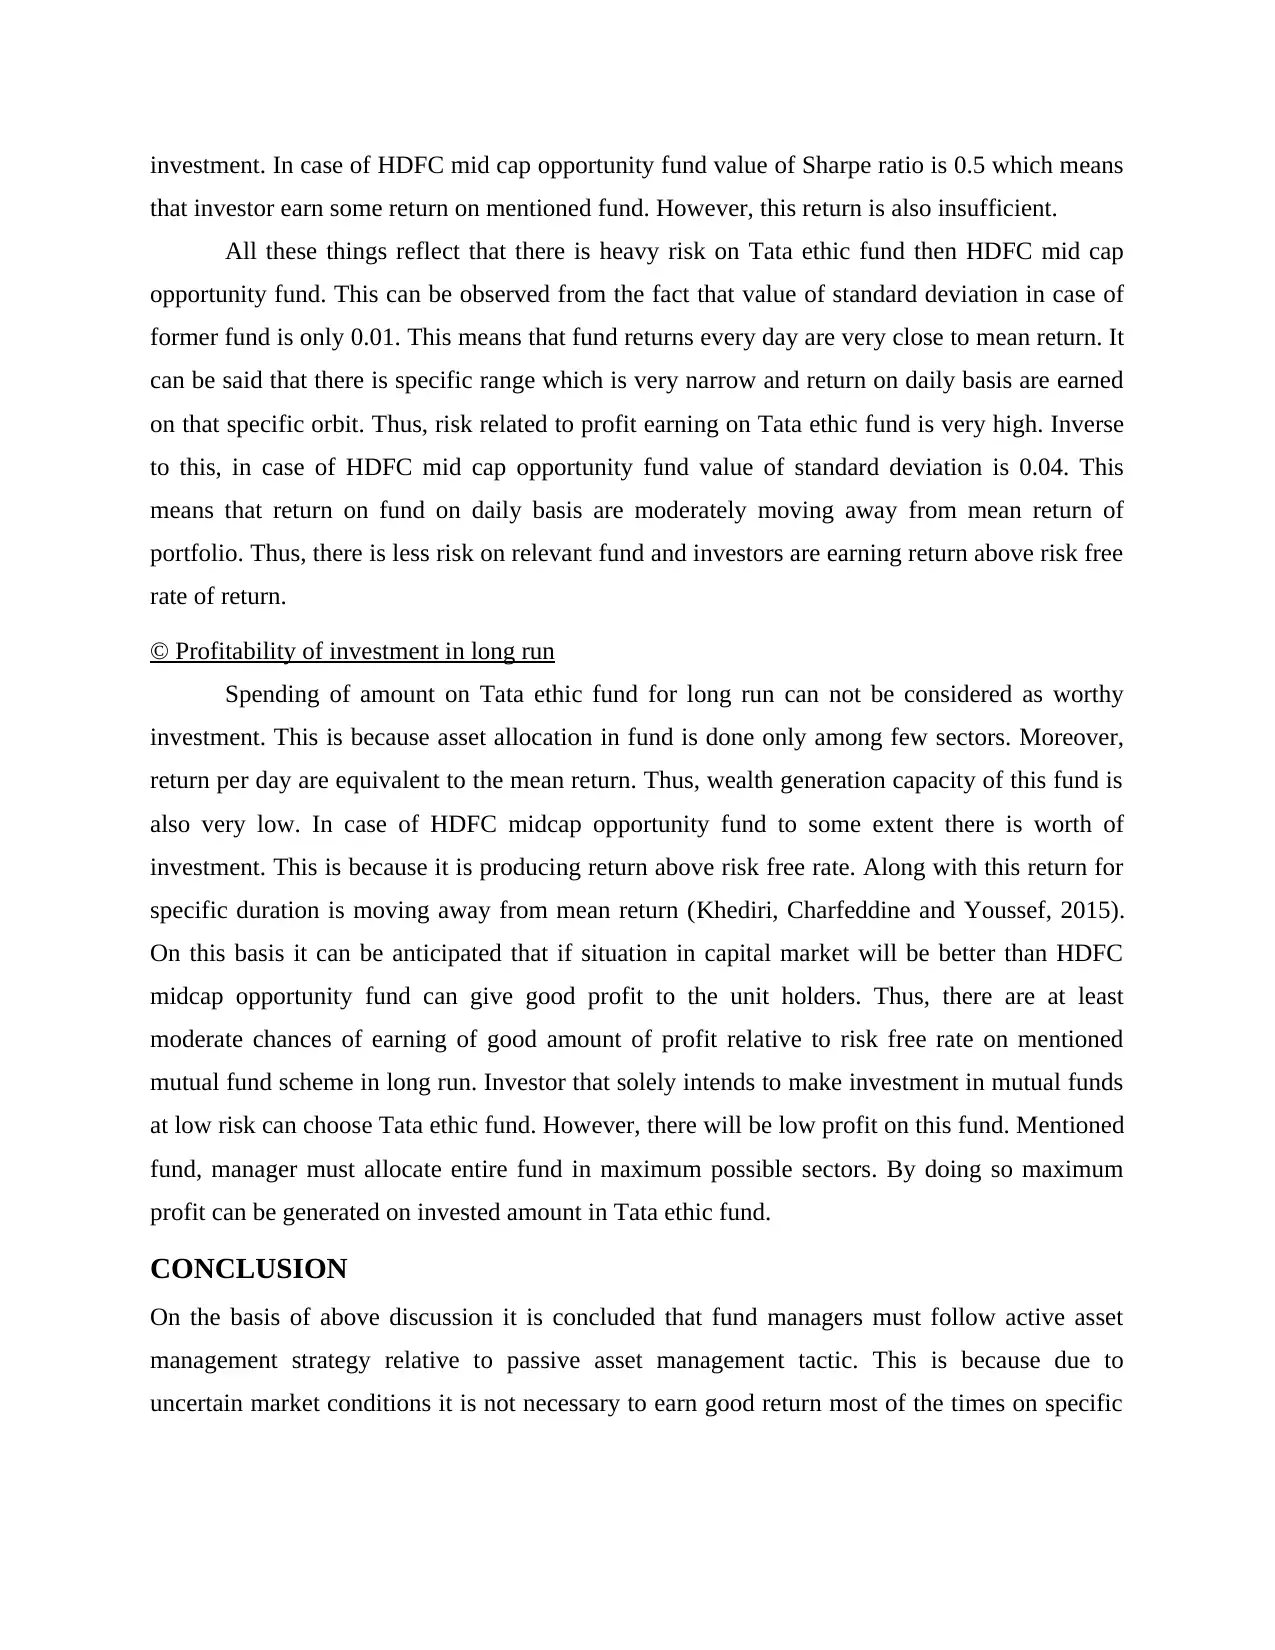
All these things reflect that there is heavy risk on Tata ethic fund then HDFC mid cap
opportunity fund. This can be observed from the fact that value of standard deviation in case of
former fund is only 0.01. This means that fund returns every day are very close to mean return. It
can be said that there is specific range which is very narrow and return on daily basis are earned
on that specific orbit. Thus, risk related to profit earning on Tata ethic fund is very high. Inverse
to this, in case of HDFC mid cap opportunity fund value of standard deviation is 0.04. This
means that return on fund on daily basis are moderately moving away from mean return of
portfolio. Thus, there is less risk on relevant fund and investors are earning return above risk free
rate of return.
© Profitability of investment in long run
Spending of amount on Tata ethic fund for long run can not be considered as worthy
investment. This is because asset allocation in fund is done only among few sectors. Moreover,
return per day are equivalent to the mean return. Thus, wealth generation capacity of this fund is
also very low. In case of HDFC midcap opportunity fund to some extent there is worth of
investment. This is because it is producing return above risk free rate. Along with this return for
specific duration is moving away from mean return (Khediri, Charfeddine and Youssef, 2015).
On this basis it can be anticipated that if situation in capital market will be better than HDFC
midcap opportunity fund can give good profit to the unit holders. Thus, there are at least
moderate chances of earning of good amount of profit relative to risk free rate on mentioned
mutual fund scheme in long run. Investor that solely intends to make investment in mutual funds
at low risk can choose Tata ethic fund. However, there will be low profit on this fund. Mentioned
fund, manager must allocate entire fund in maximum possible sectors. By doing so maximum
profit can be generated on invested amount in Tata ethic fund.
CONCLUSION
On the basis of above discussion it is concluded that fund managers must follow active asset
management strategy relative to passive asset management tactic. This is because due to
uncertain market conditions it is not necessary to earn good return most of the times on specific
that investor earn some return on mentioned fund. However, this return is also insufficient.
All these things reflect that there is heavy risk on Tata ethic fund then HDFC mid cap
opportunity fund. This can be observed from the fact that value of standard deviation in case of
former fund is only 0.01. This means that fund returns every day are very close to mean return. It
can be said that there is specific range which is very narrow and return on daily basis are earned
on that specific orbit. Thus, risk related to profit earning on Tata ethic fund is very high. Inverse
to this, in case of HDFC mid cap opportunity fund value of standard deviation is 0.04. This
means that return on fund on daily basis are moderately moving away from mean return of
portfolio. Thus, there is less risk on relevant fund and investors are earning return above risk free
rate of return.
© Profitability of investment in long run
Spending of amount on Tata ethic fund for long run can not be considered as worthy
investment. This is because asset allocation in fund is done only among few sectors. Moreover,
return per day are equivalent to the mean return. Thus, wealth generation capacity of this fund is
also very low. In case of HDFC midcap opportunity fund to some extent there is worth of
investment. This is because it is producing return above risk free rate. Along with this return for
specific duration is moving away from mean return (Khediri, Charfeddine and Youssef, 2015).
On this basis it can be anticipated that if situation in capital market will be better than HDFC
midcap opportunity fund can give good profit to the unit holders. Thus, there are at least
moderate chances of earning of good amount of profit relative to risk free rate on mentioned
mutual fund scheme in long run. Investor that solely intends to make investment in mutual funds
at low risk can choose Tata ethic fund. However, there will be low profit on this fund. Mentioned
fund, manager must allocate entire fund in maximum possible sectors. By doing so maximum
profit can be generated on invested amount in Tata ethic fund.
CONCLUSION
On the basis of above discussion it is concluded that fund managers must follow active asset
management strategy relative to passive asset management tactic. This is because due to
uncertain market conditions it is not necessary to earn good return most of the times on specific
⊘ This is a preview!⊘
Do you want full access?
Subscribe today to unlock all pages.
Trusted by 1+ million students worldwide

security. It is also concluded that portfolio must be prepared by the fund managers in systematic
and balanced way so that good amount of profit can be earned on the invested amount.
and balanced way so that good amount of profit can be earned on the invested amount.
Paraphrase This Document
Need a fresh take? Get an instant paraphrase of this document with our AI Paraphraser
REFERENCES
Books & journals
Hoepner, A.G., Rammal, H.G. and Rezec, M., 2011. Islamic mutual funds’ financial
performance and international investment style: Evidence from 20 countries. The European
Journal of Finance. 17(9-10). pp.829-850.
Hassan, K. and Mahlknecht, M., 2011. Islamic capital markets: products and strategies John
Wiley & Sons.
Farook, S., Kabir Hassan, M. and Lanis, R., 2011. Determinants of corporate social
responsibility disclosure: The case of Islamic banks. Journal of Islamic Accounting and
Business Research. 2(2). pp.114-141.
Grassa, R., 2012. Islamic banks' income structure and risk: evidence from GCC countries.
Accounting Research Journal. 25(3). pp.227-241.
Khan, F., 2010. How ‘Islamic’is Islamic Banking?. Journal of Economic Behavior &
Organization. 76(3). pp.805-820.
Askari, H., Iqbal, Z. and Mirakhor, A., 2011. New Issues in Islamic Finance and Economics:
Progress and Challenges (Vol. 753). John Wiley & Sons.
Karim, R.A.A. and Archer, S., 2013. Islamic finance: the new regulatory challenge. John Wiley
& Sons.
Khediri, K.B., Charfeddine, L. and Youssef, S.B., 2015. Islamic versus conventional banks in
the GCC countries: A comparative study using classification techniques. Research in
International Business and Finance, 33, pp.75-98.
Online
BREXIT panic wipes $ 2 trillion off world markets- as it happened, 2016. [Online]. Available
through:<https://www.theguardian.com/business/live/2016/jun/24/global-markets-ftse-
pound-uk-leave-eu-brexit-live-updates>. [Accessed on 1st September 2016].
1 out of 11


Your All-in-One AI-Powered Toolkit for Academic Success.
+13062052269
info@desklib.com
Available 24*7 on WhatsApp / Email
![[object Object]](/_next/static/media/star-bottom.7253800d.svg)
Unlock your academic potential
Copyright © 2020–2026 A2Z Services. All Rights Reserved. Developed and managed by ZUCOL.