BUACC5931: ISO 9000 Adoption and Financial Performance in China
VerifiedAdded on 2023/06/07
|12
|3114
|183
Report
AI Summary
This report investigates the financial performance of Chinese firms before and after adopting the ISO 9000 quality standard. Utilizing data from the Chinese Statistical Bureau in 2008, the study examines the impact of ISO 9000 adoption on revenue and profit across various service industries. The report reviews existing literature on the benefits of ISO 9000 certification, including its potential to increase contracts and improve business links. The methodology involves descriptive and inferential statistics, including independent sample t-tests and one-way ANOVA. Findings indicate a statistically significant difference in sales and profits between certified and non-certified industries, with certified industries generally performing better. The report analyzes revenue and profit across different industry types within the certified group, revealing variations in performance. The analysis reveals that the adoption of ISO 9000 certification has led to an increase in sales and profits irrespective of the industry type. The report concludes with a discussion of the findings, limitations, and suggestions for future research.
Running Head: RESEARCH AND STATISTICAL METHODS FOR BUSINESS
Research and Statistical Methods for Business
Name of the Student
Name of the University
Author Note
Research and Statistical Methods for Business
Name of the Student
Name of the University
Author Note
Paraphrase This Document
Need a fresh take? Get an instant paraphrase of this document with our AI Paraphraser
1RESEARCH AND STATISTICAL METHODS FOR BUSINESS
Executive Summary
The present report investigates the financial performance of Chinese firms before and after the
adoption ISO 9000 quality standard. Information for the analysis was collected by the statistical
bureau of China in 2008. Previous studies on the subjects provides mixed response for the
adoption of the quality standard. It has been found that firms from all over the world have gained
financially due to the adoption of ISO 9000. From the present study we find that adoption of ISO
9000 has led to an increase in sales and profits of the organizations. In addition, it is also found
that the increase in financial performance is irrespective of the industry type.
2RESEARCH AND STATISTICAL METHODS FOR BUSINESS
Table of Contents
Executive Summary.........................................................................................................................1
Introduction......................................................................................................................................3
Background..................................................................................................................................3
Purpose........................................................................................................................................3
The report hypothesis..................................................................................................................3
Format and methodology.............................................................................................................3
Literature review..............................................................................................................................3
Methodology description and justification of existing data-set.......................................................6
Hypotheses:..................................................................................................................................6
Analyses and findings......................................................................................................................6
Discussion and managerial advises.................................................................................................9
Limitations and directions for future research.................................................................................9
Conclusion.....................................................................................................................................10
Reference.......................................................................................................................................11
⊘ This is a preview!⊘
Do you want full access?
Subscribe today to unlock all pages.
Trusted by 1+ million students worldwide
3RESEARCH AND STATISTICAL METHODS FOR BUSINESS
Introduction
Background
The ISO 9000 series of quality standards were first published in 1987. The initial quality
standard was christened ISO 9000:1987. The intent of the organization was to frame rules for
quality of products and services with special reference to trade between two organizations or
countries. The standards have evolved over time (Nally, 2016).
Purpose
The purpose of the study is to investigate the adoption of ISO 9000 by organizations in
China. The information has been collected from service industries in China in 2008.
The report hypothesis
Adoption of ISO certification improves the revenue of the industry
Adoption of ISO certification improves the operating profit of the industry
Format and methodology
In order to investigate the information collected by Chinese National Bureau of statistics
previous literature is studied. Previous information on the benefits of adoption of ISO
certification is used as a secondary resource. The primary data collected by China is initially
investigated through the use of descriptive statistics. Further investigation into the data uses
inferential statistics. MS Excel is used for the statistical analysis.
Literature review
ISO 9000 are a series of standards intended to improve the quality management of
organizations. The standards provide a guideline to organizations to improve the quality and
service of its products. Research done by Chatzoglou, Chatzoudes, & Kipraios (2015), suggests
that the improvement in quality of products and services has a direct relation to the financial
performance of an organization.
Zhu, Cordeiro, & Sarkis (2013) studied the adoption of ISO 9000 standards in China.
They found that implementation of the standard was a consequence of both national as well as
international pressure. They found that factors like sales, environmental regulation and industrial
practices lead to the adoption of the standard.
Wang & Sarkis (2013), in their article “Investigating the relationship of sustainable
supply chain management with corporate financial performance” investigated the relation of
financial performance and supply chain activities of firms. They investigated financial
performance of 500 companies from USA from information in Bloomberg. The researchers
found that implementation of ISO 9000 has a positive relation with financial performance of the
organizations.
Adoption of ISO 9000 certification may lead to an increase in the number of contracts
with both domestic and international players (Javorcik & Sawada, 2018). Moreover, the
performance of the firm may also increase due to the continuous improvement feature of ISO
9000. In addition, due to increase in the number of contacts of the organization the firm gets
increased business links. The increased business links puts pressure of the organization to
improve the quality of products and services.
Paraphrase This Document
Need a fresh take? Get an instant paraphrase of this document with our AI Paraphraser
4RESEARCH AND STATISTICAL METHODS FOR BUSINESS
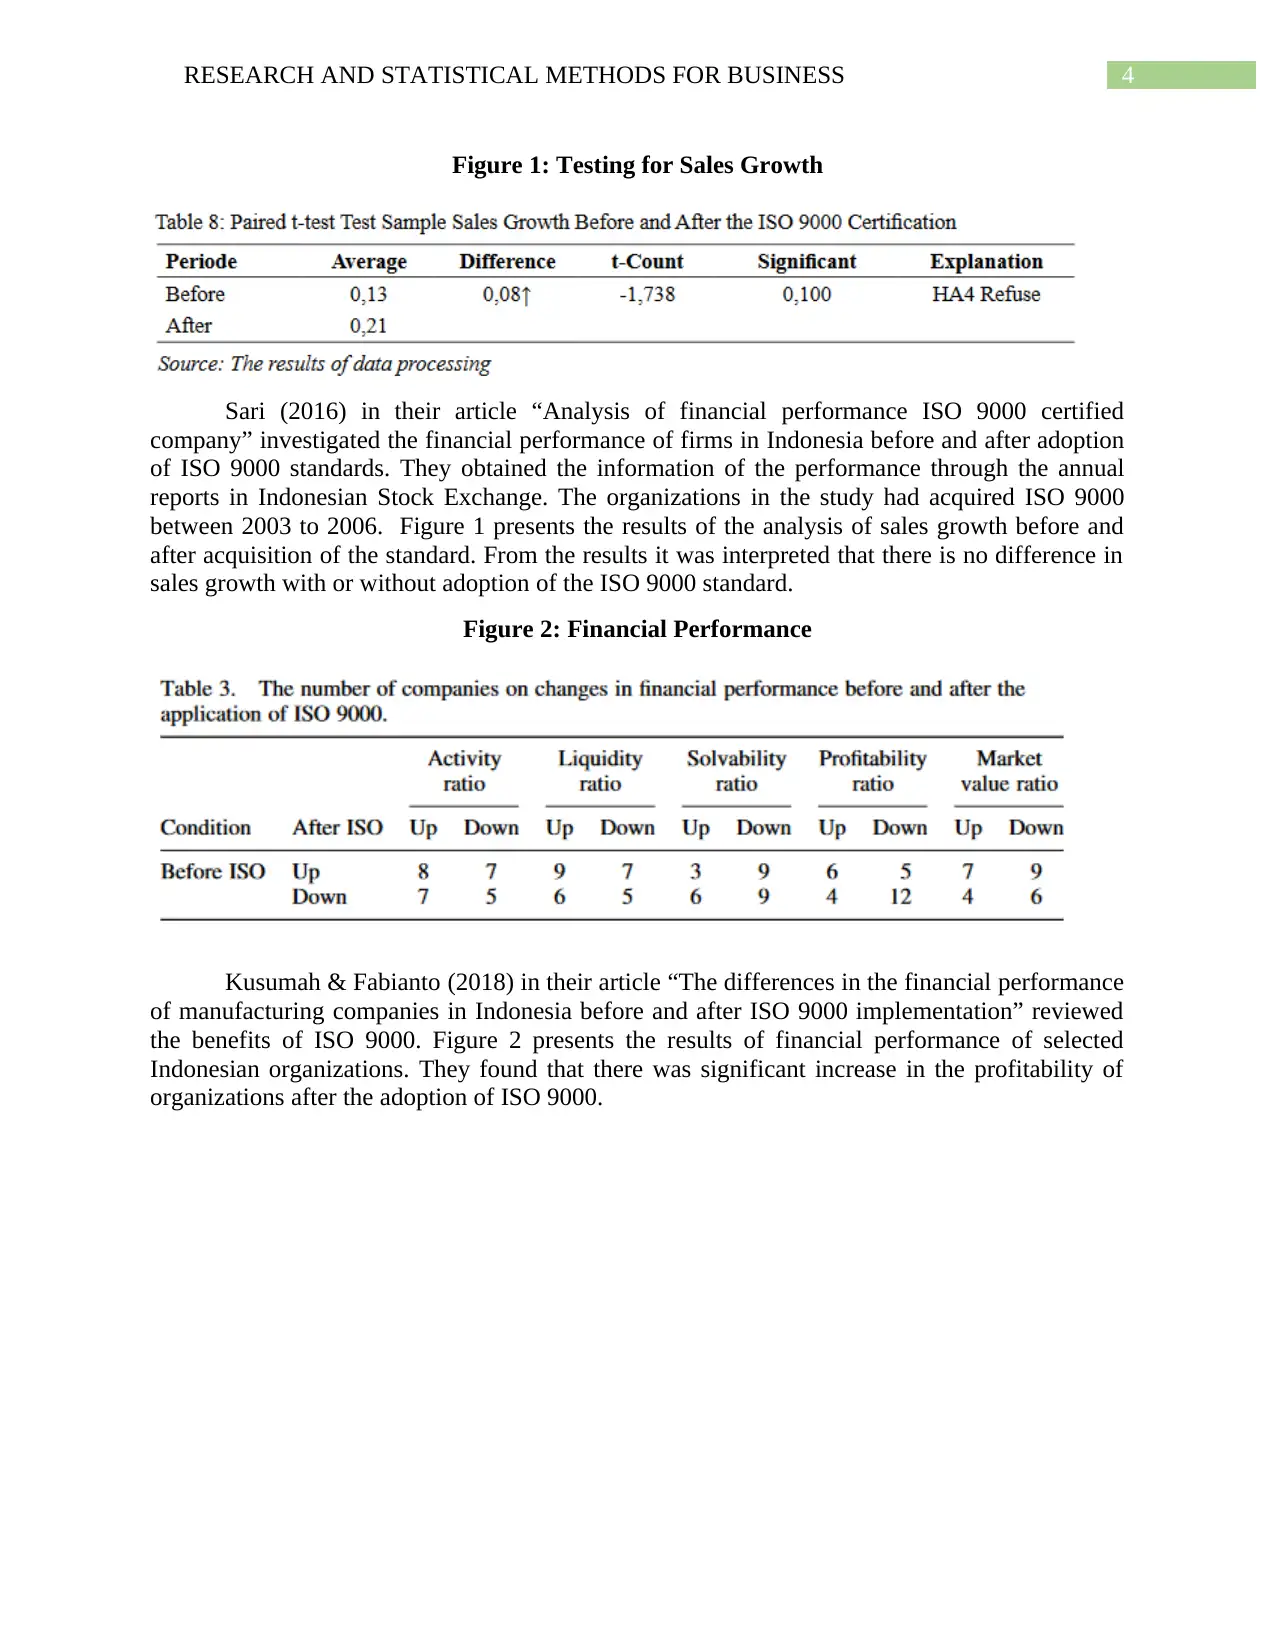
Figure 1: Testing for Sales Growth
Sari (2016) in their article “Analysis of financial performance ISO 9000 certified
company” investigated the financial performance of firms in Indonesia before and after adoption
of ISO 9000 standards. They obtained the information of the performance through the annual
reports in Indonesian Stock Exchange. The organizations in the study had acquired ISO 9000
between 2003 to 2006. Figure 1 presents the results of the analysis of sales growth before and
after acquisition of the standard. From the results it was interpreted that there is no difference in
sales growth with or without adoption of the ISO 9000 standard.
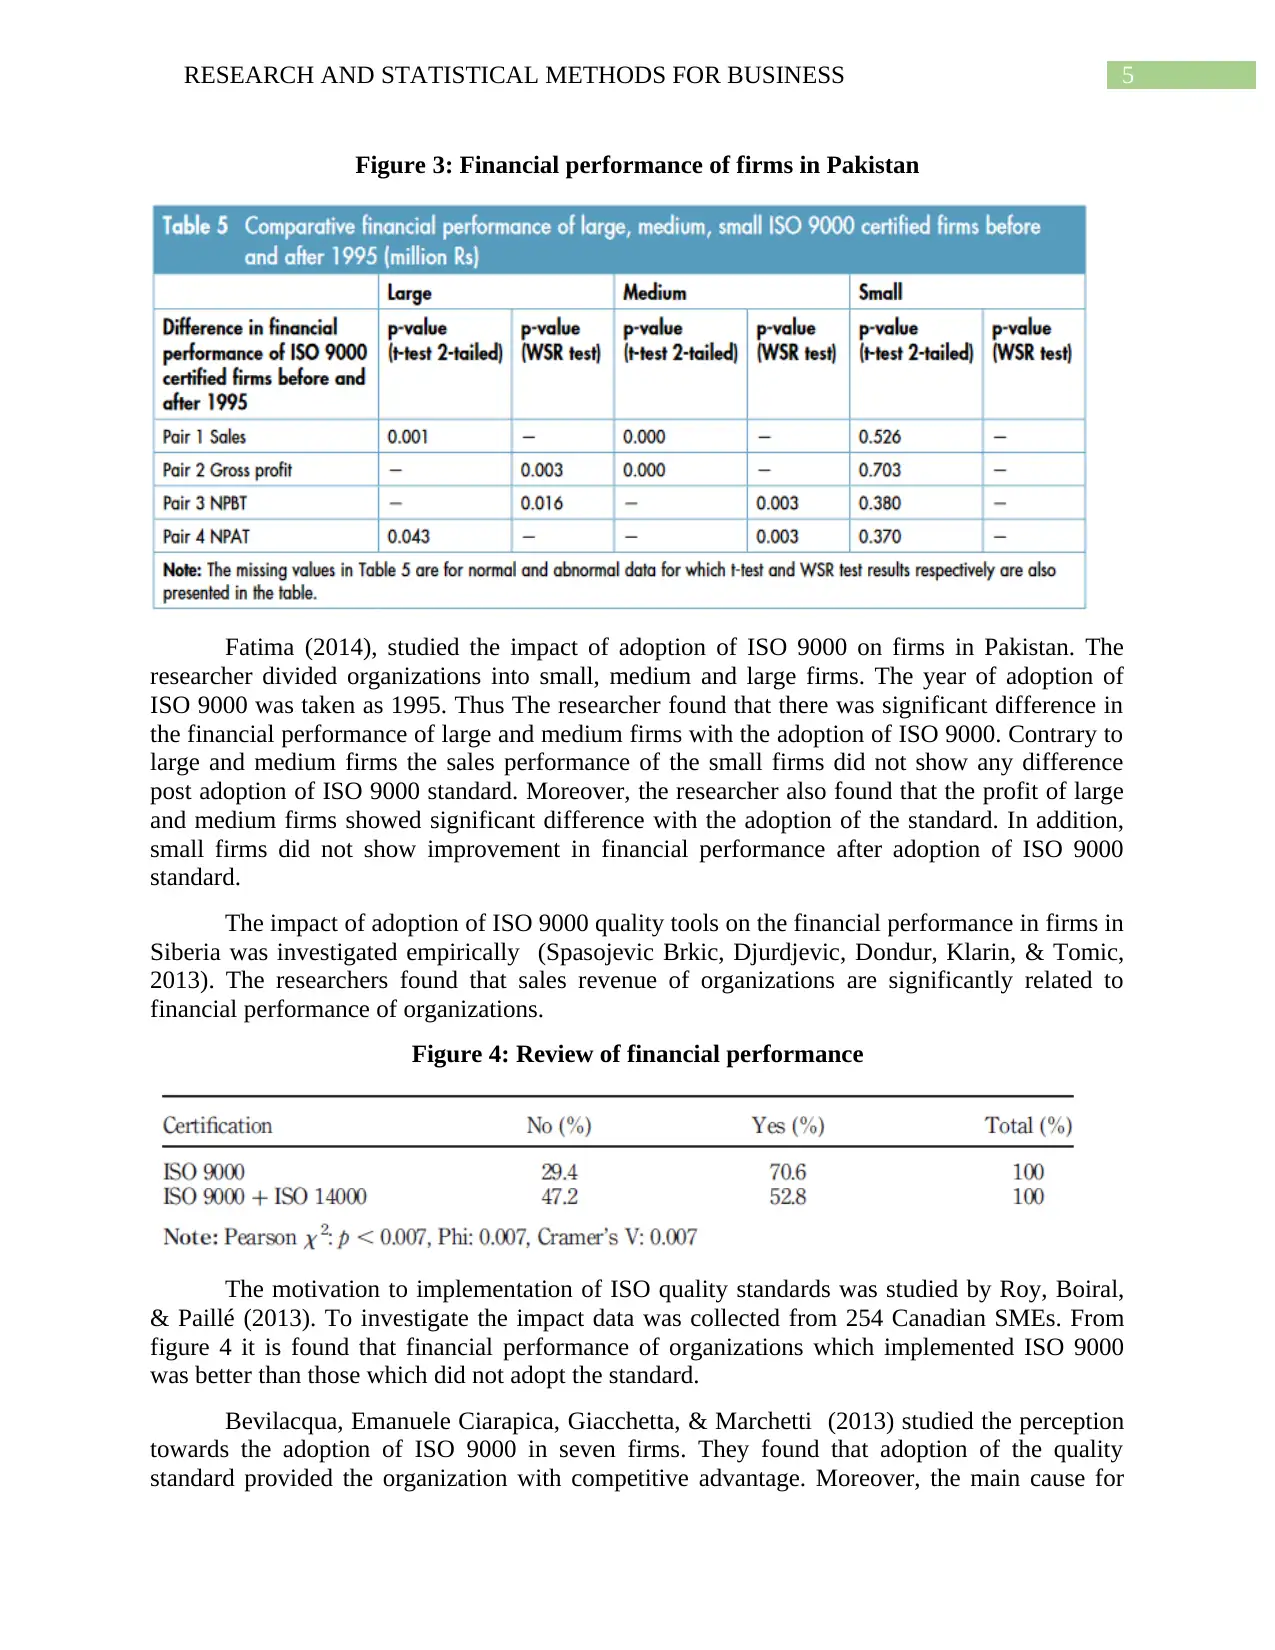
Figure 2: Financial Performance
Kusumah & Fabianto (2018) in their article “The differences in the financial performance
of manufacturing companies in Indonesia before and after ISO 9000 implementation” reviewed
the benefits of ISO 9000. Figure 2 presents the results of financial performance of selected
Indonesian organizations. They found that there was significant increase in the profitability of
organizations after the adoption of ISO 9000.
Figure 1: Testing for Sales Growth
Sari (2016) in their article “Analysis of financial performance ISO 9000 certified
company” investigated the financial performance of firms in Indonesia before and after adoption
of ISO 9000 standards. They obtained the information of the performance through the annual
reports in Indonesian Stock Exchange. The organizations in the study had acquired ISO 9000
between 2003 to 2006. Figure 1 presents the results of the analysis of sales growth before and
after acquisition of the standard. From the results it was interpreted that there is no difference in
sales growth with or without adoption of the ISO 9000 standard.
Figure 2: Financial Performance
Kusumah & Fabianto (2018) in their article “The differences in the financial performance
of manufacturing companies in Indonesia before and after ISO 9000 implementation” reviewed
the benefits of ISO 9000. Figure 2 presents the results of financial performance of selected
Indonesian organizations. They found that there was significant increase in the profitability of
organizations after the adoption of ISO 9000.
5RESEARCH AND STATISTICAL METHODS FOR BUSINESS
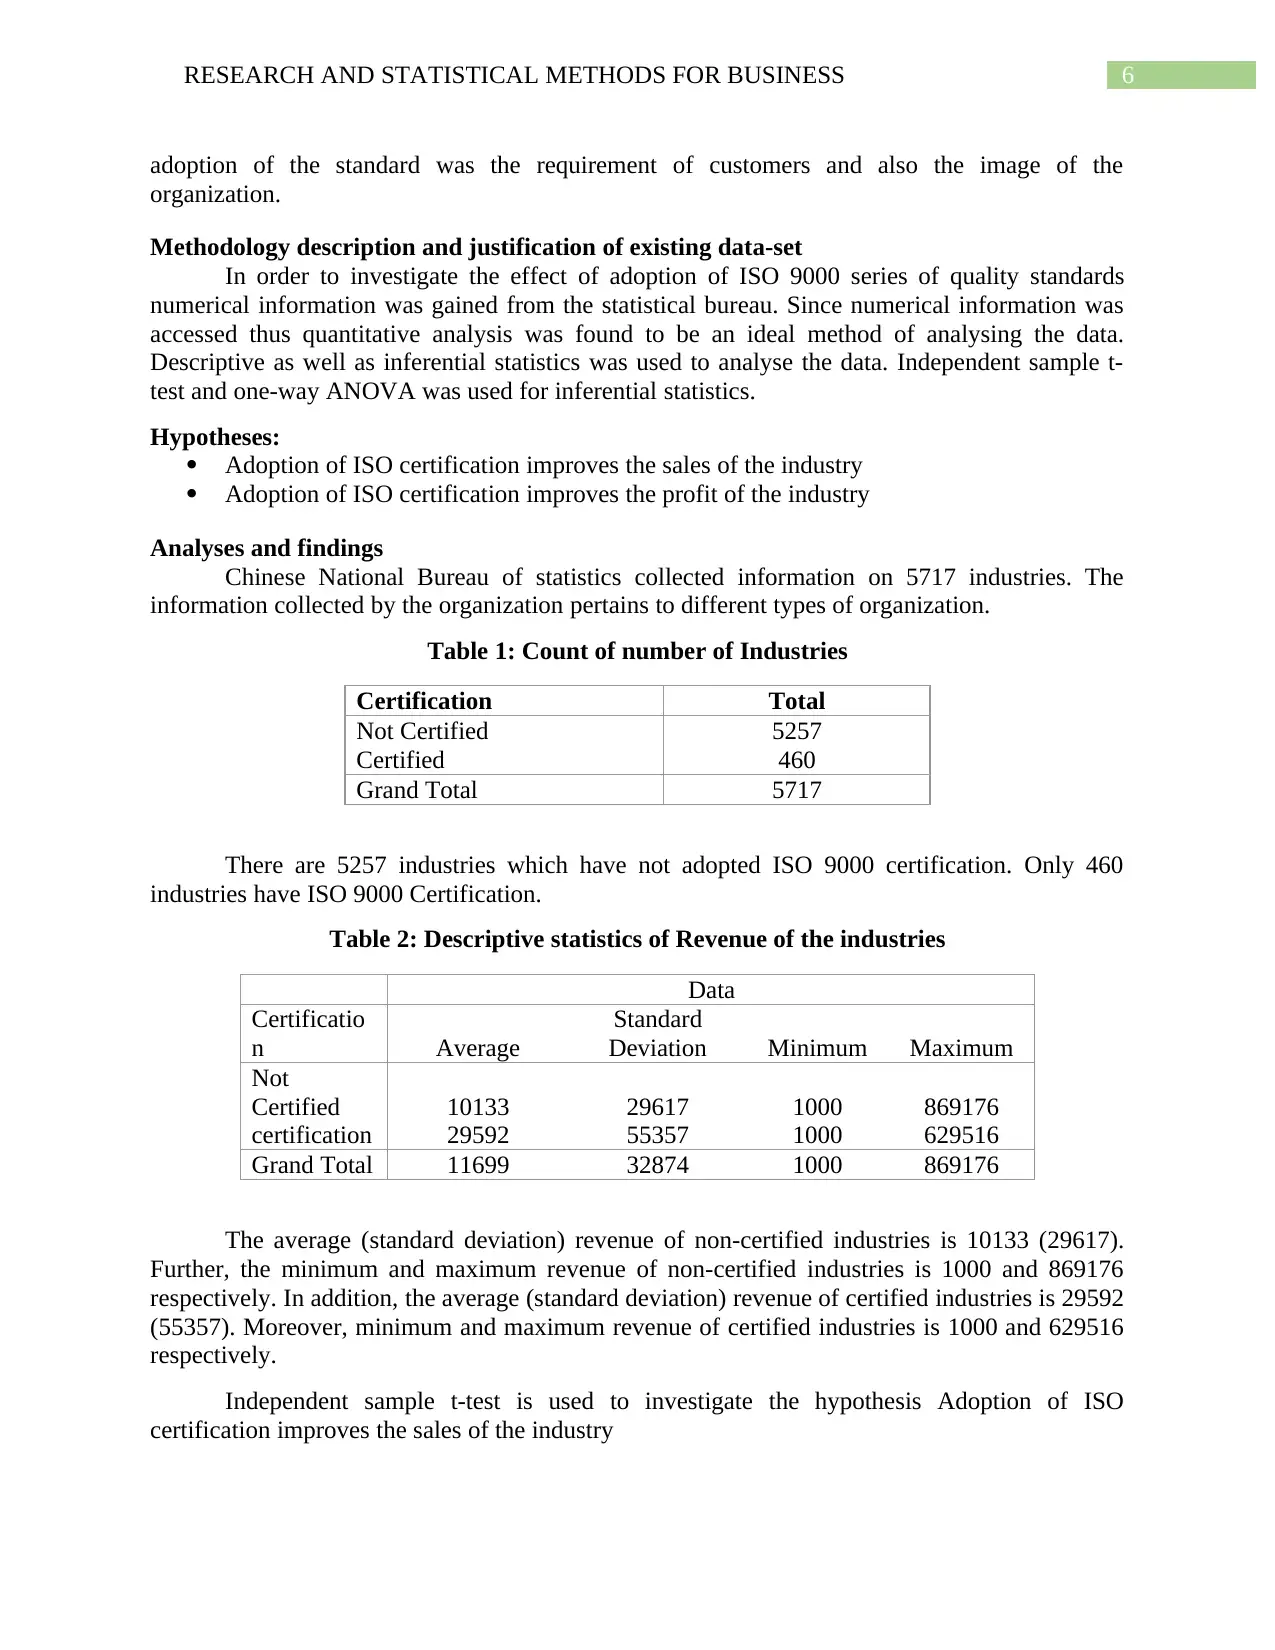
Figure 3: Financial performance of firms in Pakistan
Fatima (2014), studied the impact of adoption of ISO 9000 on firms in Pakistan. The
researcher divided organizations into small, medium and large firms. The year of adoption of
ISO 9000 was taken as 1995. Thus The researcher found that there was significant difference in
the financial performance of large and medium firms with the adoption of ISO 9000. Contrary to
large and medium firms the sales performance of the small firms did not show any difference
post adoption of ISO 9000 standard. Moreover, the researcher also found that the profit of large
and medium firms showed significant difference with the adoption of the standard. In addition,
small firms did not show improvement in financial performance after adoption of ISO 9000
standard.
The impact of adoption of ISO 9000 quality tools on the financial performance in firms in
Siberia was investigated empirically (Spasojevic Brkic, Djurdjevic, Dondur, Klarin, & Tomic,
2013). The researchers found that sales revenue of organizations are significantly related to
financial performance of organizations.
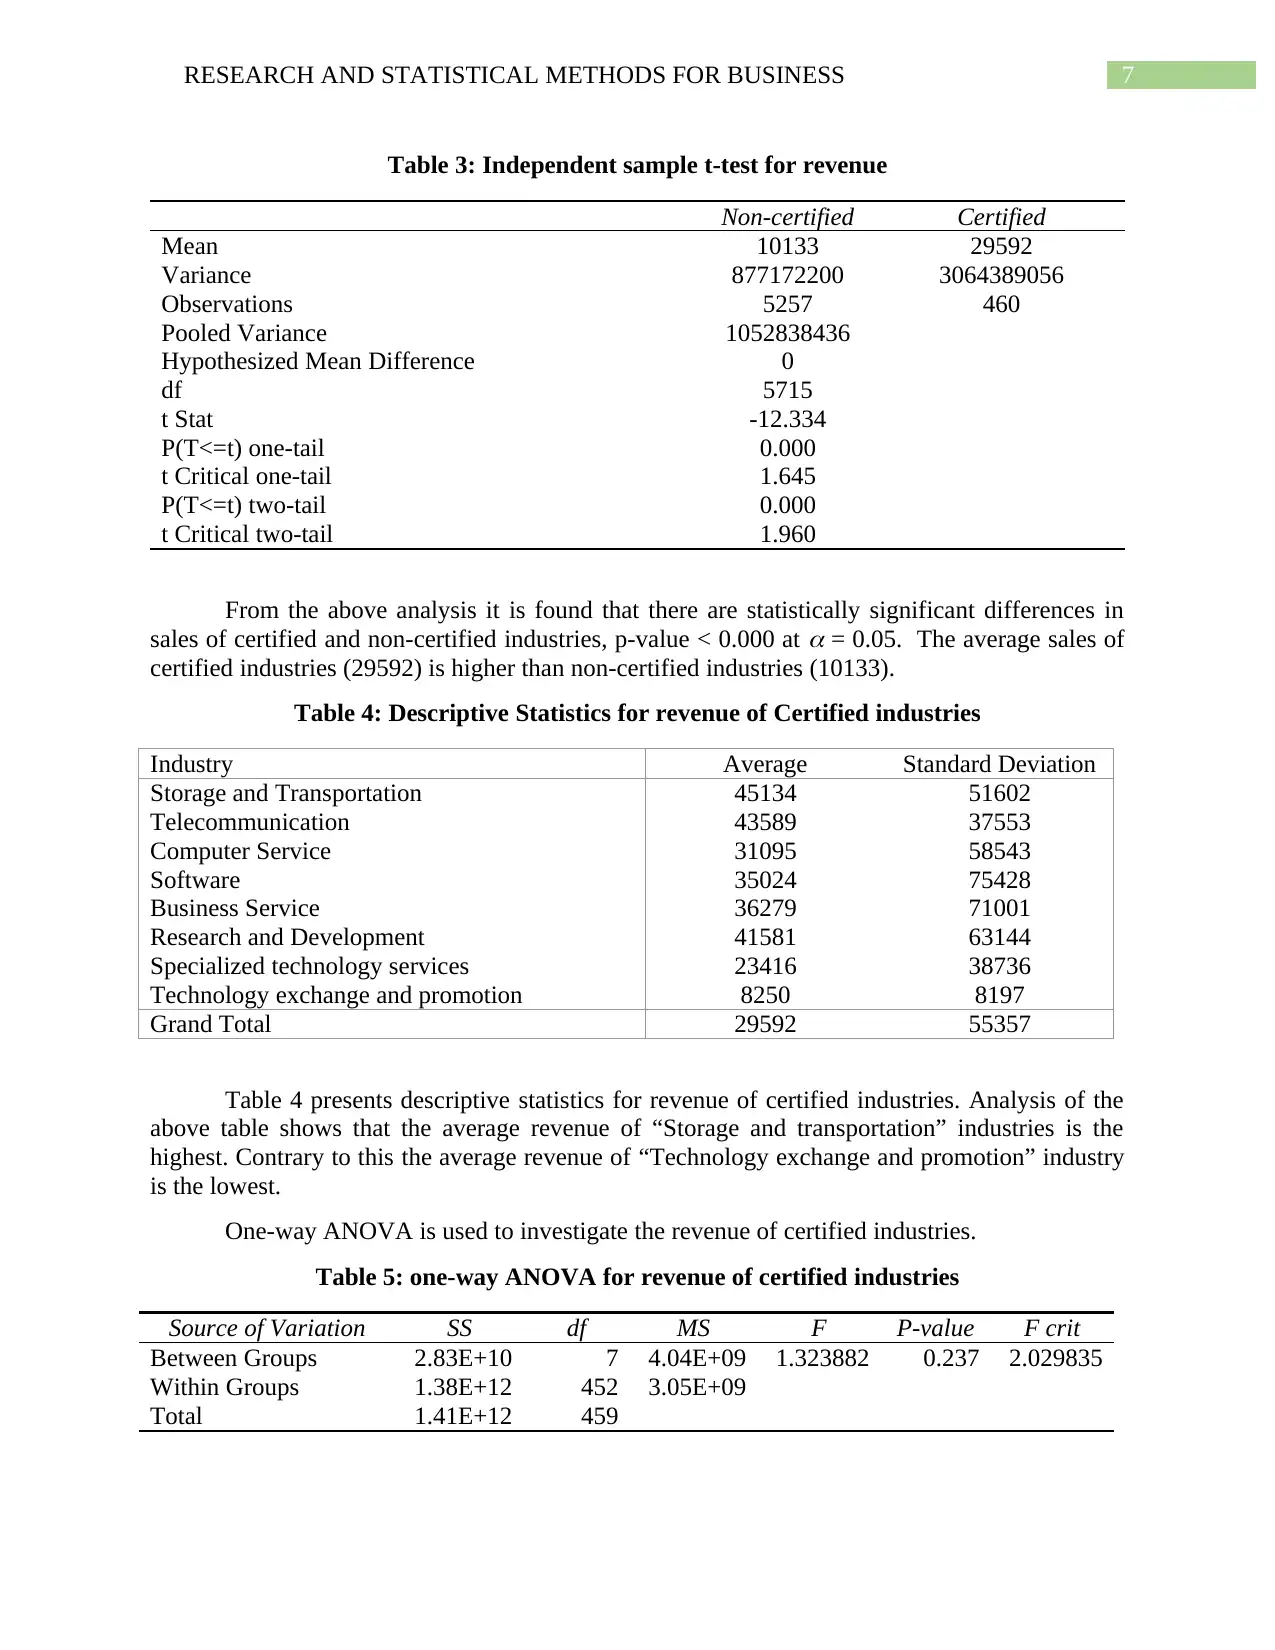
Figure 4: Review of financial performance
The motivation to implementation of ISO quality standards was studied by Roy, Boiral,
& Paillé (2013). To investigate the impact data was collected from 254 Canadian SMEs. From
figure 4 it is found that financial performance of organizations which implemented ISO 9000
was better than those which did not adopt the standard.
Bevilacqua, Emanuele Ciarapica, Giacchetta, & Marchetti (2013) studied the perception
towards the adoption of ISO 9000 in seven firms. They found that adoption of the quality
standard provided the organization with competitive advantage. Moreover, the main cause for
Figure 3: Financial performance of firms in Pakistan
Fatima (2014), studied the impact of adoption of ISO 9000 on firms in Pakistan. The
researcher divided organizations into small, medium and large firms. The year of adoption of
ISO 9000 was taken as 1995. Thus The researcher found that there was significant difference in
the financial performance of large and medium firms with the adoption of ISO 9000. Contrary to
large and medium firms the sales performance of the small firms did not show any difference
post adoption of ISO 9000 standard. Moreover, the researcher also found that the profit of large
and medium firms showed significant difference with the adoption of the standard. In addition,
small firms did not show improvement in financial performance after adoption of ISO 9000
standard.
The impact of adoption of ISO 9000 quality tools on the financial performance in firms in
Siberia was investigated empirically (Spasojevic Brkic, Djurdjevic, Dondur, Klarin, & Tomic,
2013). The researchers found that sales revenue of organizations are significantly related to
financial performance of organizations.
Figure 4: Review of financial performance
The motivation to implementation of ISO quality standards was studied by Roy, Boiral,
& Paillé (2013). To investigate the impact data was collected from 254 Canadian SMEs. From
figure 4 it is found that financial performance of organizations which implemented ISO 9000
was better than those which did not adopt the standard.
Bevilacqua, Emanuele Ciarapica, Giacchetta, & Marchetti (2013) studied the perception
towards the adoption of ISO 9000 in seven firms. They found that adoption of the quality
standard provided the organization with competitive advantage. Moreover, the main cause for
⊘ This is a preview!⊘
Do you want full access?
Subscribe today to unlock all pages.
Trusted by 1+ million students worldwide
6RESEARCH AND STATISTICAL METHODS FOR BUSINESS
adoption of the standard was the requirement of customers and also the image of the
organization.
Methodology description and justification of existing data-set
In order to investigate the effect of adoption of ISO 9000 series of quality standards
numerical information was gained from the statistical bureau. Since numerical information was
accessed thus quantitative analysis was found to be an ideal method of analysing the data.
Descriptive as well as inferential statistics was used to analyse the data. Independent sample t-
test and one-way ANOVA was used for inferential statistics.
Hypotheses:
Adoption of ISO certification improves the sales of the industry
Adoption of ISO certification improves the profit of the industry
Analyses and findings
Chinese National Bureau of statistics collected information on 5717 industries. The
information collected by the organization pertains to different types of organization.
Table 1: Count of number of Industries
Certification Total
Not Certified 5257
Certified 460
Grand Total 5717
There are 5257 industries which have not adopted ISO 9000 certification. Only 460
industries have ISO 9000 Certification.
Table 2: Descriptive statistics of Revenue of the industries
Data
Certificatio
n Average
Standard
Deviation Minimum Maximum
Not
Certified 10133 29617 1000 869176
certification 29592 55357 1000 629516
Grand Total 11699 32874 1000 869176
The average (standard deviation) revenue of non-certified industries is 10133 (29617).
Further, the minimum and maximum revenue of non-certified industries is 1000 and 869176
respectively. In addition, the average (standard deviation) revenue of certified industries is 29592
(55357). Moreover, minimum and maximum revenue of certified industries is 1000 and 629516
respectively.
Independent sample t-test is used to investigate the hypothesis Adoption of ISO
certification improves the sales of the industry
Paraphrase This Document
Need a fresh take? Get an instant paraphrase of this document with our AI Paraphraser
7RESEARCH AND STATISTICAL METHODS FOR BUSINESS
Table 3: Independent sample t-test for revenue
Non-certified Certified
Mean 10133 29592
Variance 877172200 3064389056
Observations 5257 460
Pooled Variance 1052838436
Hypothesized Mean Difference 0
df 5715
t Stat -12.334
P(T<=t) one-tail 0.000
t Critical one-tail 1.645
P(T<=t) two-tail 0.000
t Critical two-tail 1.960
From the above analysis it is found that there are statistically significant differences in
sales of certified and non-certified industries, p-value < 0.000 at
= 0.05. The average sales of
certified industries (29592) is higher than non-certified industries (10133).
Table 4: Descriptive Statistics for revenue of Certified industries
Industry Average Standard Deviation
Storage and Transportation 45134 51602
Telecommunication 43589 37553
Computer Service 31095 58543
Software 35024 75428
Business Service 36279 71001
Research and Development 41581 63144
Specialized technology services 23416 38736
Technology exchange and promotion 8250 8197
Grand Total 29592 55357
Table 4 presents descriptive statistics for revenue of certified industries. Analysis of the
above table shows that the average revenue of “Storage and transportation” industries is the
highest. Contrary to this the average revenue of “Technology exchange and promotion” industry
is the lowest.
One-way ANOVA is used to investigate the revenue of certified industries.
Table 5: one-way ANOVA for revenue of certified industries
Source of Variation SS df MS F P-value F crit
Between Groups 2.83E+10 7 4.04E+09 1.323882 0.237 2.029835
Within Groups 1.38E+12 452 3.05E+09
Total 1.41E+12 459
8RESEARCH AND STATISTICAL METHODS FOR BUSINESS
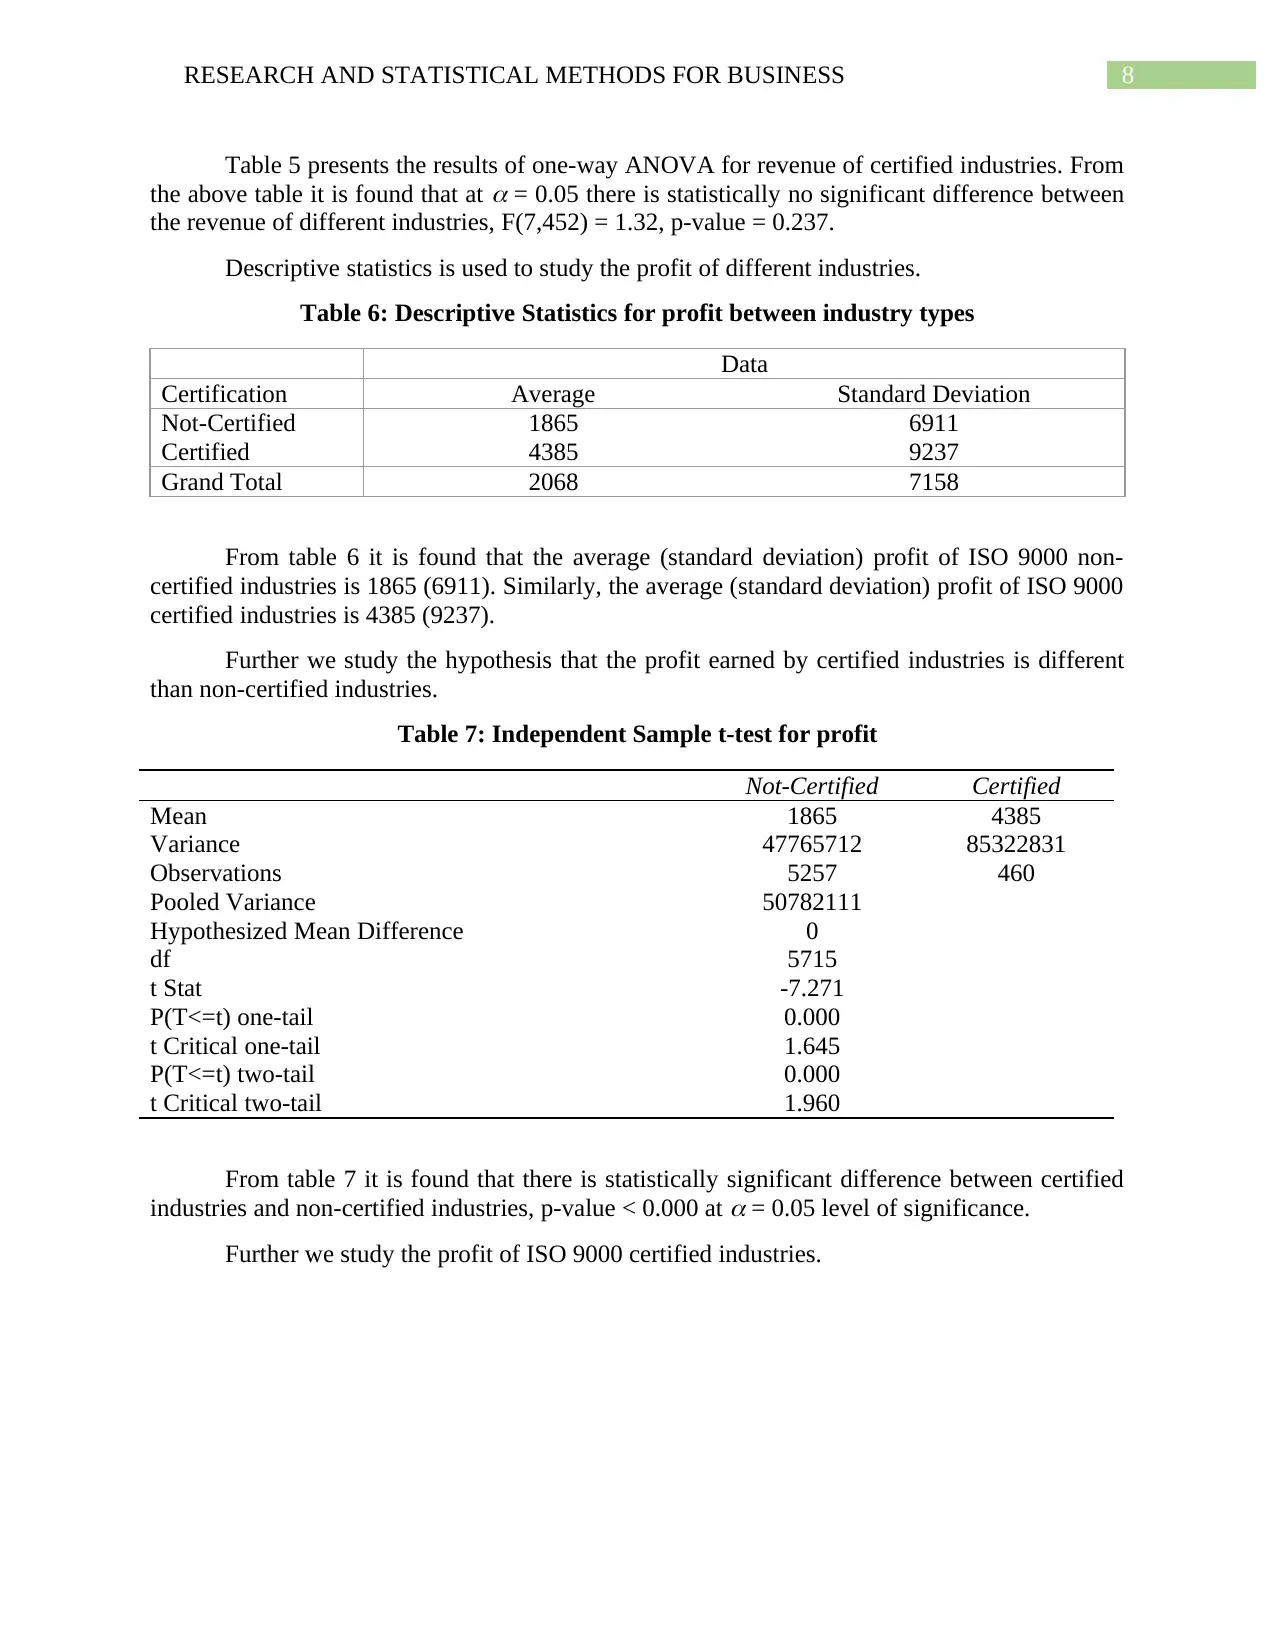
Table 5 presents the results of one-way ANOVA for revenue of certified industries. From
the above table it is found that at
= 0.05 there is statistically no significant difference between
the revenue of different industries, F(7,452) = 1.32, p-value = 0.237.
Descriptive statistics is used to study the profit of different industries.
Table 6: Descriptive Statistics for profit between industry types
Data
Certification Average Standard Deviation
Not-Certified 1865 6911
Certified 4385 9237
Grand Total 2068 7158
From table 6 it is found that the average (standard deviation) profit of ISO 9000 non-
certified industries is 1865 (6911). Similarly, the average (standard deviation) profit of ISO 9000
certified industries is 4385 (9237).
Further we study the hypothesis that the profit earned by certified industries is different
than non-certified industries.
Table 7: Independent Sample t-test for profit
Not-Certified Certified
Mean 1865 4385
Variance 47765712 85322831
Observations 5257 460
Pooled Variance 50782111
Hypothesized Mean Difference 0
df 5715
t Stat -7.271
P(T<=t) one-tail 0.000
t Critical one-tail 1.645
P(T<=t) two-tail 0.000
t Critical two-tail 1.960
From table 7 it is found that there is statistically significant difference between certified
industries and non-certified industries, p-value < 0.000 at
= 0.05 level of significance.
Further we study the profit of ISO 9000 certified industries.
⊘ This is a preview!⊘
Do you want full access?
Subscribe today to unlock all pages.
Trusted by 1+ million students worldwide
9RESEARCH AND STATISTICAL METHODS FOR BUSINESS
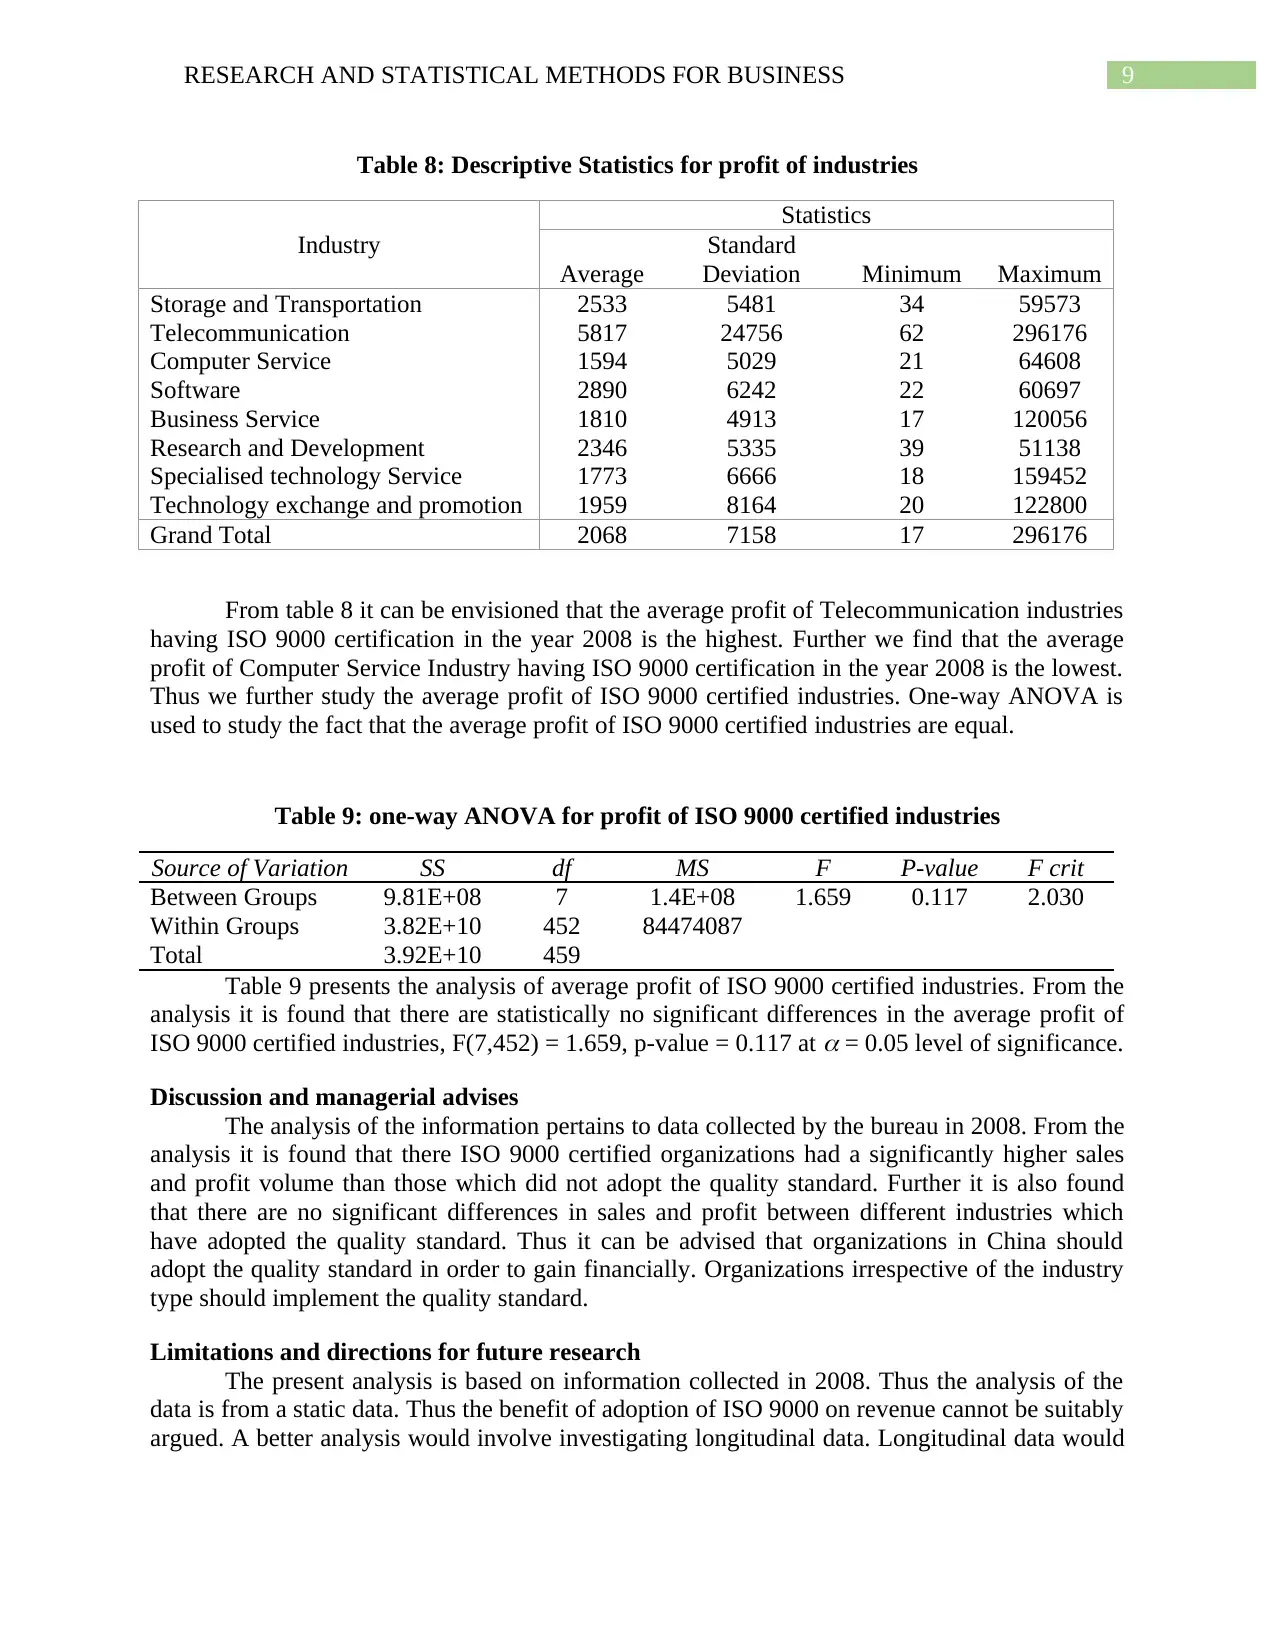
Table 8: Descriptive Statistics for profit of industries
Industry
Statistics
Average
Standard
Deviation Minimum Maximum
Storage and Transportation 2533 5481 34 59573
Telecommunication 5817 24756 62 296176
Computer Service 1594 5029 21 64608
Software 2890 6242 22 60697
Business Service 1810 4913 17 120056
Research and Development 2346 5335 39 51138
Specialised technology Service 1773 6666 18 159452
Technology exchange and promotion 1959 8164 20 122800
Grand Total 2068 7158 17 296176
From table 8 it can be envisioned that the average profit of Telecommunication industries
having ISO 9000 certification in the year 2008 is the highest. Further we find that the average
profit of Computer Service Industry having ISO 9000 certification in the year 2008 is the lowest.
Thus we further study the average profit of ISO 9000 certified industries. One-way ANOVA is
used to study the fact that the average profit of ISO 9000 certified industries are equal.
Table 9: one-way ANOVA for profit of ISO 9000 certified industries
Source of Variation SS df MS F P-value F crit
Between Groups 9.81E+08 7 1.4E+08 1.659 0.117 2.030
Within Groups 3.82E+10 452 84474087
Total 3.92E+10 459
Table 9 presents the analysis of average profit of ISO 9000 certified industries. From the
analysis it is found that there are statistically no significant differences in the average profit of
ISO 9000 certified industries, F(7,452) = 1.659, p-value = 0.117 at
= 0.05 level of significance.
Discussion and managerial advises
The analysis of the information pertains to data collected by the bureau in 2008. From the
analysis it is found that there ISO 9000 certified organizations had a significantly higher sales
and profit volume than those which did not adopt the quality standard. Further it is also found
that there are no significant differences in sales and profit between different industries which
have adopted the quality standard. Thus it can be advised that organizations in China should
adopt the quality standard in order to gain financially. Organizations irrespective of the industry
type should implement the quality standard.
Limitations and directions for future research
The present analysis is based on information collected in 2008. Thus the analysis of the
data is from a static data. Thus the benefit of adoption of ISO 9000 on revenue cannot be suitably
argued. A better analysis would involve investigating longitudinal data. Longitudinal data would
Paraphrase This Document
Need a fresh take? Get an instant paraphrase of this document with our AI Paraphraser
10RESEARCH AND STATISTICAL METHODS FOR BUSINESS
aid in understanding whether there is an increase in revenue over more than 1 year. Thus the
hypothesis that adoption of ISO 9000 aids in revenue of an industry can be better proved.
The revenue and profit of an industry is not dependent on just adoption of ISO 9000 but
on other factors also. All such factors which have influence on revenue and profit should be
investigated.
Conclusion
From previous studies it was found that organization which have adopted ISO 9000
quality standard have had a better financial performance. From our present study also we find
that organization in China which have adopted ISO 9000 have gained financially (sales and
profit). Moreover, it is found from the study that organizations irrespective of industry type have
had an improvement in financial performance.
11RESEARCH AND STATISTICAL METHODS FOR BUSINESS
Reference
Bevilacqua, M., Emanuele Ciarapica, F., Giacchetta, G., & Marchetti, B. (2013). An empirical
study of ISO 9000 on the supply chain of a company leader in the heating sector.
International Journal of Quality & Reliability Management, 30(8), 897-916.
Cai, S., & Jun, M. (2018). A qualitative study of the internalization of ISO 9000 standards: The
linkages among firms' motivations, internalization processes, and performance.
International Journal of Production Economics, 196, 248-260.
Chatzoglou, P., Chatzoudes, D., & Kipraios, N. (2015). The impact of ISO 9000 certification on
firms’ financial performance. International Journal of Operations & Production
Management, 35(1), 145-174.
Fatima, N. (2014). Impact of ISO 9000 on business performance in Pakistan: Implications for
quality in developing countries. Quality Management Journal, 21(1), 16-24.
Javorcik, B., & Sawada, N. (2018). The ISO 9000 certification: Little pain, big gain? European
Economic Review, 105, 103-114.
Kusumah, L., & Fabianto, Y. (2018). The differences in the financial performance of
manufacturing companies in Indonesia before and after ISO 9000 implementation. Total
Quality Management & Business Excellence, 29(7-8), 941-957.
Nally, J. (2016). Good manufacturing practices for pharmaceuticals. CRC Press.
Roy, M., Boiral, O., & Paillé, P. (2013). Pursuing quality and environmental performance:
Initiatives and supporting processes. Business Process Management Journal, 19(1), 30-
53.
Sari, R. (2016). Analysis of Financial Performance of ISO 9000 Certified Company (Empirical
Study on the Manufacturing Companies Listed on the Stock Exchange). Business and
Entrepreneurial Review, 11(1), 13-22.
Spasojevic Brkic, V., Djurdjevic, T., Dondur, N., Klarin, M., & Tomic, B. (2013). An empirical
examination of the impact of quality tools application on business performance: Evidence
from Serbia. Total Quality Management & Business Excellence, 24(5-6), 607-618.
Wang, Z., & Sarkis, J. (2013). Investigating the relationship of sustainable supply chain
management with corporate financial performance. International Journal of Productivity
and Performance Management, 62(8), 871-888.
Zhu, Q., Cordeiro, J., & Sarkis, J. (2013). Institutional pressures, dynamic capabilities and
environmental management systems: Investigating the ISO 9000–Environmental
management system implementation linkage. Journal of environmental management,
114, 232-242.
⊘ This is a preview!⊘
Do you want full access?
Subscribe today to unlock all pages.
Trusted by 1+ million students worldwide
1 out of 12
Related Documents


Your All-in-One AI-Powered Toolkit for Academic Success.
+13062052269
info@desklib.com
Available 24*7 on WhatsApp / Email
![[object Object]](/_next/static/media/star-bottom.7253800d.svg)
Unlock your academic potential
Copyright © 2020–2026 A2Z Services. All Rights Reserved. Developed and managed by ZUCOL.