A Report on the Determinants of ISO 9000 Adoption and Firm Performance
VerifiedAdded on 2021/05/31
|16
|3767
|87
Report
AI Summary
This report investigates the determinants of ISO 9000 adoption and its impact on the financial performance of firms, focusing on data from 5717 Chinese service firms. The study utilizes secondary data from the National Bureau of Statistics of China, employing questionnaires and statistical analysis, including descriptive and inferential statistics. The research addresses the primary question of the importance and impacts of ISO 9000 adoption, along with secondary objectives evaluating the significance of adoption and certification effects on management. Findings reveal insights into employee education levels, correlations between capital sources and firm performance, and the effects of ISO 9000 certification. The report provides managerial advice, discusses research limitations, and offers a comprehensive literature review on quality management and ISO 9000 adoption. The results suggest a positive correlation between ISO 9000 adoption and improved operational and financial performance, emphasizing the importance of skilled manpower and strategic capital management. The report concludes by highlighting the external benefits of ISO 9000 certification and the need for companies to align their objectives with the implementation of ISO 9000 to maximize its benefits.

Determinants of adoption of ISO 9000 and
its impact on firm performance
i
its impact on firm performance
i
Paraphrase This Document
Need a fresh take? Get an instant paraphrase of this document with our AI Paraphraser
Executive summary
The purpose of this report was to assess the importance of adopting ISO 9000 by the firms and the
impacts it has to the firms’ financial performance. The report was guided with the primary question
stating; “What are the importance and impacts of adopting ISO 9000 on the firms’ financial
performance?” in response to this question, secondary data were obtained from the National Bureau of
Statistics of China census which covered 5717 service firms. The instrument that were used in the
primary collection of data were questionnaires. Descriptive and inferential statistics were used to analyze
the collected data using SPSS statistical software version 20. Descriptive statistics showed that most of
the employees in the firms were less educated since the majority 1257 employees had high school
education and below. The firms’ total capital was found to have had strong positive correlation with the
sources of capital (government and other sources). The managers were then advised to focus on the skills
on the workers which goes hand in hand with the level of education in their next hiring of the
professionals and also give equal weight to all sources of capital as they had almost same effect to the
firms’ total capital.
ii
Table of Contents
Executive summary...................................................................................................................................ii
Introduction...............................................................................................................................................1
Research Objectives..............................................................................................................................1
Secondary objectives.........................................................................................................................2
Research questions............................................................................................................................2
Literature review.......................................................................................................................................3
Research Methodology..............................................................................................................................5
Results and findings..................................................................................................................................7
Descriptive statistics..............................................................................................................................7
Inferential statistics...............................................................................................................................8
Discussion and managerial advises.........................................................................................................10
Research limitations................................................................................................................................11
References................................................................................................................................................12
iii
⊘ This is a preview!⊘
Do you want full access?
Subscribe today to unlock all pages.
Trusted by 1+ million students worldwide
Introduction
Business is full of competition and is faced by all firms around the globe especially for the firms
dealing or producing the same product or substitute products for one another. In order for the
business to exist in such competitive environment, they need to have high experienced and
skilled manpower that will help in maintaining the market pressure due to competition Onetti,
Zucchella, Jones & McDougall-Covin, (2012). Competitive aggression in the business starts
from the management through to the junior staffs. Quality management helps in the betterment
of business industries’ operations. Efforts have been made by industries to improve the
management quality in the firms’ daily operations with which ISO 9000 was developed and
adopted as the guidance tool towards high management quality Hahn, (2013). As a result since
the ISO 9000 emergence in the year 1987, customers’ desires are met through production of
quality goods and services by the firms. Apparently, ISO 9000 have gained popularity and more
firms are jostling to join the international organization standards to experience its due benefits.
Firms of all sizes i.e. both small and big are joining ISO 9000 to have acquisition of the
managerial guidelines in the companies’ operations. One of the functions of ISO is to uphold the
preset design standards for the companies’ products. ISO 9000 have spread and is used by the
companies to boost their management in almost 187 countries around the globe since when it
came to use. Taking all the discussed into account, this report was to fulfill the purpose of
assessing the importance of adoption of ISO 9000 and the impacts it has on the firms’
performance.
Research Objectives
The primary objective of this report was to assess the importance of adoption of ISO 9000 and
the impacts it has on firms’ financial performance.
1
Paraphrase This Document
Need a fresh take? Get an instant paraphrase of this document with our AI Paraphraser
Secondary objectives
1. To evaluate the importance of adopting ISO 9000 in the firms’ financial performance
2. To evaluate the certification effects of the firms with ISO 9000 on the firms’ management
Research questions
On meeting the above mentioned secondary objectives, this report will answer the following
research questions;
Primary research question
This report was guided by the question; “what are the importance and impacts of adopting ISO
9000 on the firms’ financial performance?”
Secondary questions
1. What is the importance of adopting ISO 9000 in the firms’ financial performance?
2. What are the effects of firms’ certification with ISO 9000 on firms’ management?
2
Literature review
Prioritizing management skills in business operations since the introduction of ISO 9000 and
other updated ISOs have sparked researchers to conduct researches over the association of ISO
9000 with managerial improvement quality. Literatures have shown that certification of the firms
with ISO 9000 have helped greatly in the improvement of the firms’ financial performance
Heras‐Saizarbitoria & Boiral, (2013). The importance regarding financial importance and
measure of ISO 9000 can be conducted indirectly by using bounteous conceptual framework
Zhu, Cordeiro, & Sarkis, (2013). Some components of ISO that could have effect and relations in
obtaining the financial performance and the involved financial benefits are as well explained in
the previous literatures Chatzoglou, Chatzoudes & Kipraios, (2015). According to Mokhtar &
Muda (2012), they explained that the measure of ISO 9000 certification success is achieved by
focusing on the effectiveness of certification. However, it was further explained that no direct
relationships existed between ISO 9000 and the financial performance but the operational
performance can be increased directly as a result of it proportional effect increasing the financial
performance Lafuente, Bayo‐Moriones & García‐Cestona, (2010). Valuation of implementation
of impacts of ISO is achieved as a result of external perspectives which forms one of the most
important remunerations from ISO certification. Most of the ISO 9000 welfares are external in
nature other than being internal thus exude higher operative performance, this is according to
Cao & Prakash, (2011).
Industries and business organizations focus on achieving quality management skills through
adopting ISO 9000 in their management. The main objective of adopting ISO 9000 by
companies is to develop strategies for maximizing their benefits other than when ISO was used
for reason that are non-developmental that could result to less benefits Prajogo, Tang, & Lai,
3
⊘ This is a preview!⊘
Do you want full access?
Subscribe today to unlock all pages.
Trusted by 1+ million students worldwide
(2012). Objectives of the companies are important when it comes to the realization of ISO 9000
benefits which in that regards should be considered Brunsson, Rasche & Seidl, (2012). The
importance of certifying companies with ISO 9000 is to increase their profits by applying market
differentiation strategy in cost operationalization leadership strategy. ISO 9000 provides benefits
as motivational factors which are considered vital when considering positive predictions Lo et
al., (2013). ISO 9000 is taken through series of updates in order to take care of changes that
occur in business’ daily operation. The ISO certified companies show higher levels of practices
as compared to ISO non-certified companies. Levels of benefits among certified companies vary
depending on the version of ISO adopted by the companies i.e. those which adopted later
versions of ISO realize more benefits compared to those which adopted older versions of ISO
Wiengarten, Pagell & Fynes, (2013). For ISO 9000 certified companies, 3 to 5 years post-
certified period is used to analyze the financial performance of the business.
Size of the business organization is not a factor when adopting ISO 9000 in the daily business
operation. No significance is shown by the number of employees working in a company as well
as the area coverage of the company on the performance and implementation of ISO 9000
Campos, de Melo Heizen, Verdinelli, & Miguel, (2015). As a result, it can therefore be seen that
size of the company have no impact on ISO 9000 certification. Certification of the companies
with ISO 9000 result to the positive effects on the operational performance of the companies
resulting to bid and general external benefits that improve companies’ performance.
4
Paraphrase This Document
Need a fresh take? Get an instant paraphrase of this document with our AI Paraphraser
Research Methodology
Almost 187 companies have adopted ISO 9000 since its emergence in the year 1987 to improve
their management quality. The need to join ISO 9000 by companies have greatly increased in the
previous decades. Data that was used in preparation of this report was secondary data that was
collected from the firms through questionnaires by the National Bureau Statistics of China.
Questionnaires have been immensely acquired for use since 1980s Tuller (2015). In the census
carried out, the data collection instrument was used where they were sent to the firms’ top
managerial positions to fill and respond to the questions on behalf of the firms. Census is one of
the most accurate data collection technique that covers the entire population that is to be
involved in the study. It is mostly used by the government organizations for records keeping and
least used by business organizations due to high expense involved and amount of time
consumed. A population of 5717 service firms were censured by the International Bureau
Statistics of China where relevant authorities such as the managing directors and managers
represented their service firms. Out of the questions asked to the authorities on the questionnaires
were the number of employees the firms had, the year service firms were certified by ISO 9000,
the year companies came to existence etc. regarding the data collection technique employed by
the National Bureau Statistics of China, no segment of information was left out since all the
service firms were reached.
Data that was collected in the census process was entered in excel and prepared in readiness for
analysis where later the data was transferred to SPSS version 20 for data analysis. The data was
represented on tables and graphs so that the data can be easily interpreted. The statistical analysis
that was employed to leverage the firms’ characteristics through the data provided was
descriptive statistics which covered the mean, standard deviation, minimum, and maximum.
5

Also, Pearson’s correlations and confidence interval was used to draw conclusions from the
service firms’ data.
6
service firms’ data.
6
⊘ This is a preview!⊘
Do you want full access?
Subscribe today to unlock all pages.
Trusted by 1+ million students worldwide
Results and findings
All the result from this report will be presented in this part in relations to the research questions
raised on the importance and impacts of ISO 9000.
Descriptive statistics
Table 1: Descriptive statistics for the service firms
N Minimum Maximum Mean Std. Deviation
l 5717 11 969 44.96 74.378
l_yjs 5717 0 161 1.38 5.688
l_benke 5717 0 530 11.85 28.453
l_dz 5717 0 490 12.92 24.306
l_gaozhong 5717 0 689 12.26 31.290
l_chuzhong 5717 0 568 6.54 25.980
revenue 5717 1000 869176 11698.57 32873.609
profit_operating 5717 17 296176 2067.97 7158.417
ksum 5717 1000 978548 16473.16 54666.560
equity 5717 -1367 877989 7693.77 31012.079
kpaid 5717 10 402110 4765.67 17120.175
kstate 5717 0 402110 1201.12 11264.936
koversea 5717 0 150000 348.87 4598.814
kother 5717 0 400000 3215.68 11765.554
ROS 5717 .01 .51 .1911 .12397
ROA 5717 .01 1.02 .2236 .20858
FDIpercent 5717 .00 1.00 .0245 .14937
agefirm 5717 2 61 7.62 7.074
Valid N (listwise) 5717
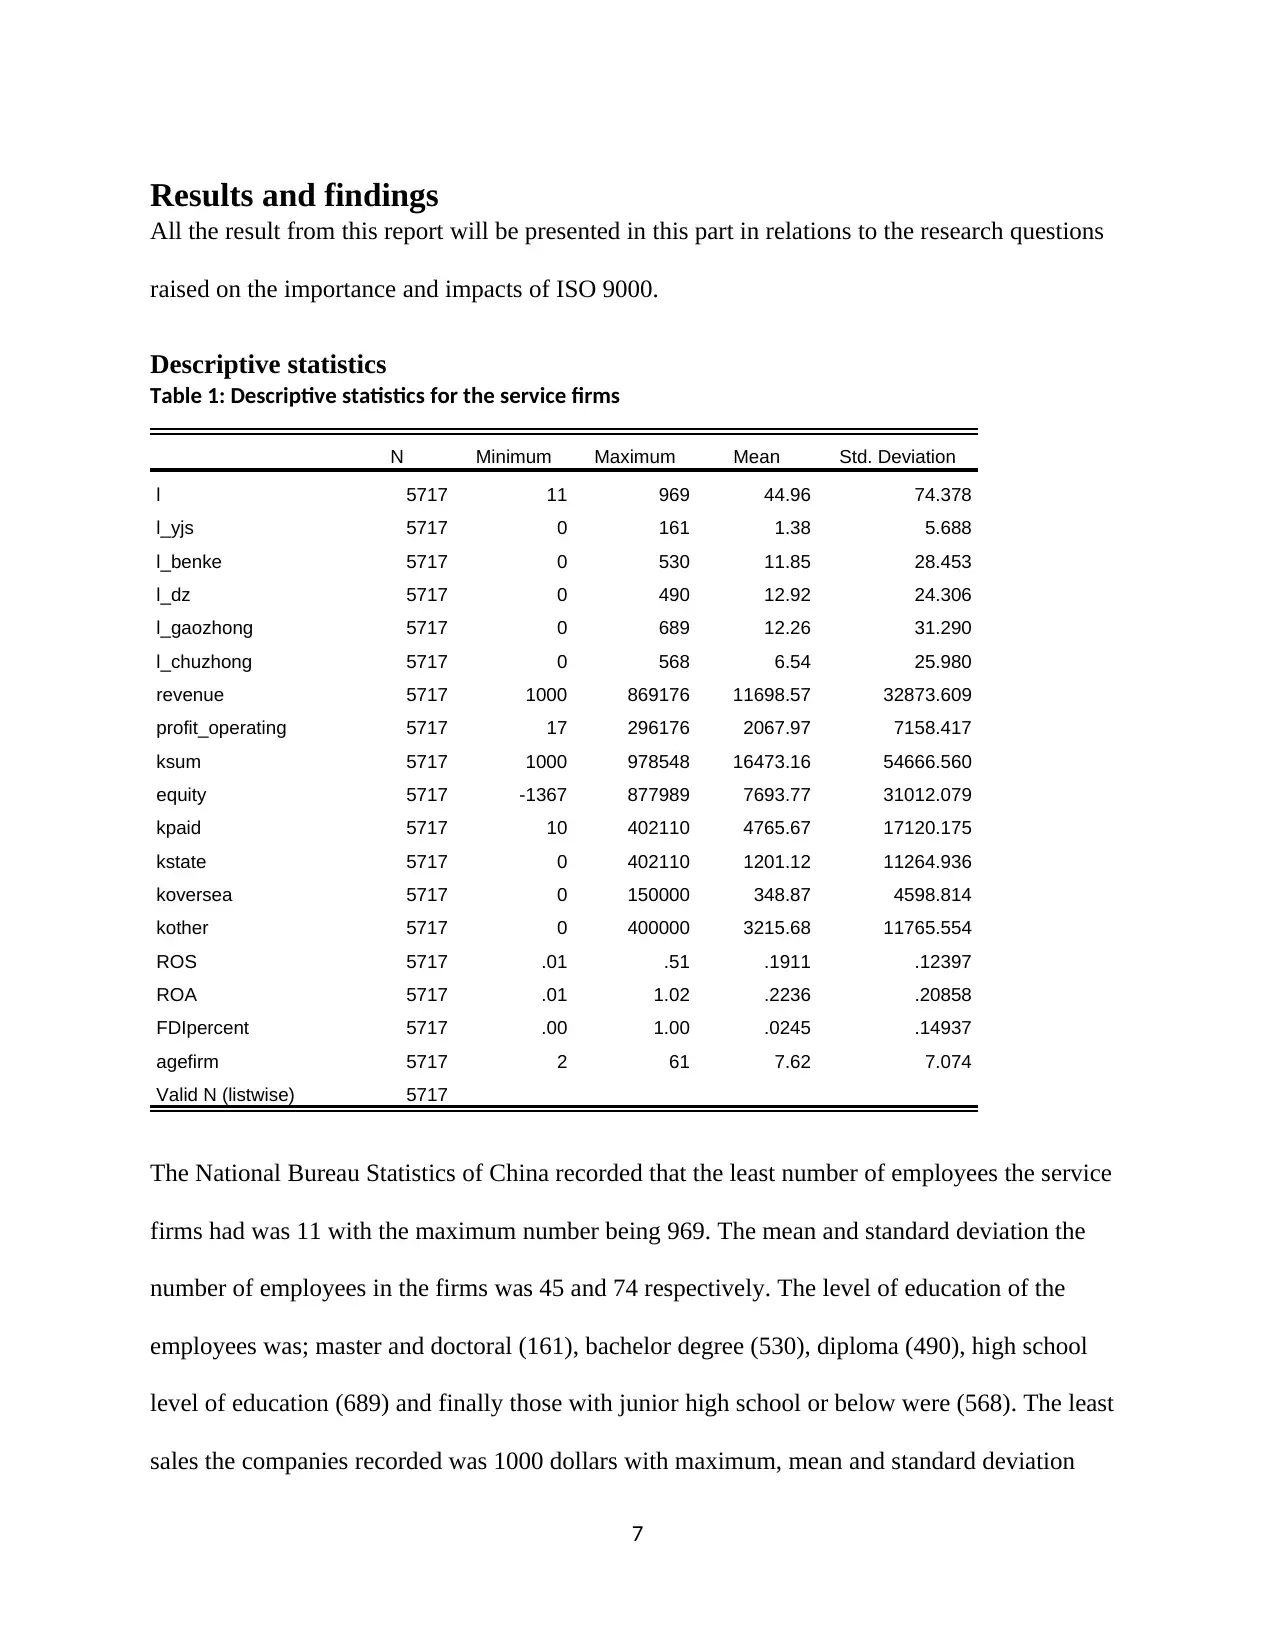
The National Bureau Statistics of China recorded that the least number of employees the service
firms had was 11 with the maximum number being 969. The mean and standard deviation the
number of employees in the firms was 45 and 74 respectively. The level of education of the
employees was; master and doctoral (161), bachelor degree (530), diploma (490), high school
level of education (689) and finally those with junior high school or below were (568). The least
sales the companies recorded was 1000 dollars with maximum, mean and standard deviation
7
All the result from this report will be presented in this part in relations to the research questions
raised on the importance and impacts of ISO 9000.
Descriptive statistics
Table 1: Descriptive statistics for the service firms
N Minimum Maximum Mean Std. Deviation
l 5717 11 969 44.96 74.378
l_yjs 5717 0 161 1.38 5.688
l_benke 5717 0 530 11.85 28.453
l_dz 5717 0 490 12.92 24.306
l_gaozhong 5717 0 689 12.26 31.290
l_chuzhong 5717 0 568 6.54 25.980
revenue 5717 1000 869176 11698.57 32873.609
profit_operating 5717 17 296176 2067.97 7158.417
ksum 5717 1000 978548 16473.16 54666.560
equity 5717 -1367 877989 7693.77 31012.079
kpaid 5717 10 402110 4765.67 17120.175
kstate 5717 0 402110 1201.12 11264.936
koversea 5717 0 150000 348.87 4598.814
kother 5717 0 400000 3215.68 11765.554
ROS 5717 .01 .51 .1911 .12397
ROA 5717 .01 1.02 .2236 .20858
FDIpercent 5717 .00 1.00 .0245 .14937
agefirm 5717 2 61 7.62 7.074
Valid N (listwise) 5717
The National Bureau Statistics of China recorded that the least number of employees the service
firms had was 11 with the maximum number being 969. The mean and standard deviation the
number of employees in the firms was 45 and 74 respectively. The level of education of the
employees was; master and doctoral (161), bachelor degree (530), diploma (490), high school
level of education (689) and finally those with junior high school or below were (568). The least
sales the companies recorded was 1000 dollars with maximum, mean and standard deviation
7
Paraphrase This Document
Need a fresh take? Get an instant paraphrase of this document with our AI Paraphraser
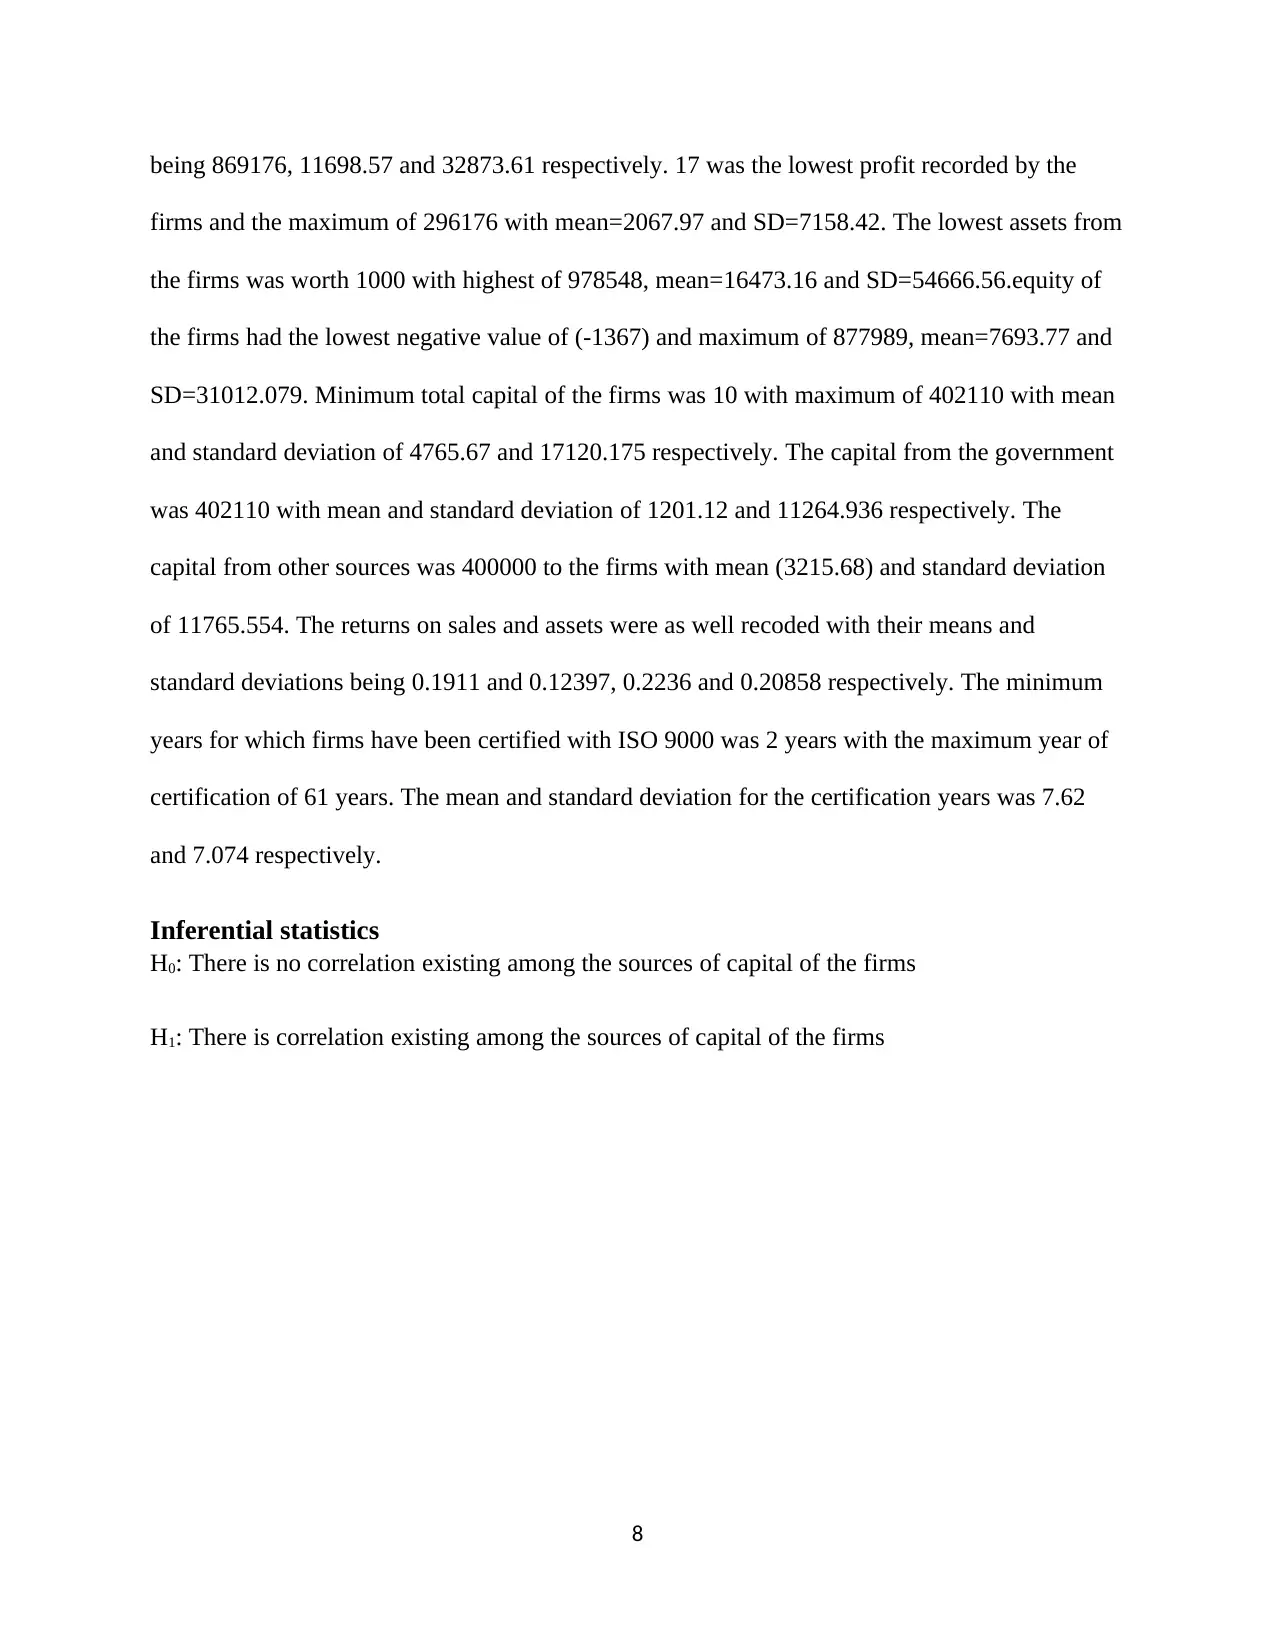
being 869176, 11698.57 and 32873.61 respectively. 17 was the lowest profit recorded by the
firms and the maximum of 296176 with mean=2067.97 and SD=7158.42. The lowest assets from
the firms was worth 1000 with highest of 978548, mean=16473.16 and SD=54666.56.equity of
the firms had the lowest negative value of (-1367) and maximum of 877989, mean=7693.77 and
SD=31012.079. Minimum total capital of the firms was 10 with maximum of 402110 with mean
and standard deviation of 4765.67 and 17120.175 respectively. The capital from the government
was 402110 with mean and standard deviation of 1201.12 and 11264.936 respectively. The
capital from other sources was 400000 to the firms with mean (3215.68) and standard deviation
of 11765.554. The returns on sales and assets were as well recoded with their means and
standard deviations being 0.1911 and 0.12397, 0.2236 and 0.20858 respectively. The minimum
years for which firms have been certified with ISO 9000 was 2 years with the maximum year of
certification of 61 years. The mean and standard deviation for the certification years was 7.62
and 7.074 respectively.
Inferential statistics
H0: There is no correlation existing among the sources of capital of the firms
H1: There is correlation existing among the sources of capital of the firms
8
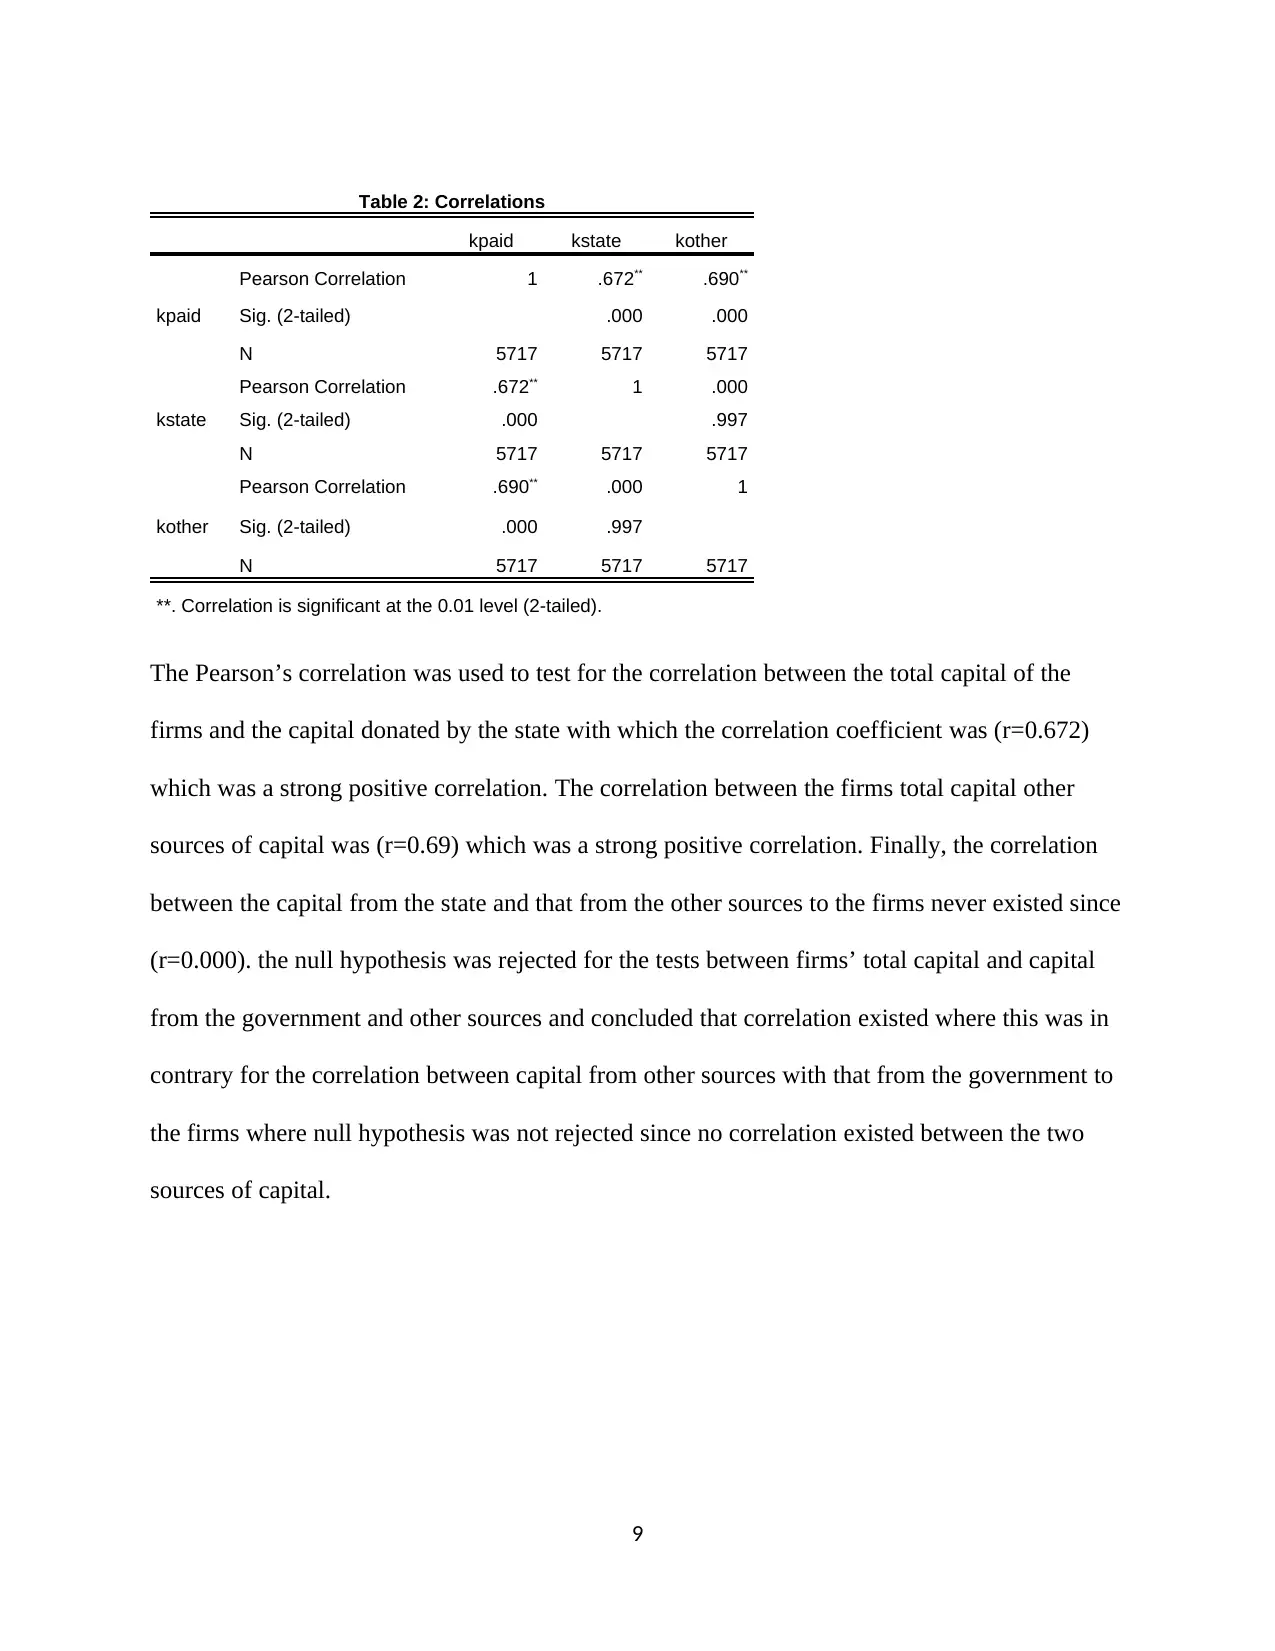
Table 2: Correlations
kpaid kstate kother
kpaid
Pearson Correlation 1 .672** .690**
Sig. (2-tailed) .000 .000
N 5717 5717 5717
kstate
Pearson Correlation .672** 1 .000
Sig. (2-tailed) .000 .997
N 5717 5717 5717
kother
Pearson Correlation .690** .000 1
Sig. (2-tailed) .000 .997
N 5717 5717 5717
**. Correlation is significant at the 0.01 level (2-tailed).
The Pearson’s correlation was used to test for the correlation between the total capital of the
firms and the capital donated by the state with which the correlation coefficient was (r=0.672)
which was a strong positive correlation. The correlation between the firms total capital other
sources of capital was (r=0.69) which was a strong positive correlation. Finally, the correlation
between the capital from the state and that from the other sources to the firms never existed since
(r=0.000). the null hypothesis was rejected for the tests between firms’ total capital and capital
from the government and other sources and concluded that correlation existed where this was in
contrary for the correlation between capital from other sources with that from the government to
the firms where null hypothesis was not rejected since no correlation existed between the two
sources of capital.
9
⊘ This is a preview!⊘
Do you want full access?
Subscribe today to unlock all pages.
Trusted by 1+ million students worldwide
1 out of 16
Related Documents


Your All-in-One AI-Powered Toolkit for Academic Success.
+13062052269
info@desklib.com
Available 24*7 on WhatsApp / Email
![[object Object]](/_next/static/media/star-bottom.7253800d.svg)
Unlock your academic potential
Copyright © 2020–2026 A2Z Services. All Rights Reserved. Developed and managed by ZUCOL.