Analysis of ISO 9000 Certification Adoption in China's Service Sector
VerifiedAdded on 2022/10/10
|19
|3793
|13
Report
AI Summary
This report provides a comprehensive analysis of ISO 9000 certification within China's service industry. The study investigates the factors driving firms to adopt ISO 9000 and examines the potential benefits of certification, such as enhanced firm image and competitiveness. The methodology utilizes data from the National Bureau of Statistics of China, employing descriptive and inferential statistics to analyze the relationships between variables including industry type, firm age, and employee education levels. Findings reveal a positive correlation between company age and ISO certification, as well as the influence of employee education on certification status. The research underscores the importance of both internal and external factors in driving ISO 9000 adoption, with a focus on the significance of firm image and competitive pressures. The report concludes with recommendations for future research, emphasizing the need for cause-and-effect studies to provide more definitive results and improve the understanding of ISO 9000's impact on the Chinese service sector.
ISO 9000 certification in China
Table of Contents
ISO 9000 certification in China...................................................................................................................1
EXECUTIVE SUMMARY.........................................................................................................................2
INTRODUCTION.......................................................................................................................................3
LITERATURE REVIEW............................................................................................................................4
Methodology...............................................................................................................................................6
Descriptive statistics................................................................................................................................6
Observation from data.........................................................................................................................6
Certification.........................................................................................................................................6
Type of industries................................................................................................................................7
Descriptive statistics and measures of dispersion................................................................................8
Inferential statistics..............................................................................................................................8
Relationship between variables............................................................................................................8
Explanations........................................................................................................................................9
Relationship between ISO certifications of companies with the level of education...........................10
Data explanation................................................................................................................................11
T test results...........................................................................................................................................12
Explanations......................................................................................................................................12
Pearson R correlation.............................................................................................................................12
Explanation........................................................................................................................................13
Chi- square test......................................................................................................................................13
Discussion and managerial advices...........................................................................................................15
Limitations of the study.............................................................................................................................16
Directions for future study.........................................................................................................................16
Appendix...................................................................................................................................................17
List of reference.........................................................................................................................................18
1
Paraphrase This Document
Need a fresh take? Get an instant paraphrase of this document with our AI Paraphraser
EXECUTIVE SUMMARY
This report discusses the association between the ISO9000 and important elements in service and
goods production such as industry, firm levels and internal and external institutional pressure,
just to list a few. A review of quite a number of available literatures provide meaningful insight
that are crucial in evaluating the adoption of ISO9000 and its connections with key elements in
China’s service and goods production. The study sought to verify the relationship between the
factors that drive firms to adopt ISO and the probable gains of ISO 9000 certification. Our
findings based on samples generated by the National Bureau of Statistics of China are as follows:
Despite the fact that, majority of the sampled firms included in the ISO certification
was ignited by enhancement of the firm’s image and the competition levels, the general
difference in numerical terms between the internally driven and externally driven firms
was uncannily minute.
The inferential statistics analysis revealed a medium positive association among the
driving agents of ISO 9000 adoption and the upward gains of ISO 9000 certification to
the firms. Based on our sample, externally driven firms reported regular improvements
in the context of outward benefits.
In China, enhanced firm image and competitiveness are the more powerful driving
agents of ISO 9000 implementation compared to other business pressures such as
consumer pressure. Furthermore, the need for absolute legitimacy and administrational
support from organizations are also major ignition force behind the implementation.
In light of these findings and other relevant observations generated from our study we will go
ahead and recommend that:
Since we are undertaking a deductive research to explore the fundamental association
among the ISO certification and its primary intermediate variables, we are more likely to
find curative results. To improve the quality of future studies, it will be of statistical
significance to conduct a cause and effect relationship among the primary variables in
order to find preventive results rather than the curative ones.
2
Since the accuracy of the statistical data used in this study are relatively high
considering the fact that they were generated from a renowned and nationally accredited
institution, the results found in the research analysis can be used as a powerful tool for
identifying the driving agents of ISO adoption and the gains of ISO 9000 adoption in
China.
INTRODUCTION
The ISO 9000 quality management system was initiated in the late 1980s by the International
Organization for Standardization (ISO) with the intention of standardizing quality programs,
however, the ISO 9000 have been through significant developments from their time of initiation
to date. Despite all these developments, more and more studies have continued to be undertaken
with the main aim of figuring out the factors that drive different business industry players to
obtain ISO certification. A wide variety of opinions on the motivating factors for ISO 9000
adoption have been put to serious considerations over the years yet, the largest percentage of
research works associated with adoption of ISO 9000 including those of prominent personalities
such as Kadash 2012 and other renowned researchers have put these factors into consideration
from a dual perspective that splits these factors into two categories namely, the internal and
external factors. The internal factors are aspects such as decrease in cost, desire for improved
productivity and profitability whereas, external factors are aspects such as enhanced company
image and pressure from clients or suppliers.
A large variety of studies from different corners of the globe like Saudi Arabia (Kadash, 2012),
Insinuate that the external factors are more superior to the internal factors. However, based on
our group’s extensive review of the available literature on ISO 9000 adoption, the only
meaningful, internationally recognized work on ISO 9000 is a 2012 study conducted in Lithuania
by Ruzevicius, Adomaitiene and Sirvidaite whereas the other research reports have addressed
ISO certification from a completely diverse angle of discussion from the one we studied in our
research. Thus, the correlation between implementation of ISO 9000 and how primary
production elements fit into the equation is quite unexplored.
3
⊘ This is a preview!⊘
Do you want full access?
Subscribe today to unlock all pages.
Trusted by 1+ million students worldwide
The two main objectives of this report are:
To figure out the ignition force for implementation of ISO certification in general and
also in Asia while placing particular emphasis on China.
The other objective of this study is to find the relationship among companies ISO
certification and other key elements in the product line.
LITERATURE REVIEW
As we have already indicated during the commencement of this report, the predominant
approach on the existing research papers focused on the factors from the internal/external
dimensions. According to this research approach, the internal dimensions include the utmost
need for improving production and profits, decreasing the production cost, improving and
maintaining quality etc. whereas the external dimensions include pressures from consumers and
traders, enhancing company public image etc. Generally, the ISO 9000 family of quality has
become the ultimate prerequisite for any firm to gain entry into the world-wide market thus, a
number of research works on the factors that drive firms into obtaining ISO certification are of
the opinion that external factors are far much more superior to the internal factors (Kadash, 2012
and McCrosson, Cano, O’Neill, and Kobi, 2013). China’s service industry case gives rise to
sufficient evidence to the afore-highlighted action. Since the 90s where ISO 9001
implementation advanced to being a compulsory prerequisite for exports to European, Chinese
and other states in Asia such as Japanese were forced to adopt ISO implementations so as to
maintain and continue to enlarge their market shares abroad. Moreover, there are also those
researchers that believe that implementation of quality techniques such as the ISO 9000 idea is
propelled by internal factors. The matter, as is proclaimed by Heras-Saizarbitoria and Boiral
(2012), the implementation would at many instances rely on firms’ financial, administrational or
investment resource. For instance, firms which aim for TQM adoption, ISO 9000
implementation has proved to be a better commencement point for possible reducing finances
and quality development. Nevertheless, ISO standardizing requires a solid financial base starting
from 10000 US dollars up to 300000 US dollars and since the improvements that arise from the
4
Paraphrase This Document
Need a fresh take? Get an instant paraphrase of this document with our AI Paraphraser
said certifications are quite debateable, it seems, the so called external motivations are in a way,
overwhelming.
Research works on Communist economies like China are extremely limited. Based on our review
of the available literature, it is possible to identify only one report on the factors related to
implementation of ISO standardization that was scoped in an Asian Communist state; in this
case, Japan. Empirical research conducted by the National Bureau of Statistics of China, with a
limited sample of firms in the service industries shows that their hunger-like desire for ISO 9000
standardization is correlated to efforts aimed at improving the managing systems and techniques.
From this notion, it is possible to ascertain that the past and current communist countries like
Indonesia and China are at the moment pacing to be the industry-based power economy of the
West Asia in pursuit of economy dominance. However, it is not surprising since states like China
suffer from the image of low quality products and services. Hence in mere efforts to emulate
their western counterparts, it is distinctively possible that firms in China visualize the adoption of
ISO 9000 and other similar quality management standards as maintaining business and products
ethics (Otsuki, 2011).
5
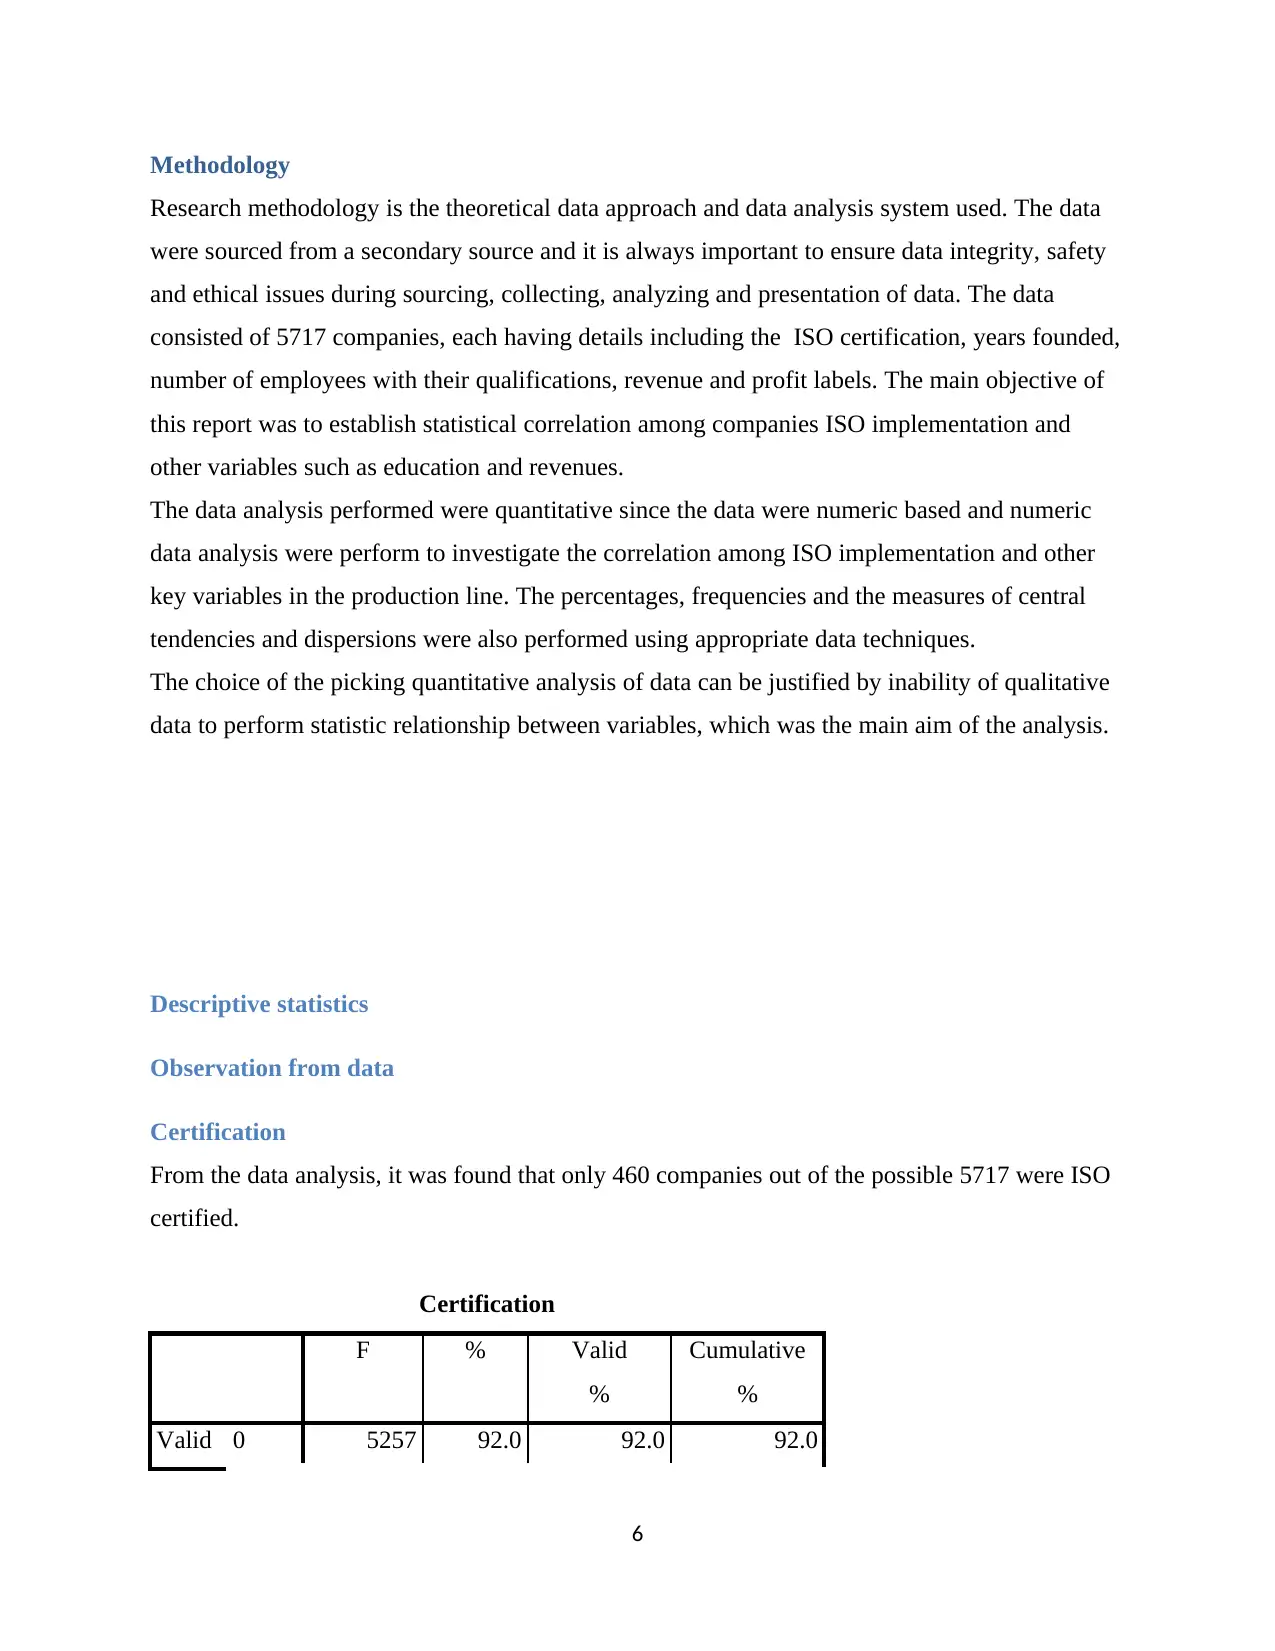
Methodology
Research methodology is the theoretical data approach and data analysis system used. The data
were sourced from a secondary source and it is always important to ensure data integrity, safety
and ethical issues during sourcing, collecting, analyzing and presentation of data. The data
consisted of 5717 companies, each having details including the ISO certification, years founded,
number of employees with their qualifications, revenue and profit labels. The main objective of
this report was to establish statistical correlation among companies ISO implementation and
other variables such as education and revenues.
The data analysis performed were quantitative since the data were numeric based and numeric
data analysis were perform to investigate the correlation among ISO implementation and other
key variables in the production line. The percentages, frequencies and the measures of central
tendencies and dispersions were also performed using appropriate data techniques.
The choice of the picking quantitative analysis of data can be justified by inability of qualitative
data to perform statistic relationship between variables, which was the main aim of the analysis.
Descriptive statistics
Observation from data
Certification
From the data analysis, it was found that only 460 companies out of the possible 5717 were ISO
certified.
Certification
F % Valid
%
Cumulative
%
Valid 0 5257 92.0 92.0 92.0
6
⊘ This is a preview!⊘
Do you want full access?
Subscribe today to unlock all pages.
Trusted by 1+ million students worldwide
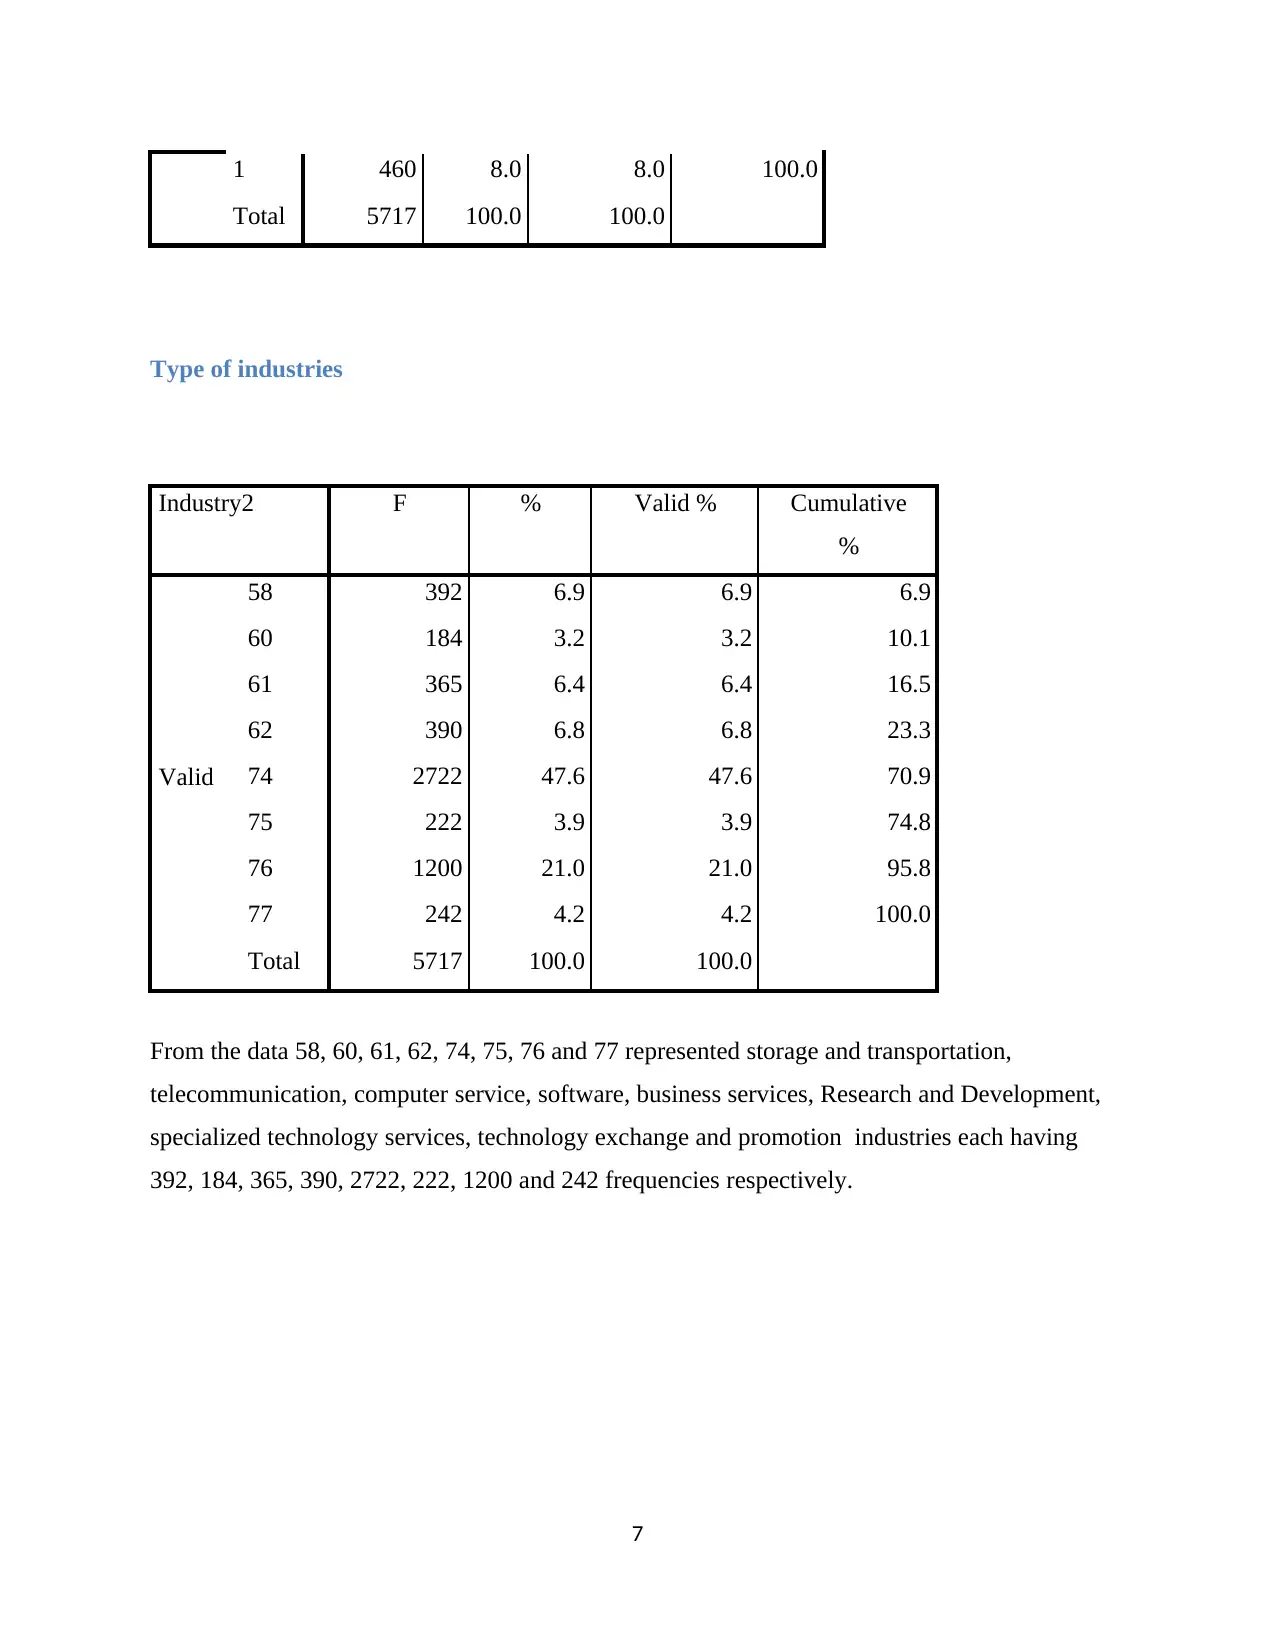
1 460 8.0 8.0 100.0
Total 5717 100.0 100.0
Type of industries
Industry2 F % Valid % Cumulative
%
Valid
58 392 6.9 6.9 6.9
60 184 3.2 3.2 10.1
61 365 6.4 6.4 16.5
62 390 6.8 6.8 23.3
74 2722 47.6 47.6 70.9
75 222 3.9 3.9 74.8
76 1200 21.0 21.0 95.8
77 242 4.2 4.2 100.0
Total 5717 100.0 100.0
From the data 58, 60, 61, 62, 74, 75, 76 and 77 represented storage and transportation,
telecommunication, computer service, software, business services, Research and Development,
specialized technology services, technology exchange and promotion industries each having
392, 184, 365, 390, 2722, 222, 1200 and 242 frequencies respectively.
7
Total 5717 100.0 100.0
Type of industries
Industry2 F % Valid % Cumulative
%
Valid
58 392 6.9 6.9 6.9
60 184 3.2 3.2 10.1
61 365 6.4 6.4 16.5
62 390 6.8 6.8 23.3
74 2722 47.6 47.6 70.9
75 222 3.9 3.9 74.8
76 1200 21.0 21.0 95.8
77 242 4.2 4.2 100.0
Total 5717 100.0 100.0
From the data 58, 60, 61, 62, 74, 75, 76 and 77 represented storage and transportation,
telecommunication, computer service, software, business services, Research and Development,
specialized technology services, technology exchange and promotion industries each having
392, 184, 365, 390, 2722, 222, 1200 and 242 frequencies respectively.
7
Paraphrase This Document
Need a fresh take? Get an instant paraphrase of this document with our AI Paraphraser
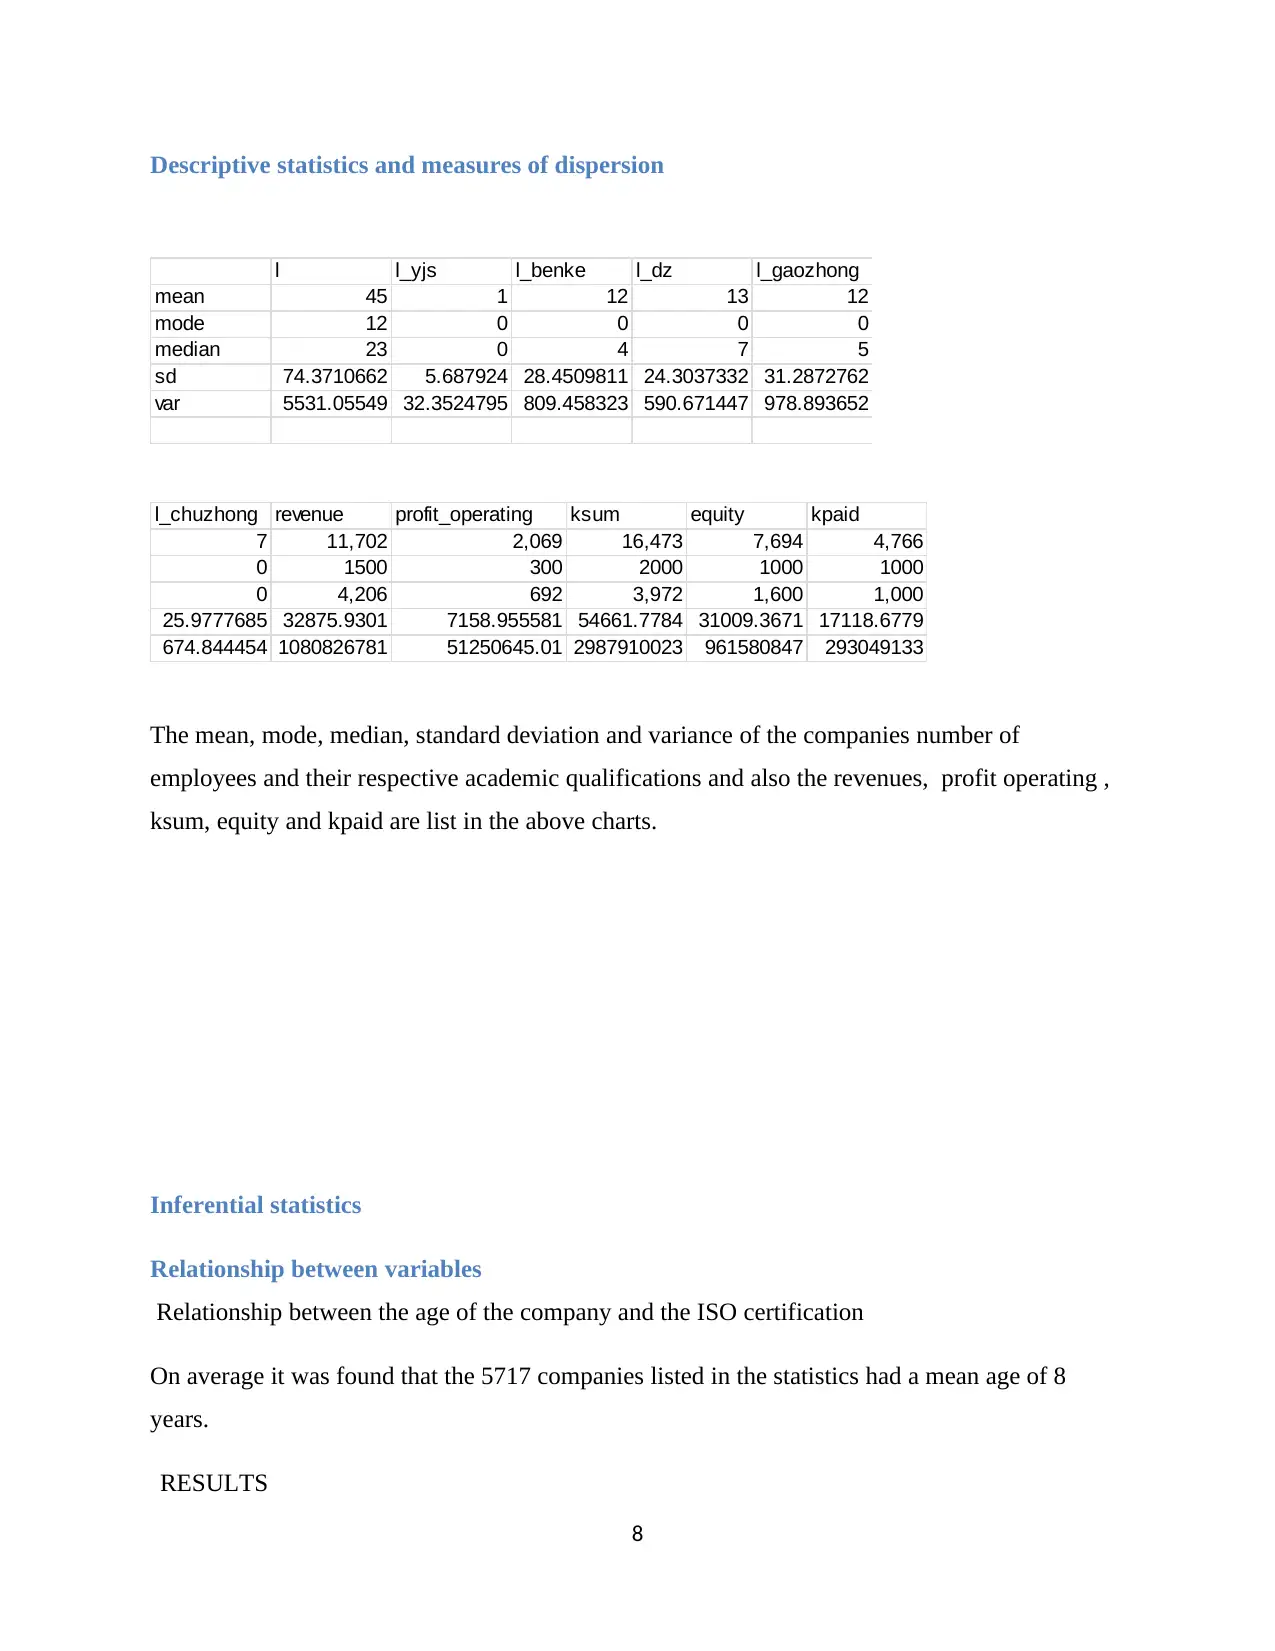
Descriptive statistics and measures of dispersion
l l_yjs l_benke l_dz l_gaozhong
mean 45 1 12 13 12
mode 12 0 0 0 0
median 23 0 4 7 5
sd 74.3710662 5.687924 28.4509811 24.3037332 31.2872762
var 5531.05549 32.3524795 809.458323 590.671447 978.893652
l_chuzhong revenue profit_operating ksum equity kpaid
7 11,702 2,069 16,473 7,694 4,766
0 1500 300 2000 1000 1000
0 4,206 692 3,972 1,600 1,000
25.9777685 32875.9301 7158.955581 54661.7784 31009.3671 17118.6779
674.844454 1080826781 51250645.01 2987910023 961580847 293049133
The mean, mode, median, standard deviation and variance of the companies number of
employees and their respective academic qualifications and also the revenues, profit operating ,
ksum, equity and kpaid are list in the above charts.
Inferential statistics
Relationship between variables
Relationship between the age of the company and the ISO certification
On average it was found that the 5717 companies listed in the statistics had a mean age of 8
years.
RESULTS
8
Analysis results
Multiple-R
0.11120
9
R-Square
0.01236
7
Adjusted-R
Square value
0.01219
5
Standard-
Error
0.27036
7
Observations 5717
ANOVA
Df SS MS F Sig F
Regressio
n 1
5.23124
2 5.231242
71.5645
6 3.37E-17
Residuals 5715
417.756
3 0.073098
T 5716
422.987
6
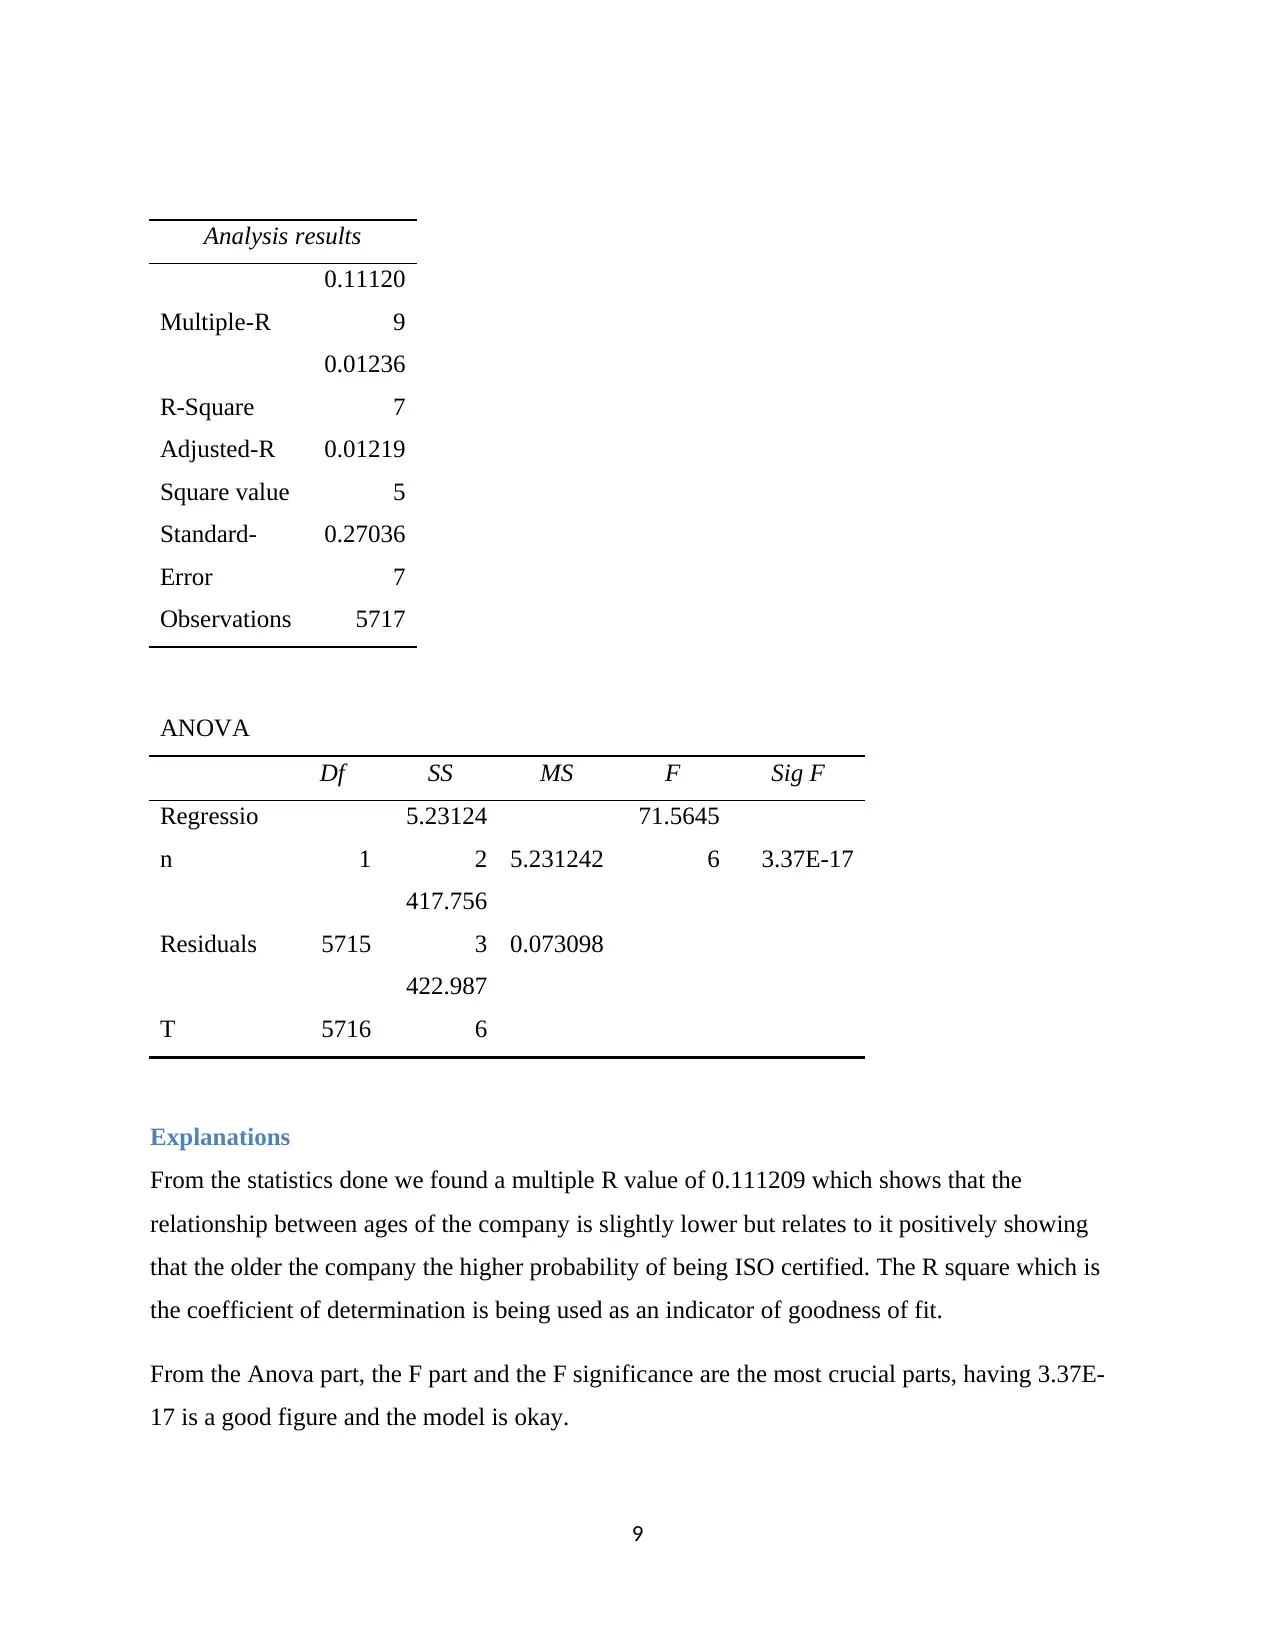
Explanations
From the statistics done we found a multiple R value of 0.111209 which shows that the
relationship between ages of the company is slightly lower but relates to it positively showing
that the older the company the higher probability of being ISO certified. The R square which is
the coefficient of determination is being used as an indicator of goodness of fit.
From the Anova part, the F part and the F significance are the most crucial parts, having 3.37E-
17 is a good figure and the model is okay.
9
Multiple-R
0.11120
9
R-Square
0.01236
7
Adjusted-R
Square value
0.01219
5
Standard-
Error
0.27036
7
Observations 5717
ANOVA
Df SS MS F Sig F
Regressio
n 1
5.23124
2 5.231242
71.5645
6 3.37E-17
Residuals 5715
417.756
3 0.073098
T 5716
422.987
6
Explanations
From the statistics done we found a multiple R value of 0.111209 which shows that the
relationship between ages of the company is slightly lower but relates to it positively showing
that the older the company the higher probability of being ISO certified. The R square which is
the coefficient of determination is being used as an indicator of goodness of fit.
From the Anova part, the F part and the F significance are the most crucial parts, having 3.37E-
17 is a good figure and the model is okay.
9
⊘ This is a preview!⊘
Do you want full access?
Subscribe today to unlock all pages.
Trusted by 1+ million students worldwide
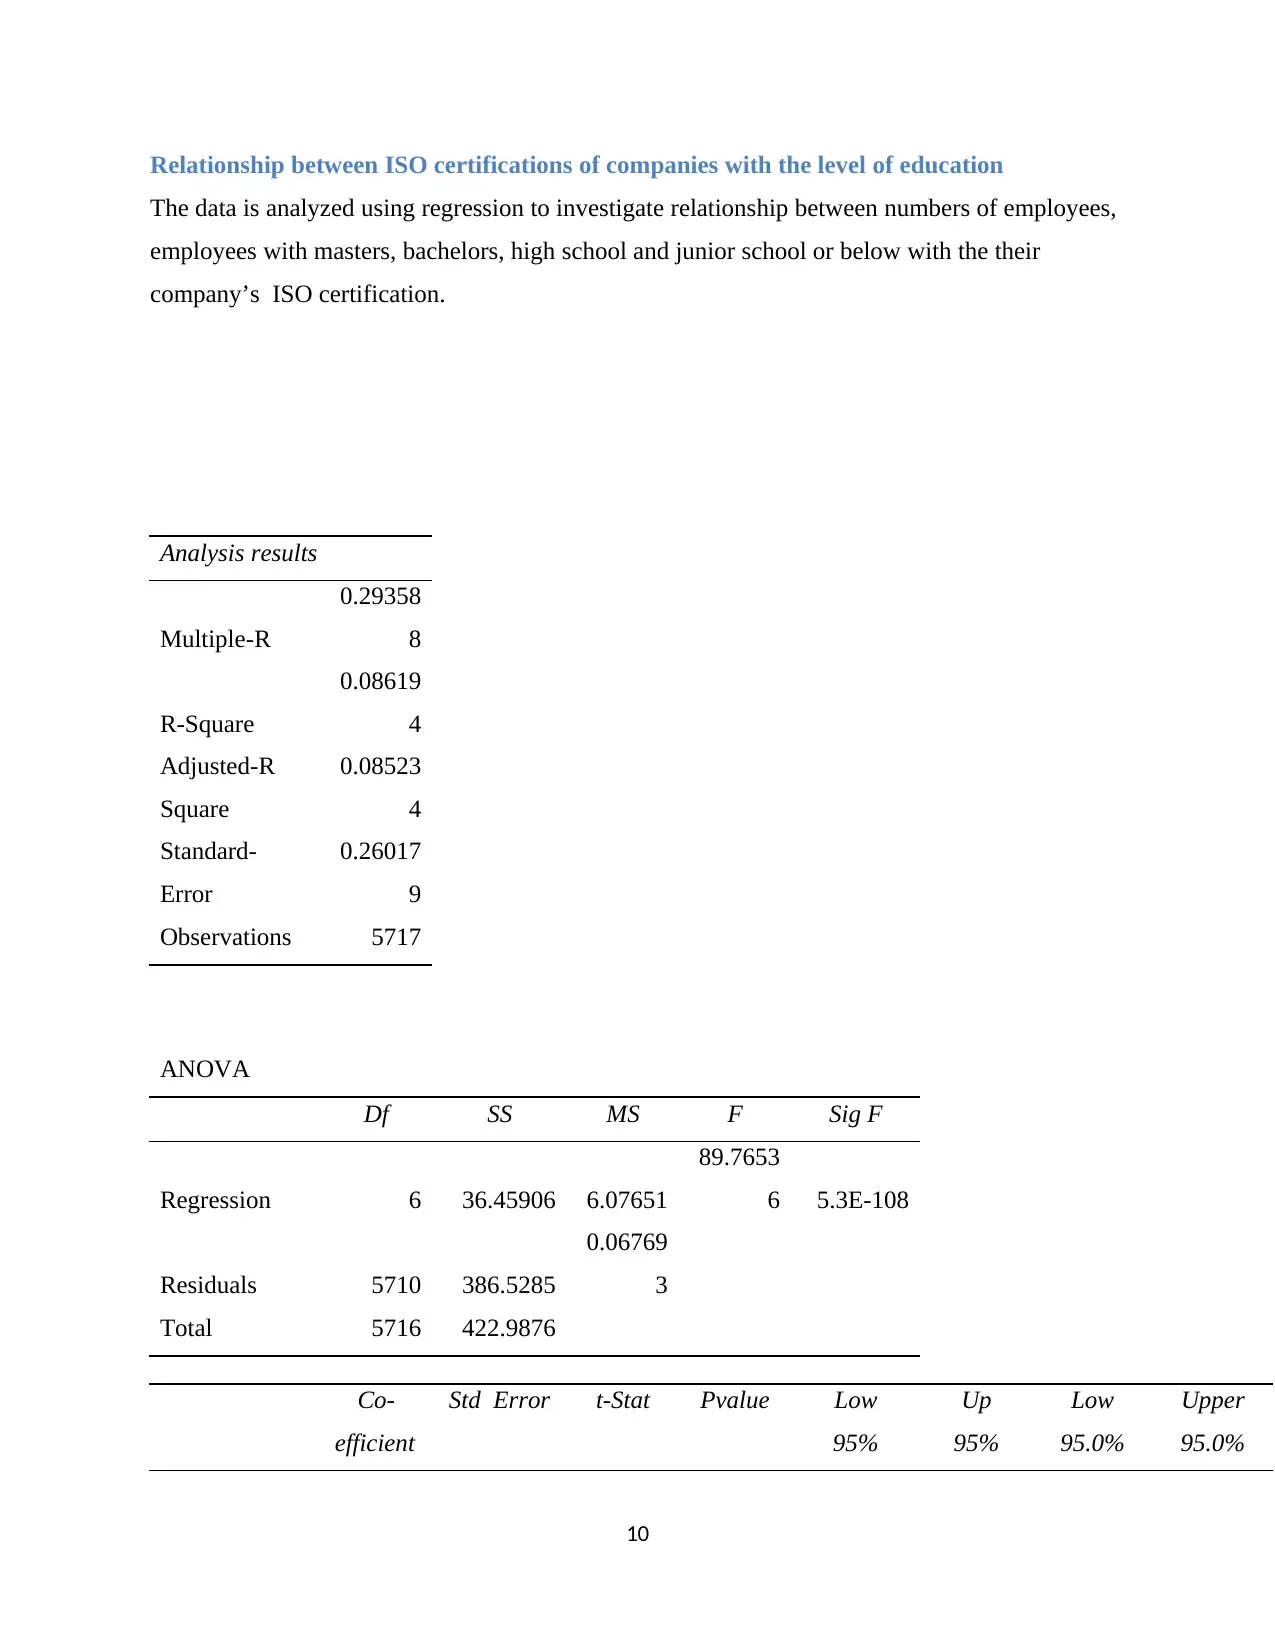
Relationship between ISO certifications of companies with the level of education
The data is analyzed using regression to investigate relationship between numbers of employees,
employees with masters, bachelors, high school and junior school or below with the their
company’s ISO certification.
Analysis results
Multiple-R
0.29358
8
R-Square
0.08619
4
Adjusted-R
Square
0.08523
4
Standard-
Error
0.26017
9
Observations 5717
ANOVA
Df SS MS F Sig F
Regression 6 36.45906 6.07651
89.7653
6 5.3E-108
Residuals 5710 386.5285
0.06769
3
Total 5716 422.9876
Co-
efficient
Std Error t-Stat Pvalue Low
95%
Up
95%
Low
95.0%
Upper
95.0%
10
Paraphrase This Document
Need a fresh take? Get an instant paraphrase of this document with our AI Paraphraser
s
Intercept Var
0.03944
1 0.004057
9.72192
1
3.61E-
22 0.031488
0.04739
4 0.031488 0.047394
Var num One -0.00164 0.010842 -0.1511
0.87989
9 -0.02289
0.01961
6 -0.02289 0.019616
Var num Two
0.00231
1 0.010867
0.21267
5
0.83158
8 -0.01899
0.02361
5 -0.01899 0.023615
Var num
Three
0.00374
3 0.010843
0.34517
3
0.72997
7 -0.01751 0.025 -0.01751 0.025
Var num Four
0.00267
8 0.010843
0.24701
9
0.80490
2 -0.01858
0.02393
5 -0.01858 0.023935
Var num Five
0.00185
2 0.010842
0.17084
4
0.86435
3 -0.0194
0.02310
7 -0.0194 0.023107
Var num Six
0.00150
1 0.010844
0.13838
8
0.88993
8 -0.01976
0.02275
9 -0.01976 0.022759
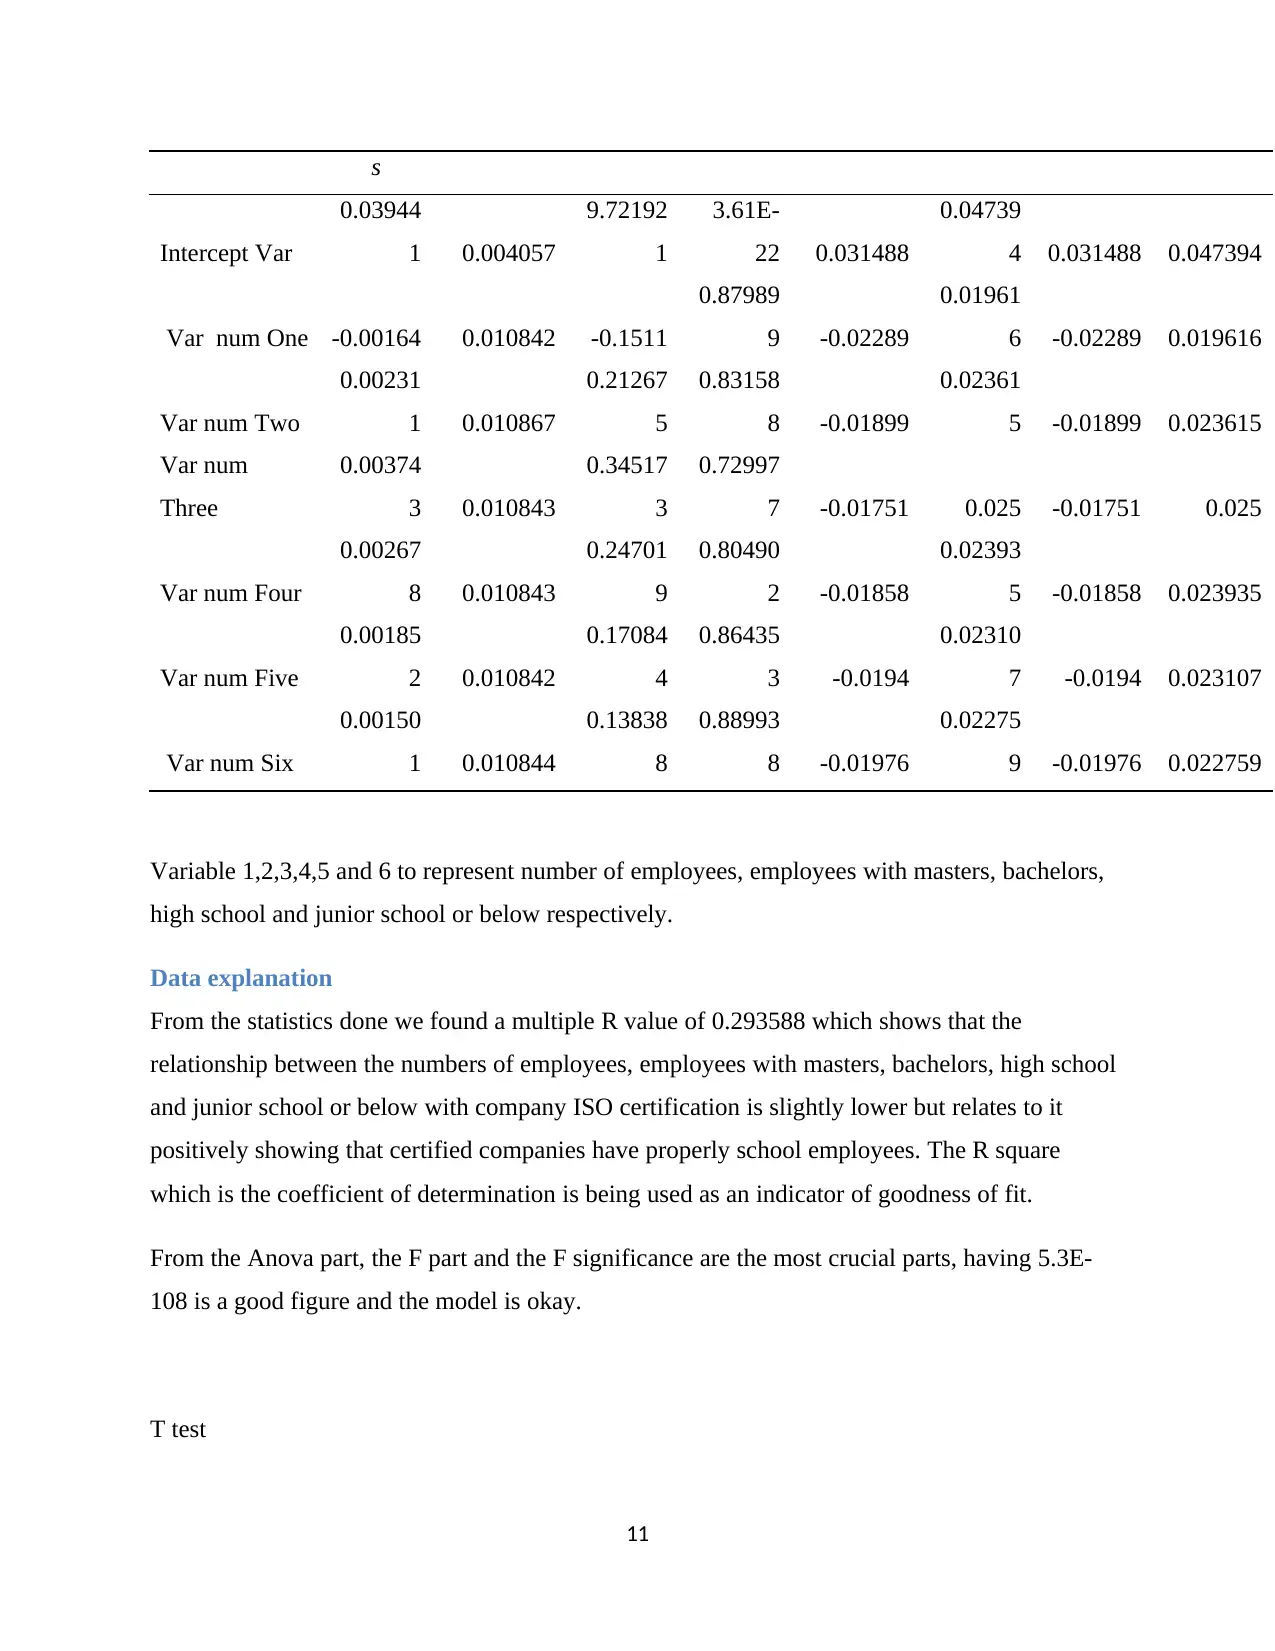
Variable 1,2,3,4,5 and 6 to represent number of employees, employees with masters, bachelors,
high school and junior school or below respectively.
Data explanation
From the statistics done we found a multiple R value of 0.293588 which shows that the
relationship between the numbers of employees, employees with masters, bachelors, high school
and junior school or below with company ISO certification is slightly lower but relates to it
positively showing that certified companies have properly school employees. The R square
which is the coefficient of determination is being used as an indicator of goodness of fit.
From the Anova part, the F part and the F significance are the most crucial parts, having 5.3E-
108 is a good figure and the model is okay.
T test
11
Intercept Var
0.03944
1 0.004057
9.72192
1
3.61E-
22 0.031488
0.04739
4 0.031488 0.047394
Var num One -0.00164 0.010842 -0.1511
0.87989
9 -0.02289
0.01961
6 -0.02289 0.019616
Var num Two
0.00231
1 0.010867
0.21267
5
0.83158
8 -0.01899
0.02361
5 -0.01899 0.023615
Var num
Three
0.00374
3 0.010843
0.34517
3
0.72997
7 -0.01751 0.025 -0.01751 0.025
Var num Four
0.00267
8 0.010843
0.24701
9
0.80490
2 -0.01858
0.02393
5 -0.01858 0.023935
Var num Five
0.00185
2 0.010842
0.17084
4
0.86435
3 -0.0194
0.02310
7 -0.0194 0.023107
Var num Six
0.00150
1 0.010844
0.13838
8
0.88993
8 -0.01976
0.02275
9 -0.01976 0.022759
Variable 1,2,3,4,5 and 6 to represent number of employees, employees with masters, bachelors,
high school and junior school or below respectively.
Data explanation
From the statistics done we found a multiple R value of 0.293588 which shows that the
relationship between the numbers of employees, employees with masters, bachelors, high school
and junior school or below with company ISO certification is slightly lower but relates to it
positively showing that certified companies have properly school employees. The R square
which is the coefficient of determination is being used as an indicator of goodness of fit.
From the Anova part, the F part and the F significance are the most crucial parts, having 5.3E-
108 is a good figure and the model is okay.
T test
11
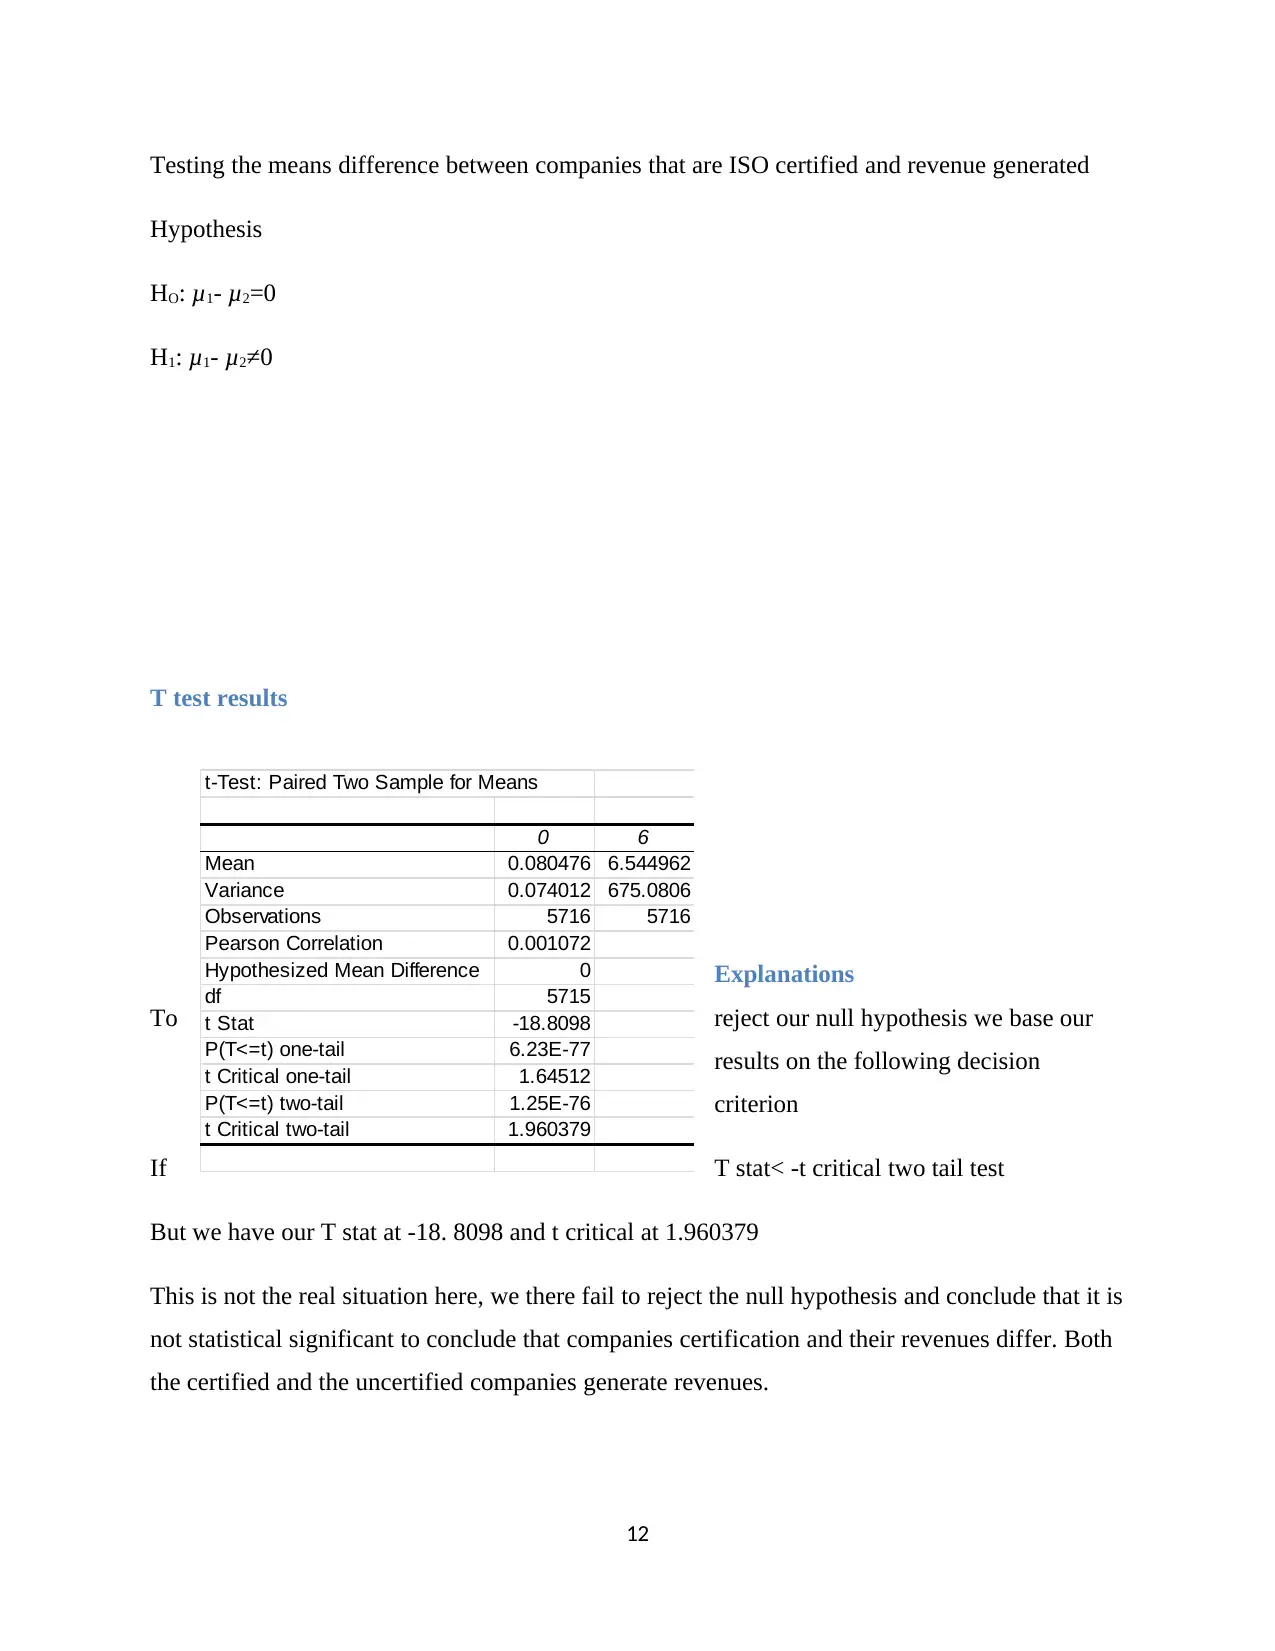
Testing the means difference between companies that are ISO certified and revenue generated
Hypothesis
HO: μ1- μ2=0
H1: μ1- μ2≠0
T test results
Explanations
To reject our null hypothesis we base our
results on the following decision
criterion
If T stat< -t critical two tail test
But we have our T stat at -18. 8098 and t critical at 1.960379
This is not the real situation here, we there fail to reject the null hypothesis and conclude that it is
not statistical significant to conclude that companies certification and their revenues differ. Both
the certified and the uncertified companies generate revenues.
12
t-Test: Paired Two Sample for Means
0 6
Mean 0.080476 6.544962
Variance 0.074012 675.0806
Observations 5716 5716
Pearson Correlation 0.001072
Hypothesized Mean Difference 0
df 5715
t Stat -18.8098
P(T<=t) one-tail 6.23E-77
t Critical one-tail 1.64512
P(T<=t) two-tail 1.25E-76
t Critical two-tail 1.960379
⊘ This is a preview!⊘
Do you want full access?
Subscribe today to unlock all pages.
Trusted by 1+ million students worldwide
1 out of 19
Related Documents


Your All-in-One AI-Powered Toolkit for Academic Success.
+13062052269
info@desklib.com
Available 24*7 on WhatsApp / Email
![[object Object]](/_next/static/media/star-bottom.7253800d.svg)
Unlock your academic potential
Copyright © 2020–2026 A2Z Services. All Rights Reserved. Developed and managed by ZUCOL.