Evaluation of ISO Standards Impact: A Study of Chinese Firms
VerifiedAdded on 2023/01/12
|21
|3822
|73
Report
AI Summary
This report investigates the impact of ISO 9000 standards on the Chinese service industry, analyzing data from 5717 companies. The study compares ISO-certified and non-certified firms, examining the effects on revenue, profit, return on assets (ROA), and return on sales (ROS). Key findings reveal that ISO-certified companies had significantly higher sales and profit, but lower ROS and ROA compared to non-certified firms. The report also notes a positive correlation between operational profit and ROA, and between ROS and profit. Furthermore, the educational qualification of employees was significantly related to ISO adoption status. The study recommends that non-ISO firms adopt ISO guidelines to improve their performance, and suggests further research to include external factors like GST. The methodology includes descriptive and inferential analyses, such as t-tests, ANOVA, and chi-square tests, to validate the hypotheses.
RUNNING HEAD: ASSESSMENT OF THE IMPACT OF ISO STANDARDS – A STUDY OF CHINESE FIRMS
Assessment of the Impact of ISO Standards
– A study of Chinese Firms
Executive Summary
Objective
Assessment of the Impact of ISO Standards
– A study of Chinese Firms
Executive Summary
Objective
Paraphrase This Document
Need a fresh take? Get an instant paraphrase of this document with our AI Paraphraser
2
ISO 9000 has become a prerequisite for production and service companies. Several
issues have been raised following the positive/negative effect of the ISO 9000 standard. The
scholar has explored the significance of adopting the ISO 9000 standard in efforts to explain
the companies’ improvement in sales and profit.
Findings
The average income and profit of non ISO standard companies were significantly
lower than that of ISO-certified Chinese companies. On the contrary, average ROS and ROA
of ISO-certified companies were significantly lower than in non-ISO companies. The
correlation between profit of operation and ROA was significantly positive. It was noted that
there was a reasonable positive correlation between ROS and profit, which was statistically
significant. The relation between educational qualification of employees and ISO adoption
status was noted to be statistically significant.
Recommendation
The management of non ISO Chinese firms should adopt the ISO guidelines by
implementing the standards. Inefficient utilization of operational facilities and assets in ISO
firms was probably the cause of lower ROS and ROA of ISO-certified companies, and the
management should focus on the ambiguities. Upcoming study can also include external
factor, such as GST to assess the impact on ROS and ROA with structural equation
modelling.
Table of Contents
Executive Summary...................................................................................................................2
Objective.................................................................................................................................2
3
Findings..................................................................................................................................2
Recommendation....................................................................................................................2
Introduction................................................................................................................................4
Literature Review.......................................................................................................................5
Hypotheses..............................................................................................................................6
Methodology..............................................................................................................................7
Sample Characteristics...........................................................................................................7
Variables of Interest...............................................................................................................8
Design of the Study.................................................................................................................8
Analysis and Findings................................................................................................................8
Descriptive Analysis...............................................................................................................8
Inferential Analysis...............................................................................................................11
Discussion................................................................................................................................14
Limitations and Scope..............................................................................................................15
References................................................................................................................................16
Appendices...............................................................................................................................18
Introduction
Background: The ISO 9000 standard has been introduced by an increasing number of
organizations around the world. Concern for managers has been always the implementation
⊘ This is a preview!⊘
Do you want full access?
Subscribe today to unlock all pages.
Trusted by 1+ million students worldwide
4
requirement and the impact on employees. The impact of this ISO standard on quality
management and productivity improvement is broadly debated. Unfortunately, little is known
about why should companies implement or resist the use of the ISO 9000 standard.
Purpose: ISO 9000 has become a prerequisite for production and service companies.
Several issues have been raised following the impact of the ISO 9000 standard. Whether
certification will help to improve the sale? Will the profit get improved? Will the return on
asset and sales get improved? These topics were examined by analysing data from the sample
of 5717 Chinese service companies, among which 5257 companies were ISO 9000 certified
between 2004 and 2008.
Research Objectives: This research has explored the significance of adopting the
ISO 9000 standard in efforts to explain the companies’ improvement in sales and profit. In
doing so, the scholar examined efficiency of the ISO 9000 system from seven different
angles. The positive/negative impact of ISO certification on sales, profit, return on assets
(ROA) and return on sales (ROS) have been scrutinized.
Format: This report discusses the background literature to construct the foundation.
In methodology section the scholar has explained the approach of the research. Data analysis
results have been elaborately discussed with descriptive and inferential results. The report
comprises of specific managerial advises and concludes with future scope of exploration.
Literature Review
Nair and Pajogo (2009) underlined the need for internalisation in particular when
revising the ISO 9000 standard. This is because it is a process of incorporating hidden and
Paraphrase This Document
Need a fresh take? Get an instant paraphrase of this document with our AI Paraphraser
5
explicit information into the organization and translating it into knowledge (Heras-
Saizarbitoria, 2011). Lobo, Matawie, & Samaranayake (2012) noted that the proposed
QMS by ISO 9000 can be used to keep information coding that can promote data storage and
knowledge transfer. Previous findings show that researchers need to pay more attention to the
demands of the company's actual implementation of standards, not just certification (Psomas,
Fotopoulos, & Kafetzopoulos, 2010). Authentication is a form of symbolic behaviour that
differs from the implementation of authentication policies. While previous studies have also
shown that companies can implement management systems instead of not being certified, and
some certification companies can exceed the standard requirements (Ab Wahid, & Corner,
2009).
Empirical research to check the impact of ISO certification is not ultimate. Some
researches show a strong impact of the ISO certification on company's operations (Sampaio,
Saraiva, & Monteiro, 2012). A positive correlation between the ISO certification and
business performance of empirical research is not always significant (Molina‐Azorín, Tarí,
Claver‐Cortés, & López‐Gamero, 2009). Generally, it is expected that company's
performance will improve significantly after the introduction of ISO 9000 certification.
However, empirical evidence related to ISO certification and business results does not
produce conclusive results. In some studies some evidences are found that confirms that ISO
certification and company’s market value and performance are positively correlated
(Mokhtar, & Muda, 2012). After ISO certification, the business and economic performance
of Spanish companies was observed to improve significantly and positively after
announcement of ISO Certification (Heras-Saizarbitoria, 2011).
Following the adoption of economic reforms and the Open Door policy 1978, China
has become an important player in the global economy. The pace of internationalization in
China has left a very deep impression. The Chinese economy has changed a lot in the last
6
three decades. 1978 economic reforms led to China's high economic growth and rapid
industrialisation (Saccone, & Valli, 2009). China's GDP grows by nearly 10% per annum,
the world's fastest growing economy. The service sector is very important for the global
economy (Lee, To, & Yu, 2009). In the global economy and in the current market
competition, service companies are looking for developing a prudent internal management
system and implementing its internationally recognised management standards (Psomas,
Pantouvakis, & Kafetzopoulos, 2013). The ISO 9000 standard applies to large and small
systems, private and public, industry, trade and service organisations (Walker and Johnson,
2009).
This study restricts itself on reviewing the impact of ISO 9000 implementation on
revenue, profit, return on sales, and return on assets. Chinese companies were taken into the
consideration, and a comparative exploration has been prepared for ISO complaint and non
ISO firms. Seven under mentioned hypotheses have been verified with the help of descriptive
and inferential analyses.
Hypotheses
Average revenue earned by the companies is higher in ISO certified Chinese
companies.
Average profit earned by the company is higher in ISO certified Chinese companies.
Average return on sales in ISO certified companies is higher than non ISO
organisations.
Average return on assets in ISO certified companies is higher than non ISO
organisations.
Average ROA and ROS in ISO certified companies vary across the industry category.
Revenue, profit for operating, ROS and ROA have significant pairwise correlations.
⊘ This is a preview!⊘
Do you want full access?
Subscribe today to unlock all pages.
Trusted by 1+ million students worldwide
7
Educational qualification of employees is related to ISO adoption status.
Methodology
Sample Characteristics
A total of 5717 companies belonging to Chinese service industry were selected from
the database of 2008, published by the National Bureau of Statistics of China. An economic
census of the service firms was conducted, where ISO 9000 standard certified and listed
companies, as well as non ISO companies were selected. The 460 ISO certified companies
got the certification between 2004 and 2008. The selected 5715 companies belong to one of
the industries: “Storage and Transportation”, “Telecommunication”, “Computer Service”,
“Software”, “Business Services”, “Research and Development”, “Specialized Technology
Services”, “Technology Exchange and Promotion”.
Employee strength, “numbers of employees with master or doctor degree”, bachelor
degree, diploma, high school education or junior high school indicate the staff strength and
qualification of the employees. Sales figure, profit, total asset, equity, and total capital are
some of the important variables. “Capital from the government”, overseas, and from other
sources indicate the source of capital of the companies. Return on sales and assets, overseas
investment, and age of the company were noted
Variables of Interest
In accordance with the hypotheses, the scholar restricted the scope of this article to
evaluate the impact of ISO adoption on sales, profit, return on sales and assets of the
company. ISO status is an ordinal variable. Sales, profit, return on sales and assets of the
company are continuous variable (ratio variables).
Paraphrase This Document
Need a fresh take? Get an instant paraphrase of this document with our AI Paraphraser
8
Design of the Study
Descriptive information of the sample for continuous as well as categorical variables
has been evaluated. Based on search direction of the hypotheses, inferential analyses have
been conducted. Revenue, profit, ROA, and ROS are assumed to be normally distributed
using Central Limit Theorem, as number of observations in the sample was large enough (n >
30). In the first four hypotheses, average for revenue, profit, ROA, and ROS have been
compared between ISO and non ISO standard companies. In these cases the t-test has been
used for inferential analysis. The fifth hypothesis has been verified using the one-way
ANOVA. Pearson’s correlation has been used to test the sixth hypothesis. Lastly, whether
educational qualification of employees was related to ISO adoption or not, has been tested
using chi-square test of independence.
Analysis and Findings
Descriptive Analysis
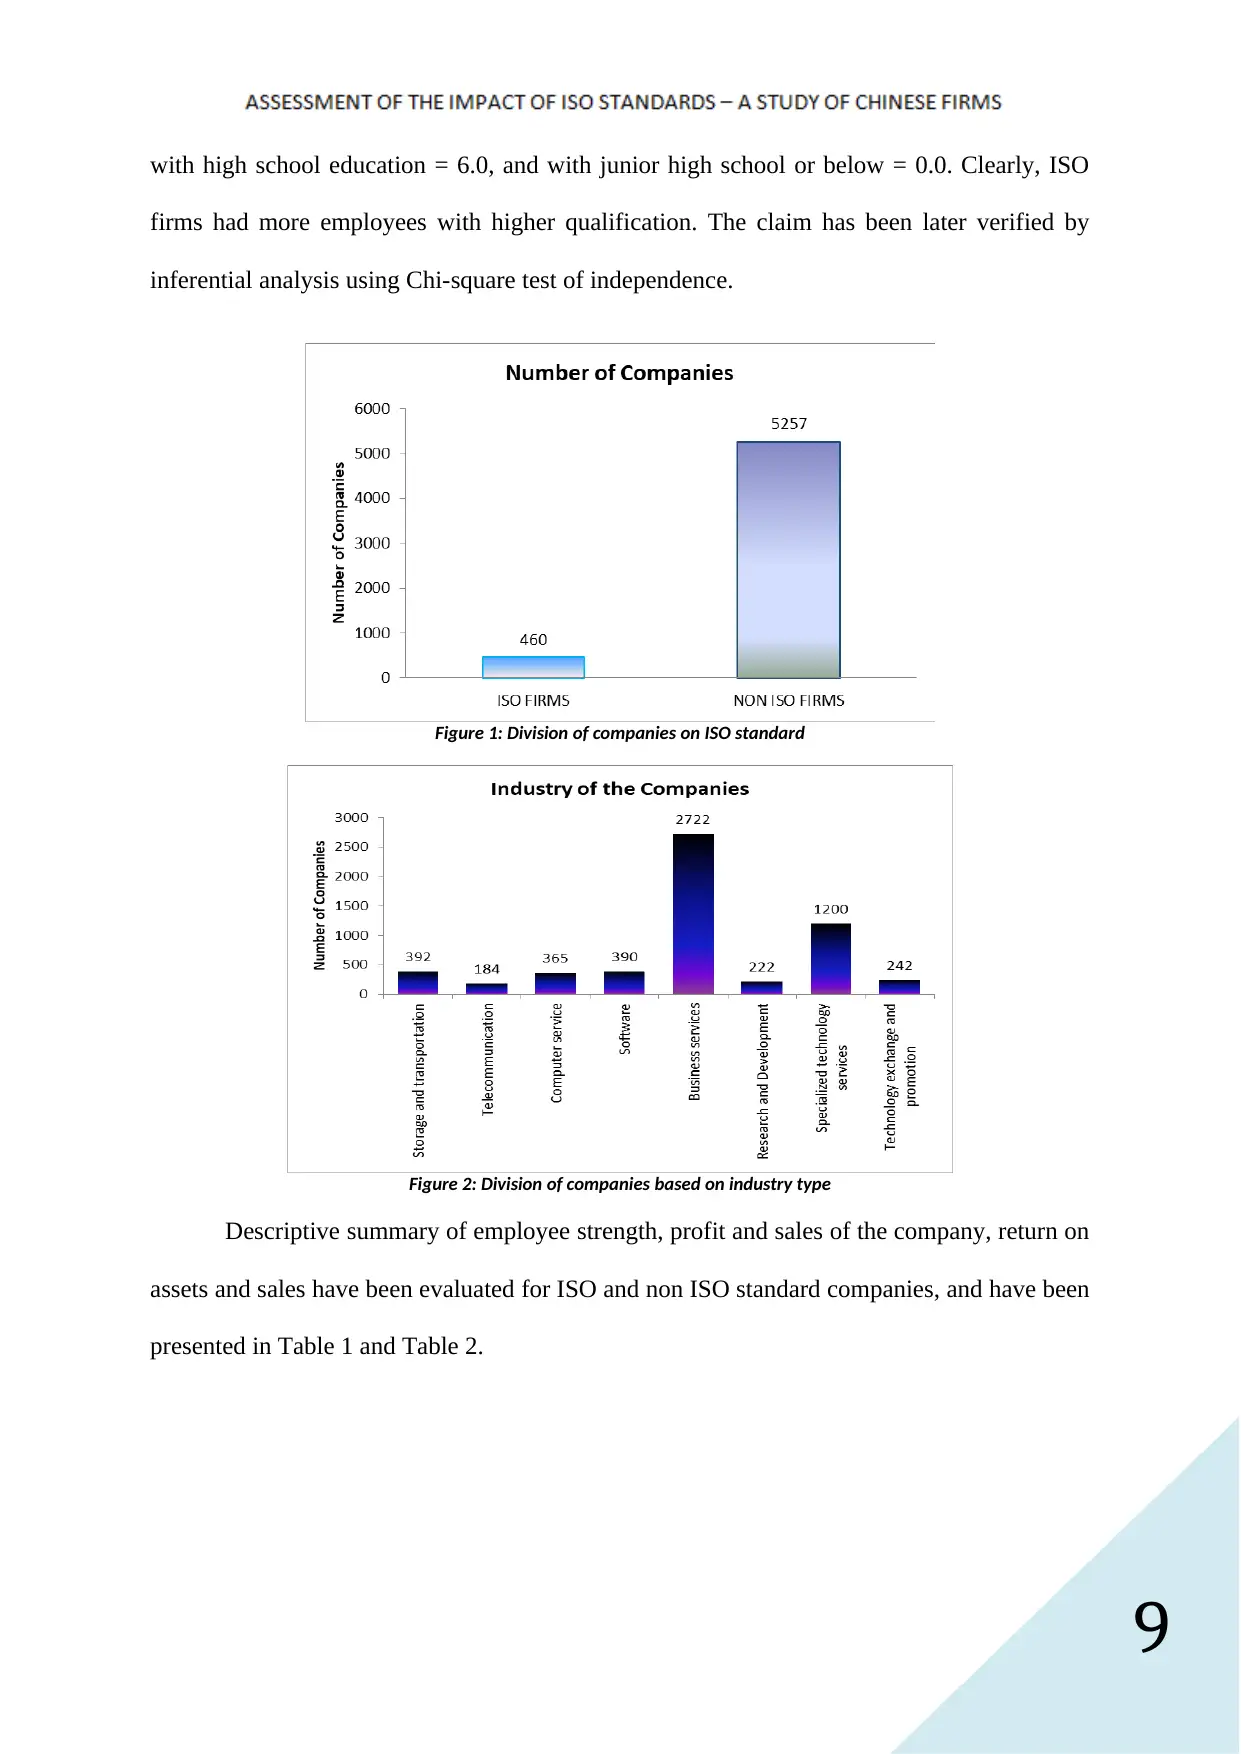
The 5717 companies in the sample were first categorised in ISO (N = 460) and non
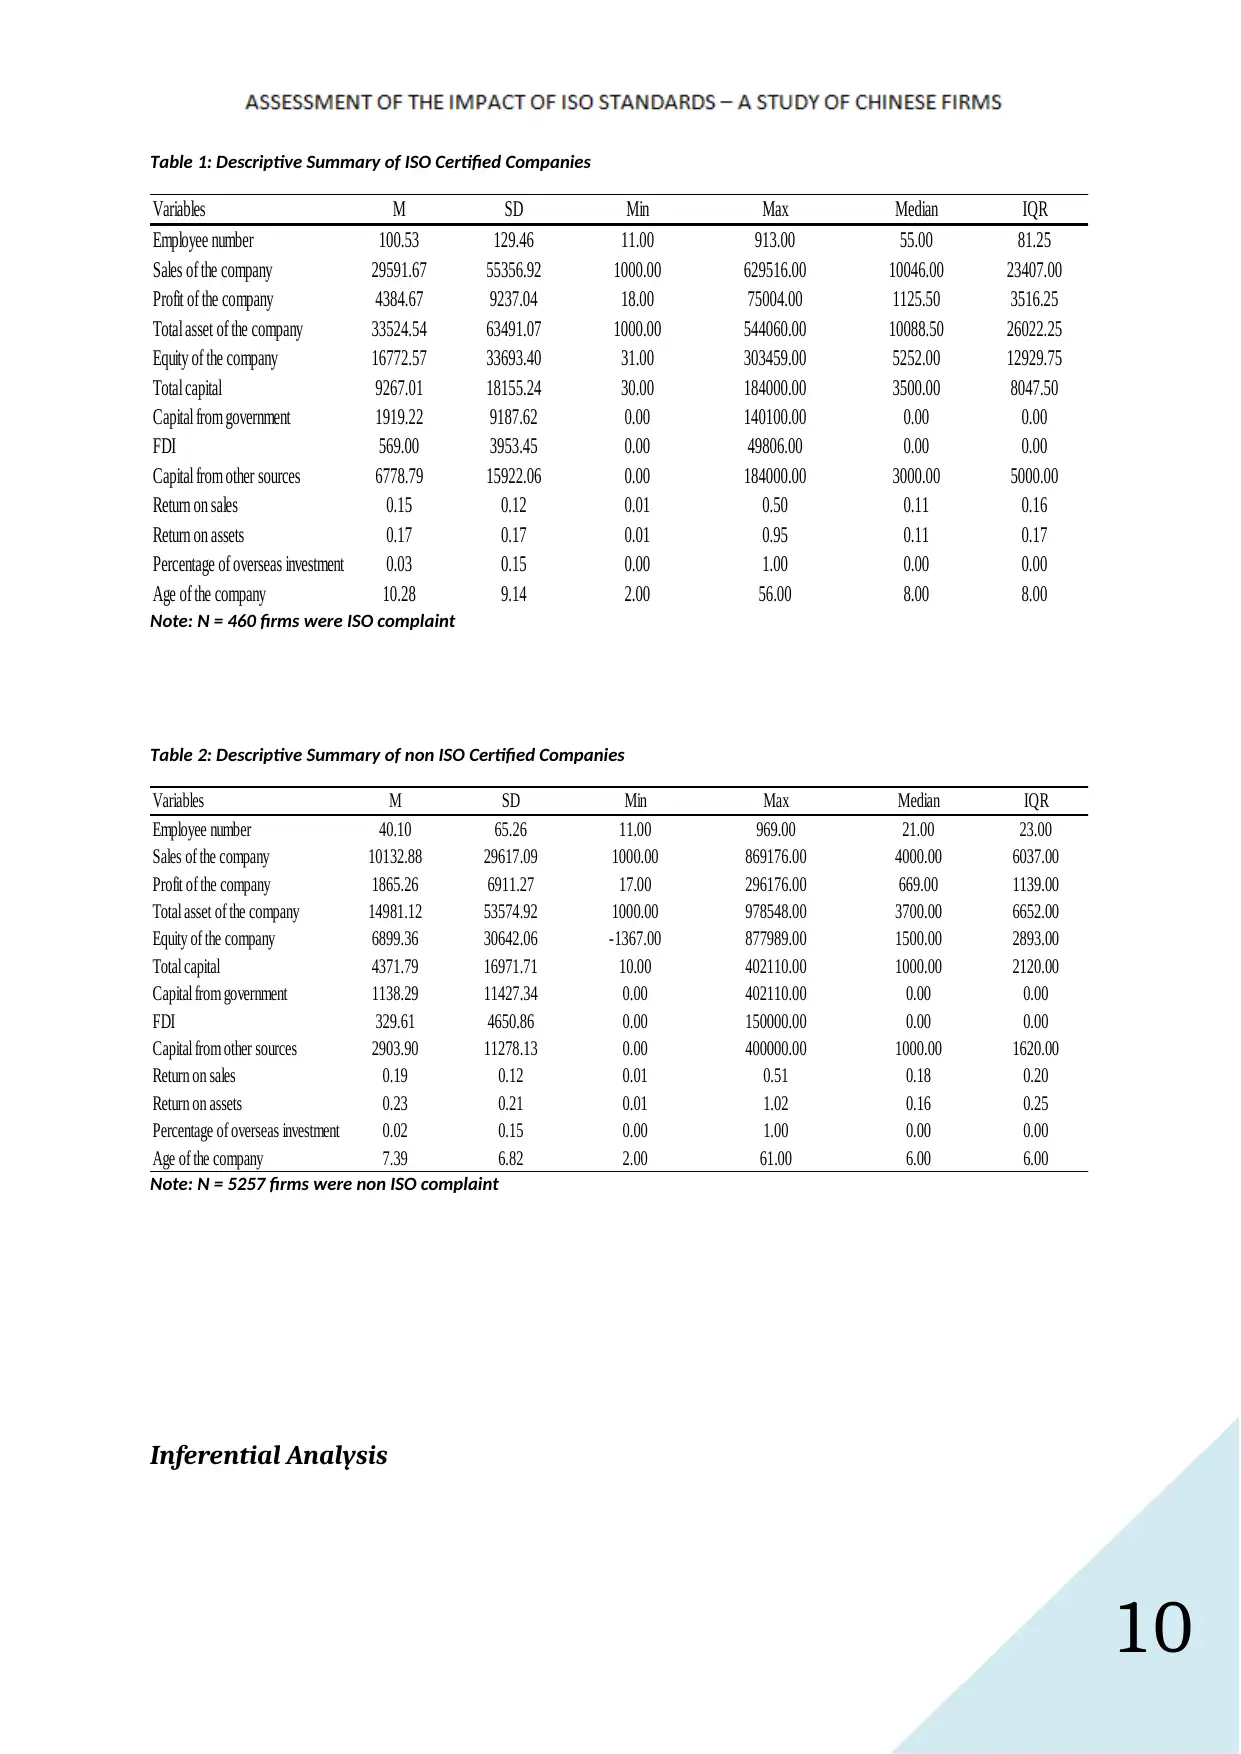
ISO firms (N = 5257). These Chinese firms were also categorised under eight industry type.
From Figure 2 it can be noted that majority of firms were from business services and
specialized technology services. Number of companies from rest six industry types ranged
between 184 and 392. Education level of the employees has been summarized separately for
ISO and non ISO complaint firms. In non ISO companies, average number of employees with
master or doctor = 1.1, with bachelor degree = 9.5, diploma = 11.3, with high school
education = 11.6, and with junior high school or below = 6.5. In ISO firms, average number
of employees with master or doctor = 1.0., with bachelor degree = 19.5, with diploma = 16.0,
Design of the Study
Descriptive information of the sample for continuous as well as categorical variables
has been evaluated. Based on search direction of the hypotheses, inferential analyses have
been conducted. Revenue, profit, ROA, and ROS are assumed to be normally distributed
using Central Limit Theorem, as number of observations in the sample was large enough (n >
30). In the first four hypotheses, average for revenue, profit, ROA, and ROS have been
compared between ISO and non ISO standard companies. In these cases the t-test has been
used for inferential analysis. The fifth hypothesis has been verified using the one-way
ANOVA. Pearson’s correlation has been used to test the sixth hypothesis. Lastly, whether
educational qualification of employees was related to ISO adoption or not, has been tested
using chi-square test of independence.
Analysis and Findings
Descriptive Analysis
The 5717 companies in the sample were first categorised in ISO (N = 460) and non
ISO firms (N = 5257). These Chinese firms were also categorised under eight industry type.
From Figure 2 it can be noted that majority of firms were from business services and
specialized technology services. Number of companies from rest six industry types ranged
between 184 and 392. Education level of the employees has been summarized separately for
ISO and non ISO complaint firms. In non ISO companies, average number of employees with
master or doctor = 1.1, with bachelor degree = 9.5, diploma = 11.3, with high school
education = 11.6, and with junior high school or below = 6.5. In ISO firms, average number
of employees with master or doctor = 1.0., with bachelor degree = 19.5, with diploma = 16.0,
9
with high school education = 6.0, and with junior high school or below = 0.0. Clearly, ISO
firms had more employees with higher qualification. The claim has been later verified by
inferential analysis using Chi-square test of independence.
Figure 1: Division of companies on ISO standard
Figure 2: Division of companies based on industry type
Descriptive summary of employee strength, profit and sales of the company, return on
assets and sales have been evaluated for ISO and non ISO standard companies, and have been
presented in Table 1 and Table 2.
⊘ This is a preview!⊘
Do you want full access?
Subscribe today to unlock all pages.
Trusted by 1+ million students worldwide
10
Table 1: Descriptive Summary of ISO Certified Companies
Variables M SD Min Max Median IQR
Employee number 100.53 129.46 11.00 913.00 55.00 81.25
Sales of the company 29591.67 55356.92 1000.00 629516.00 10046.00 23407.00
Profit of the company 4384.67 9237.04 18.00 75004.00 1125.50 3516.25
Total asset of the company 33524.54 63491.07 1000.00 544060.00 10088.50 26022.25
Equity of the company 16772.57 33693.40 31.00 303459.00 5252.00 12929.75
Total capital 9267.01 18155.24 30.00 184000.00 3500.00 8047.50
Capital from government 1919.22 9187.62 0.00 140100.00 0.00 0.00
FDI 569.00 3953.45 0.00 49806.00 0.00 0.00
Capital from other sources 6778.79 15922.06 0.00 184000.00 3000.00 5000.00
Return on sales 0.15 0.12 0.01 0.50 0.11 0.16
Return on assets 0.17 0.17 0.01 0.95 0.11 0.17
Percentage of overseas investment 0.03 0.15 0.00 1.00 0.00 0.00
Age of the company 10.28 9.14 2.00 56.00 8.00 8.00
Note: N = 460 firms were ISO complaint
Table 2: Descriptive Summary of non ISO Certified Companies
Variables M SD Min Max Median IQR
Employee number 40.10 65.26 11.00 969.00 21.00 23.00
Sales of the company 10132.88 29617.09 1000.00 869176.00 4000.00 6037.00
Profit of the company 1865.26 6911.27 17.00 296176.00 669.00 1139.00
Total asset of the company 14981.12 53574.92 1000.00 978548.00 3700.00 6652.00
Equity of the company 6899.36 30642.06 -1367.00 877989.00 1500.00 2893.00
Total capital 4371.79 16971.71 10.00 402110.00 1000.00 2120.00
Capital from government 1138.29 11427.34 0.00 402110.00 0.00 0.00
FDI 329.61 4650.86 0.00 150000.00 0.00 0.00
Capital from other sources 2903.90 11278.13 0.00 400000.00 1000.00 1620.00
Return on sales 0.19 0.12 0.01 0.51 0.18 0.20
Return on assets 0.23 0.21 0.01 1.02 0.16 0.25
Percentage of overseas investment 0.02 0.15 0.00 1.00 0.00 0.00
Age of the company 7.39 6.82 2.00 61.00 6.00 6.00
Note: N = 5257 firms were non ISO complaint
Inferential Analysis
Paraphrase This Document
Need a fresh take? Get an instant paraphrase of this document with our AI Paraphraser
11
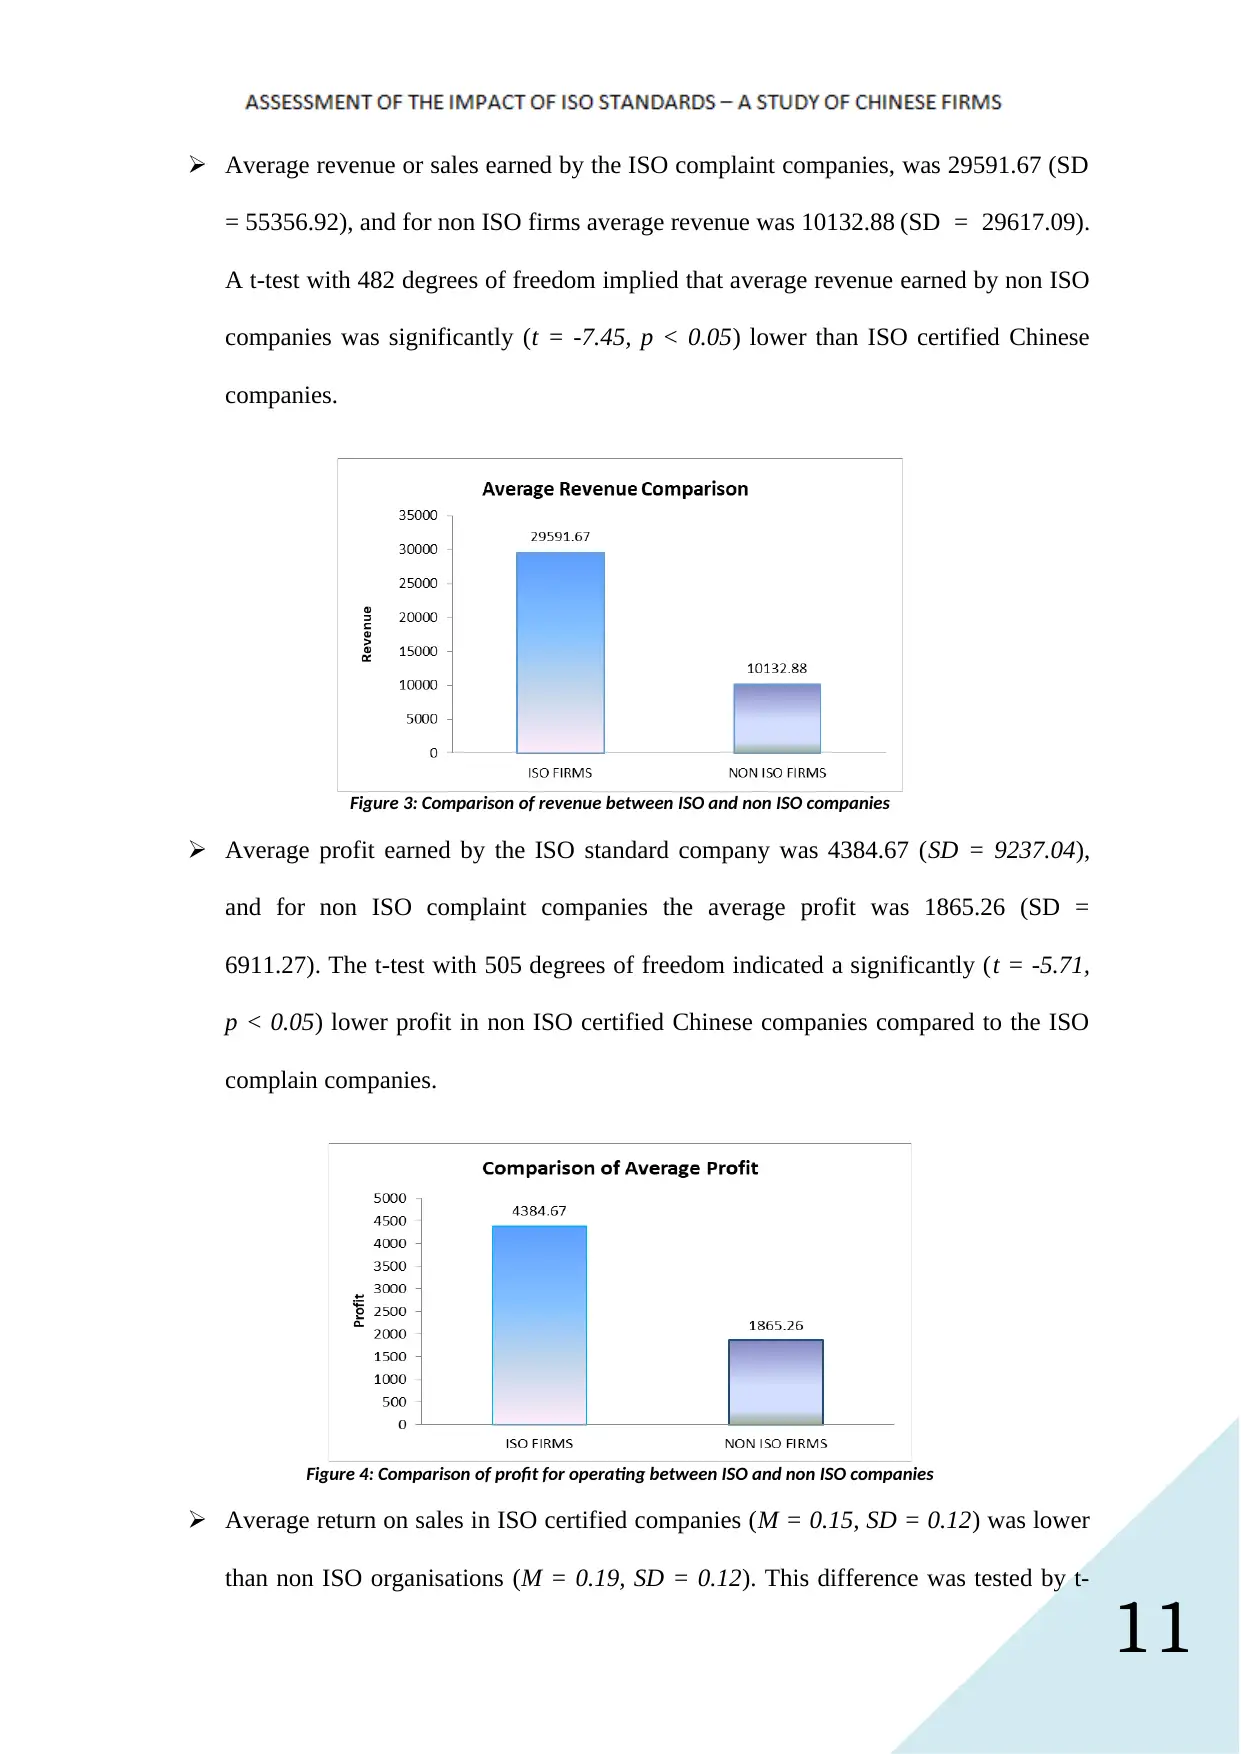
Average revenue or sales earned by the ISO complaint companies, was 29591.67 (SD
= 55356.92), and for non ISO firms average revenue was 10132.88 (SD = 29617.09).
A t-test with 482 degrees of freedom implied that average revenue earned by non ISO
companies was significantly (t = -7.45, p < 0.05) lower than ISO certified Chinese
companies.
Figure 3: Comparison of revenue between ISO and non ISO companies
Average profit earned by the ISO standard company was 4384.67 (SD = 9237.04),
and for non ISO complaint companies the average profit was 1865.26 (SD =
6911.27). The t-test with 505 degrees of freedom indicated a significantly (t = -5.71,
p < 0.05) lower profit in non ISO certified Chinese companies compared to the ISO
complain companies.
Figure 4: Comparison of profit for operating between ISO and non ISO companies
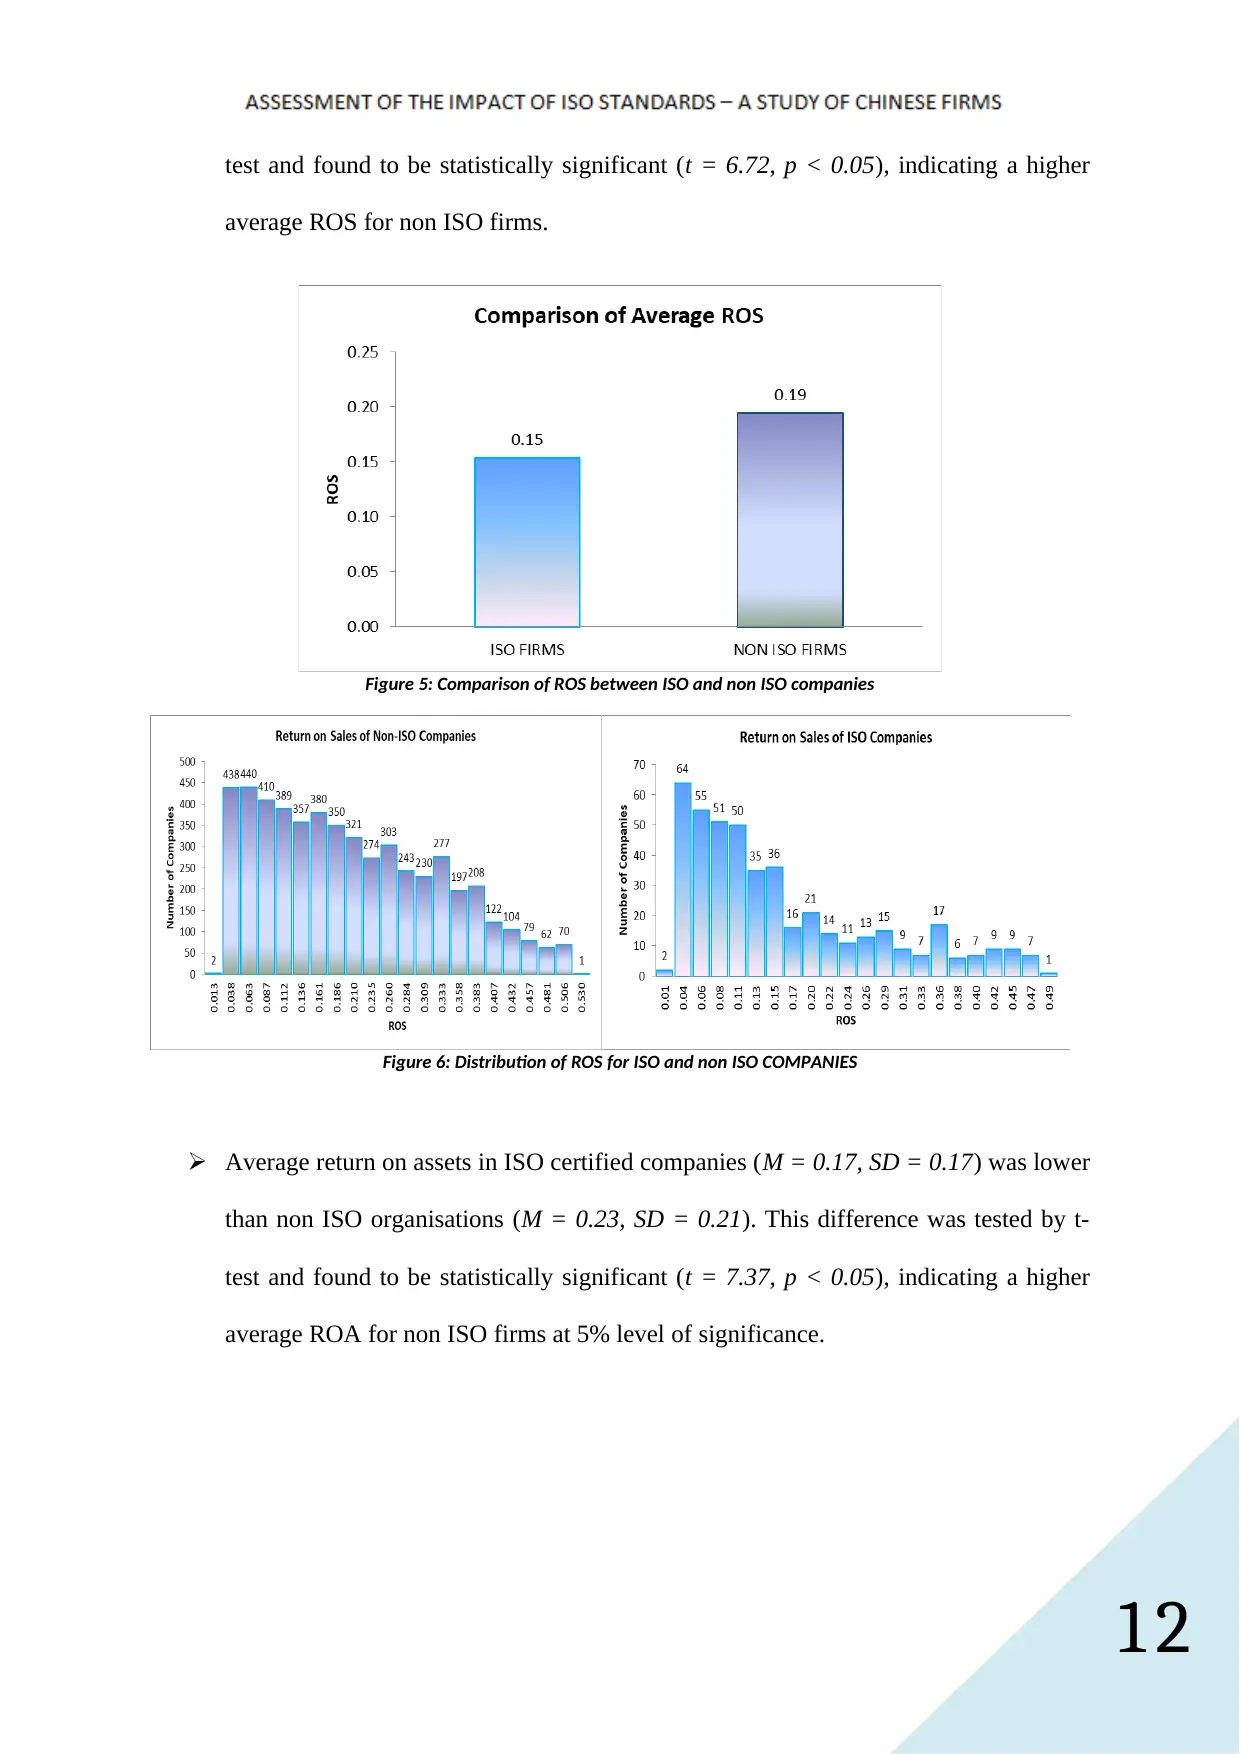
Average return on sales in ISO certified companies (M = 0.15, SD = 0.12) was lower
than non ISO organisations (M = 0.19, SD = 0.12). This difference was tested by t-
Average revenue or sales earned by the ISO complaint companies, was 29591.67 (SD
= 55356.92), and for non ISO firms average revenue was 10132.88 (SD = 29617.09).
A t-test with 482 degrees of freedom implied that average revenue earned by non ISO
companies was significantly (t = -7.45, p < 0.05) lower than ISO certified Chinese
companies.
Figure 3: Comparison of revenue between ISO and non ISO companies
Average profit earned by the ISO standard company was 4384.67 (SD = 9237.04),
and for non ISO complaint companies the average profit was 1865.26 (SD =
6911.27). The t-test with 505 degrees of freedom indicated a significantly (t = -5.71,
p < 0.05) lower profit in non ISO certified Chinese companies compared to the ISO
complain companies.
Figure 4: Comparison of profit for operating between ISO and non ISO companies
Average return on sales in ISO certified companies (M = 0.15, SD = 0.12) was lower
than non ISO organisations (M = 0.19, SD = 0.12). This difference was tested by t-
12
test and found to be statistically significant (t = 6.72, p < 0.05), indicating a higher
average ROS for non ISO firms.
Figure 5: Comparison of ROS between ISO and non ISO companies
Figure 6: Distribution of ROS for ISO and non ISO COMPANIES
Average return on assets in ISO certified companies (M = 0.17, SD = 0.17) was lower
than non ISO organisations (M = 0.23, SD = 0.21). This difference was tested by t-
test and found to be statistically significant (t = 7.37, p < 0.05), indicating a higher
average ROA for non ISO firms at 5% level of significance.
⊘ This is a preview!⊘
Do you want full access?
Subscribe today to unlock all pages.
Trusted by 1+ million students worldwide
1 out of 21
Related Documents


Your All-in-One AI-Powered Toolkit for Academic Success.
+13062052269
info@desklib.com
Available 24*7 on WhatsApp / Email
![[object Object]](/_next/static/media/star-bottom.7253800d.svg)
Unlock your academic potential
Copyright © 2020–2026 A2Z Services. All Rights Reserved. Developed and managed by ZUCOL.