ISO 9000 Adoption: Financial Performance and Management Effects
VerifiedAdded on 2019/10/31
|13
|3431
|130
Report
AI Summary
This report investigates the impact of ISO 9000 adoption on the financial performance and management practices of service firms in China. The study utilized a census approach, collecting data via questionnaires from 5717 firms. The research aimed to determine the effects of ISO 9000 adoption on financial outcomes and the impact of certification on firm management. Data analysis involved descriptive and inferential statistics, using SPSS to generate tables and test hypotheses. The findings reveal insights into the relationship between employee qualifications, particularly their education levels and professional skills, and the financial performance of the companies. The report emphasizes the importance of considering employee attributes during hiring to enhance company commitment and, consequently, financial results. Literature review highlights the importance of ISO adoption and the effects on companies' financial performance as well as certification effects of ISO 9000. The methodology employed a census and questionnaire for data collection, with results interpreted to guide management decisions. The study also references the evolution of ISO standards to adapt to business changes and the benefits of long-term certification.
Executive summary
The purpose of this report was to determine the impact of adoption of ISO 9000 on the financial
performance of a firm and lastly to determine the effects of certification of ISO on a firm’s
management. Several literature was discussed on the importance of ISO adoption and their
impacts on the companies’ financial performance as well as certification effects of ISO 9000.
The method that was engaged in data collection was through census and the use of questionnaire
as a tool of collecting data. The population of the targeted companies was 5717 that included all
the service firms in china. The collected data was entered in Statistical Package for Social
Science (SPSS) to generate tables and carryout hypothesis testing. The obtained results were then
interpreted into information of what they truly represent. Managers are then advised from this
report to consider the number, level of education and the professional skills of the employees
when they are hired to get committed to the companies since it has direct relationship to the
financial performance of the companies.
Paraphrase This Document
Need a fresh take? Get an instant paraphrase of this document with our AI Paraphraser
Introduction
Quality of the management is one of the key concerns of all industries. As a result therefore, ISO
9000 was developed and introduced to provide the guidance and tools to the companies and
organizations which have the focus of consistent production of goods and services that meet the
requirements of the customers and also ascertaining for their improved quality. Popularity of ISO
has increased in the past years for both small and big companies since it articulates how the
management operations of the companies should be conducted. The international standards
organizations ensure that all the products and services are designed and created in manner that
they conform to the predetermined standards. More than 100 nations have adopted ISO 9000 in
their companies’ management and quality assurance. This report is developed and aimed at
meeting the following objectives; i) Determining the impact of adoption of ISO 9000 on the
financial performance of a firm and ii) Determining the effects of certification with ISO 9000 on
a firm’s management. Meeting these two stated objectives will help to clarify the understanding
of impacts created by ISO 9000 and also the certification effects on the firm’s management.
Literature review
Numerous researches have been carried out around the globe concerning ISO 9000 since its
invention and development on the effects and impact on business performance with the same
results being arrived at. Different researches will therefore be reviewed in this report with
various literatures portraying different framework and methods that are used to measure
certification impact. Some of the studies have advocated that certification of ISO leads to
improved financial performance. According (Chatzoglou et al, 2015), holistic overview by
studies to cover all the components that can be seen to have effects and relationship on how the
financial performance can be achieved can result to obtaining positive financial benefits. The
impact of ISO certification can be indirectly measured to determine the financial performance of
a company by using comprehensive conceptual framework. The impact of certification success is
determined by the degree of certification effectiveness, this is according to (Posmas et al, 2013).
Operational performance is directly improved that have direct effect in increasing the financial
performance though direct relationship might not be there between ISO and financial
performance. According to (Ismyrlis & Moschidis, 2015), they argued that external perspectives
form the most important benefits of certification. This was so as obtained from evaluation of
impacts of the implementation of ISO. Some of the most important benefits derived from ISO are
external in nature that portray higher operational performance.
Adoption of ISO 9000 in business was with the aim of adding quality and value to the
management of the business. Incorporating and adopting ISO 9000 should be for development
reasons to realize the optimum benefits other than when companies acquire it for non-
developmental purposes, this will make them realize less benefits from it, this is according to
(Papadimitriou & Westerheijden, 2010). In response to that, companies are supposed to be
evaluated depending on their objectives and categories separately to determine their benefits
from ISO 9000 (Franceschini et al, 2010). When carrying out market differentiation strategy,
certified companies by ISO 9000 show profit increase when operationalizing cost leadership
strategy (Lafuente et al, 2010). The benefits derived from ISO 9000 certification are motivational
factors that are significant in giving positive predictions. ISO has been undergoing updates to
uphold the changes available in businesses environment and focus on quality improvements.
Compared to non-ISO companies, companies certified by ISO 9000 show higher levels of
improvement in their practices (Zaramdini, 2007). Time has been a very important factor in
almost all the activities carried out in any business operation. In regards to that, companies that
⊘ This is a preview!⊘
Do you want full access?
Subscribe today to unlock all pages.
Trusted by 1+ million students worldwide
had been certified for long period of time portray better improvements of TQM results.
Companies certified in the recent past years with updated ISO 9000 of other versions enjoy more
benefits with time as compared to their counterparts certified with traditional ISO 9000. Business
financial performance improvement can be visualized and analyzed for ISO 9000 certified
companies by applying 3 to 5 years of post-certified period (Chow-Chua et al, 2003).
Companies and businesses of any size have adopted the ISO 9000 in their management
(Bernardo et al, 2015). Process of ISO 9000 is not affected by the business or company size on
the impacts it create to the business. All the factors determining the size of the company such as
the number of employees do not show any evidence of becoming more likely to be certified since
the size of the company does not have any effect in the relationship between the organization
performance and implementation of ISO 9000 (Psomas et al, 2012). Certification of a company
by ISO 9000 shows significant and positive effect on the company’s operational performance.
Among other benefits that are enjoyed by a firm are external benefits from ISO 9000
certification since they enable the companies to bid for tenders thus improving their
performance.
Methodology
Emergence of ISO 9000 in 1980s have made the companies to acquire and adopt it for their
quality management. The number had grown enormously for the companies that have adopted
ISO 9000 in more than 100 countries. Questionnaires form one of the most used common type of
survey methodology. The type of survey have experienced increase since after 1980s more so for
the quality management in the area of operations management field. In this case census was
carried out by National Bureau of Statistics of China on the service firms. There were a total of
5717 service firms that data were collected from which covered the entire population of the
Paraphrase This Document
Need a fresh take? Get an instant paraphrase of this document with our AI Paraphraser
service firms in china. In order to accomplish this smoothly, the questionnaires were sent to all
the firms where the relevant authorities (managers or the managing directors for smaller firms)
provided all the provided details concerning their firms cutting across the number of employees,
year of certification of the company, the year when the companies were found, sales of company
and many more. All the companies in the region were then required to fill the questionnaires
presented to them by the National Bureau of Statistics of China. The census method is expensive
and time consuming since all the firms irrespective of their locations, they were to be reached
since they formed part of the population (Hajian & Domingo-Ferrer, 2013). No sampling method
is applied in this case and therefore no information is left to chance for any of the service firms
in the country.
All the collected data were then entered in excel and the SPSS version 20 for the analysis of data.
These two statistical software were used to represent the data in both tables and graphs for easy
understanding and interpretation. Statistical tools that were used to derive the meaning from data
were descriptive statistics and also inferential statistics. Census was used in the collection of data
so that no service firm is left out and the entire population of service firms covered. This ensures
that all the information that will be obtained from this kind of data will be a reality but not a
representation from a proportion. The statistics that will be obtained will be population parameter
that will stand as the point of reference for the sample data from this dataset for the future
studies. These data can therefore be relied upon in the determination of impact of the adoption of
ISO 9000 on the financial performance and the determination of the certification of the firm’s
management with ISO 9000.
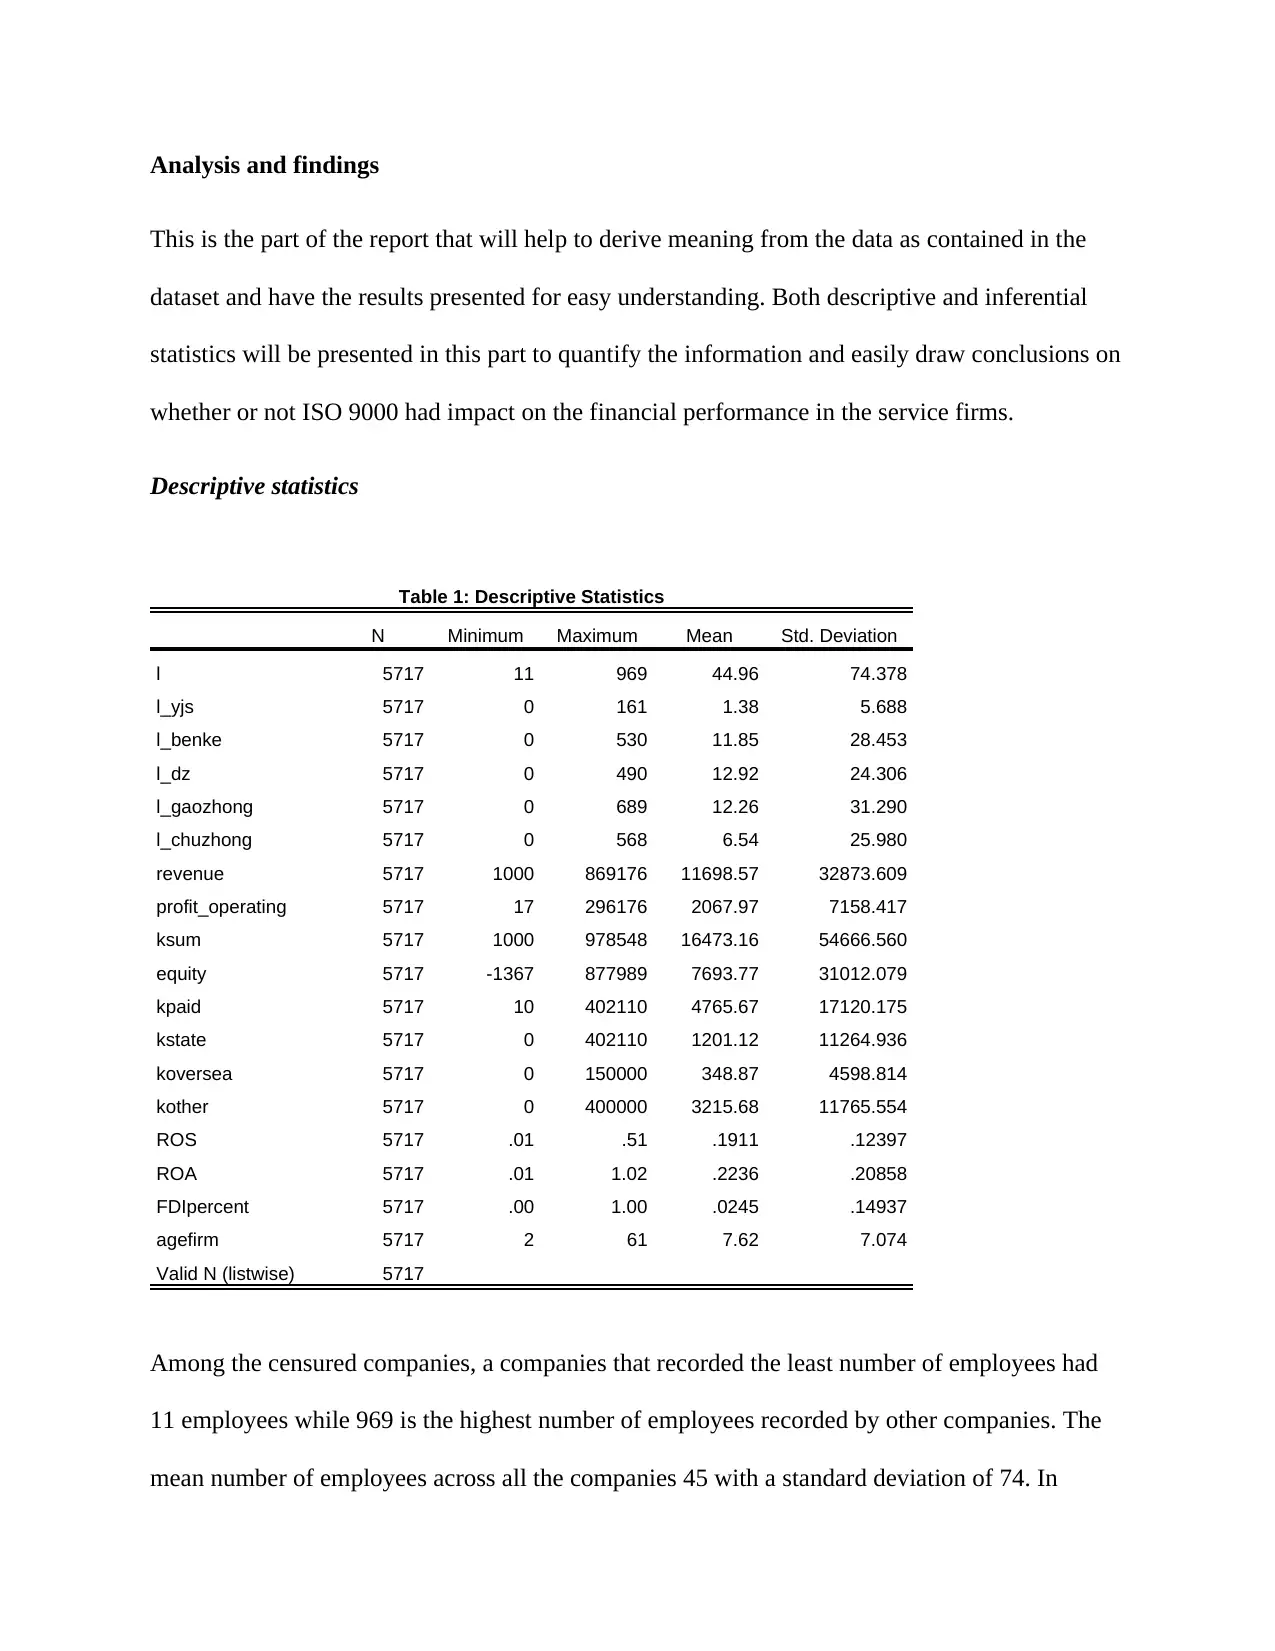
Analysis and findings
This is the part of the report that will help to derive meaning from the data as contained in the
dataset and have the results presented for easy understanding. Both descriptive and inferential
statistics will be presented in this part to quantify the information and easily draw conclusions on
whether or not ISO 9000 had impact on the financial performance in the service firms.
Descriptive statistics
Table 1: Descriptive Statistics
N Minimum Maximum Mean Std. Deviation
l 5717 11 969 44.96 74.378
l_yjs 5717 0 161 1.38 5.688
l_benke 5717 0 530 11.85 28.453
l_dz 5717 0 490 12.92 24.306
l_gaozhong 5717 0 689 12.26 31.290
l_chuzhong 5717 0 568 6.54 25.980
revenue 5717 1000 869176 11698.57 32873.609
profit_operating 5717 17 296176 2067.97 7158.417
ksum 5717 1000 978548 16473.16 54666.560
equity 5717 -1367 877989 7693.77 31012.079
kpaid 5717 10 402110 4765.67 17120.175
kstate 5717 0 402110 1201.12 11264.936
koversea 5717 0 150000 348.87 4598.814
kother 5717 0 400000 3215.68 11765.554
ROS 5717 .01 .51 .1911 .12397
ROA 5717 .01 1.02 .2236 .20858
FDIpercent 5717 .00 1.00 .0245 .14937
agefirm 5717 2 61 7.62 7.074
Valid N (listwise) 5717
Among the censured companies, a companies that recorded the least number of employees had
11 employees while 969 is the highest number of employees recorded by other companies. The
mean number of employees across all the companies 45 with a standard deviation of 74. In
⊘ This is a preview!⊘
Do you want full access?
Subscribe today to unlock all pages.
Trusted by 1+ million students worldwide
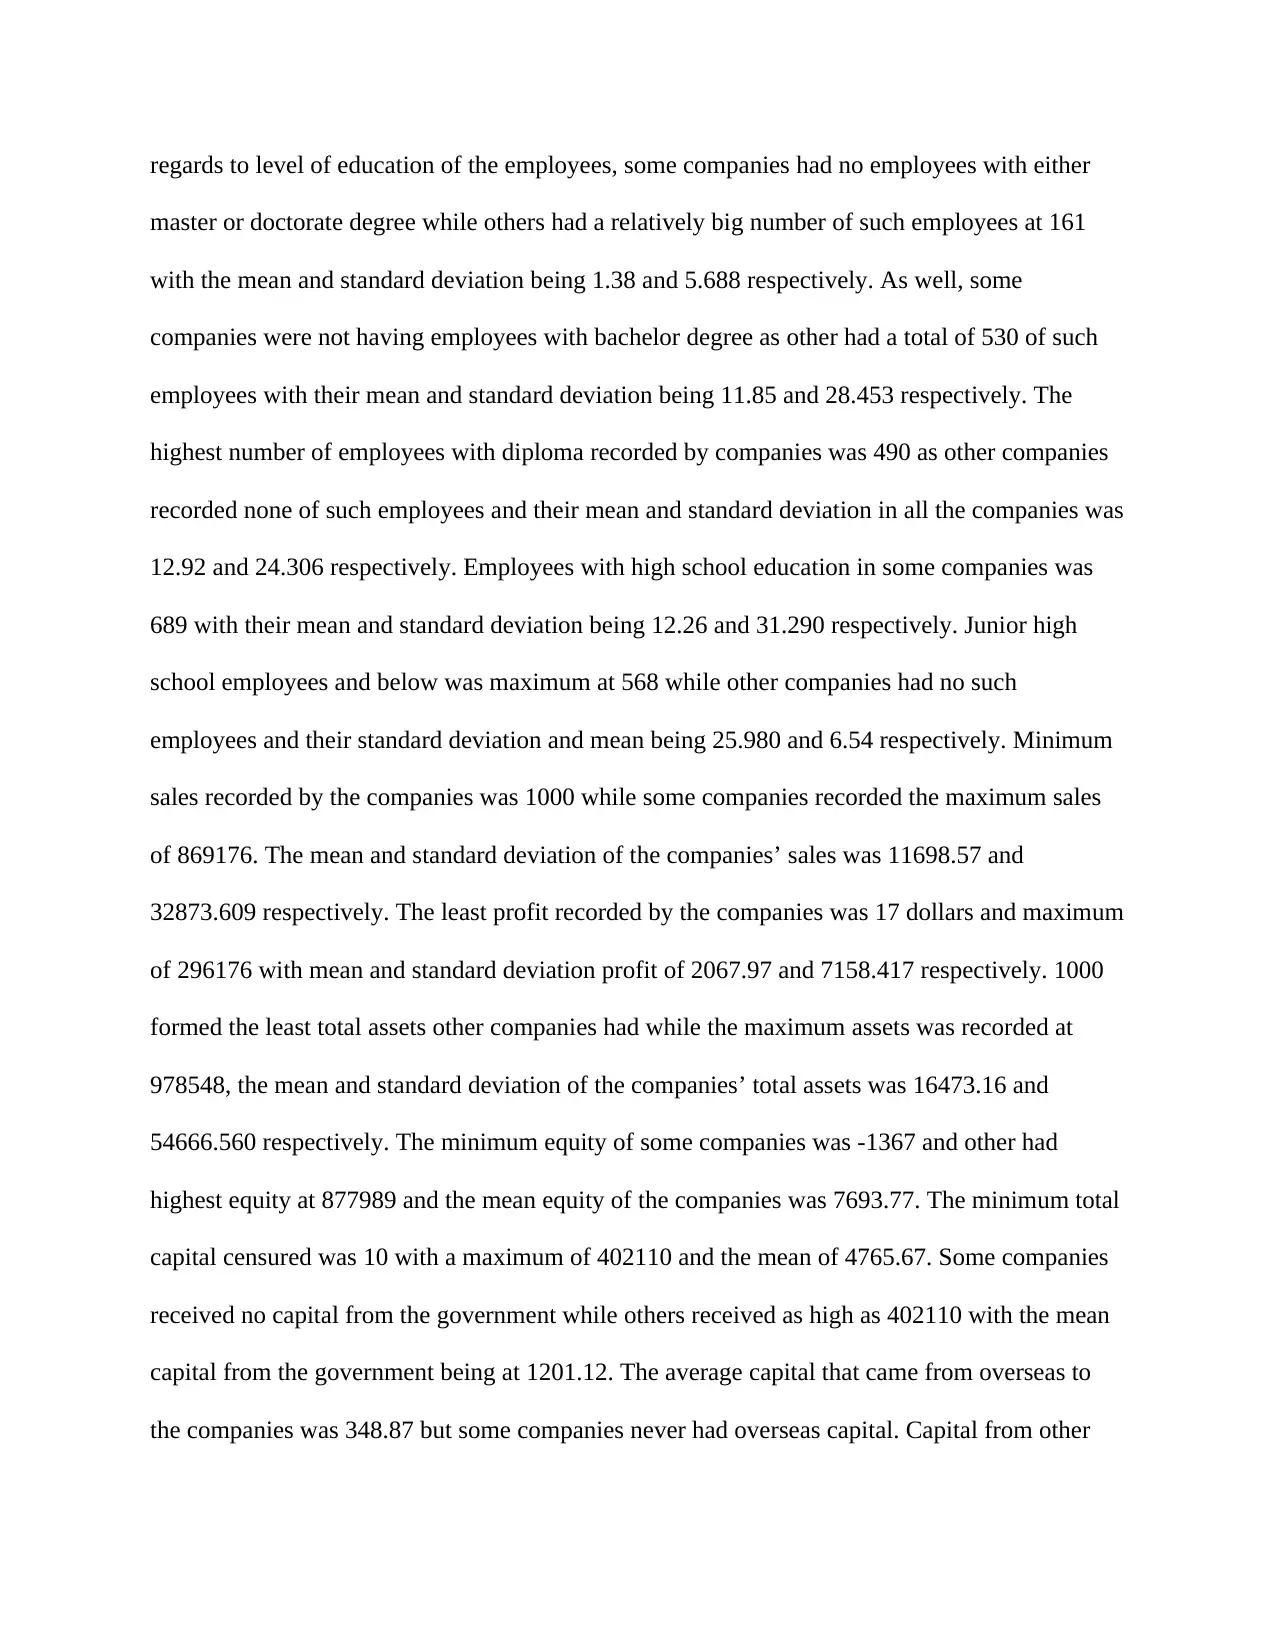
regards to level of education of the employees, some companies had no employees with either
master or doctorate degree while others had a relatively big number of such employees at 161
with the mean and standard deviation being 1.38 and 5.688 respectively. As well, some
companies were not having employees with bachelor degree as other had a total of 530 of such
employees with their mean and standard deviation being 11.85 and 28.453 respectively. The
highest number of employees with diploma recorded by companies was 490 as other companies
recorded none of such employees and their mean and standard deviation in all the companies was
12.92 and 24.306 respectively. Employees with high school education in some companies was
689 with their mean and standard deviation being 12.26 and 31.290 respectively. Junior high
school employees and below was maximum at 568 while other companies had no such
employees and their standard deviation and mean being 25.980 and 6.54 respectively. Minimum
sales recorded by the companies was 1000 while some companies recorded the maximum sales
of 869176. The mean and standard deviation of the companies’ sales was 11698.57 and
32873.609 respectively. The least profit recorded by the companies was 17 dollars and maximum
of 296176 with mean and standard deviation profit of 2067.97 and 7158.417 respectively. 1000
formed the least total assets other companies had while the maximum assets was recorded at
978548, the mean and standard deviation of the companies’ total assets was 16473.16 and
54666.560 respectively. The minimum equity of some companies was -1367 and other had
highest equity at 877989 and the mean equity of the companies was 7693.77. The minimum total
capital censured was 10 with a maximum of 402110 and the mean of 4765.67. Some companies
received no capital from the government while others received as high as 402110 with the mean
capital from the government being at 1201.12. The average capital that came from overseas to
the companies was 348.87 but some companies never had overseas capital. Capital from other
Paraphrase This Document
Need a fresh take? Get an instant paraphrase of this document with our AI Paraphraser
sources stood at 400000 in some companies and the average of 3215.68. Return on sales was as
low as 0.01 in some companies and highest in other companies at 0.51 with the censured average
being 0.1911. On the other hand, minimum recorded return on assets was 0.01 and the highest
recorded was 1.02 with their average being 0.2236.
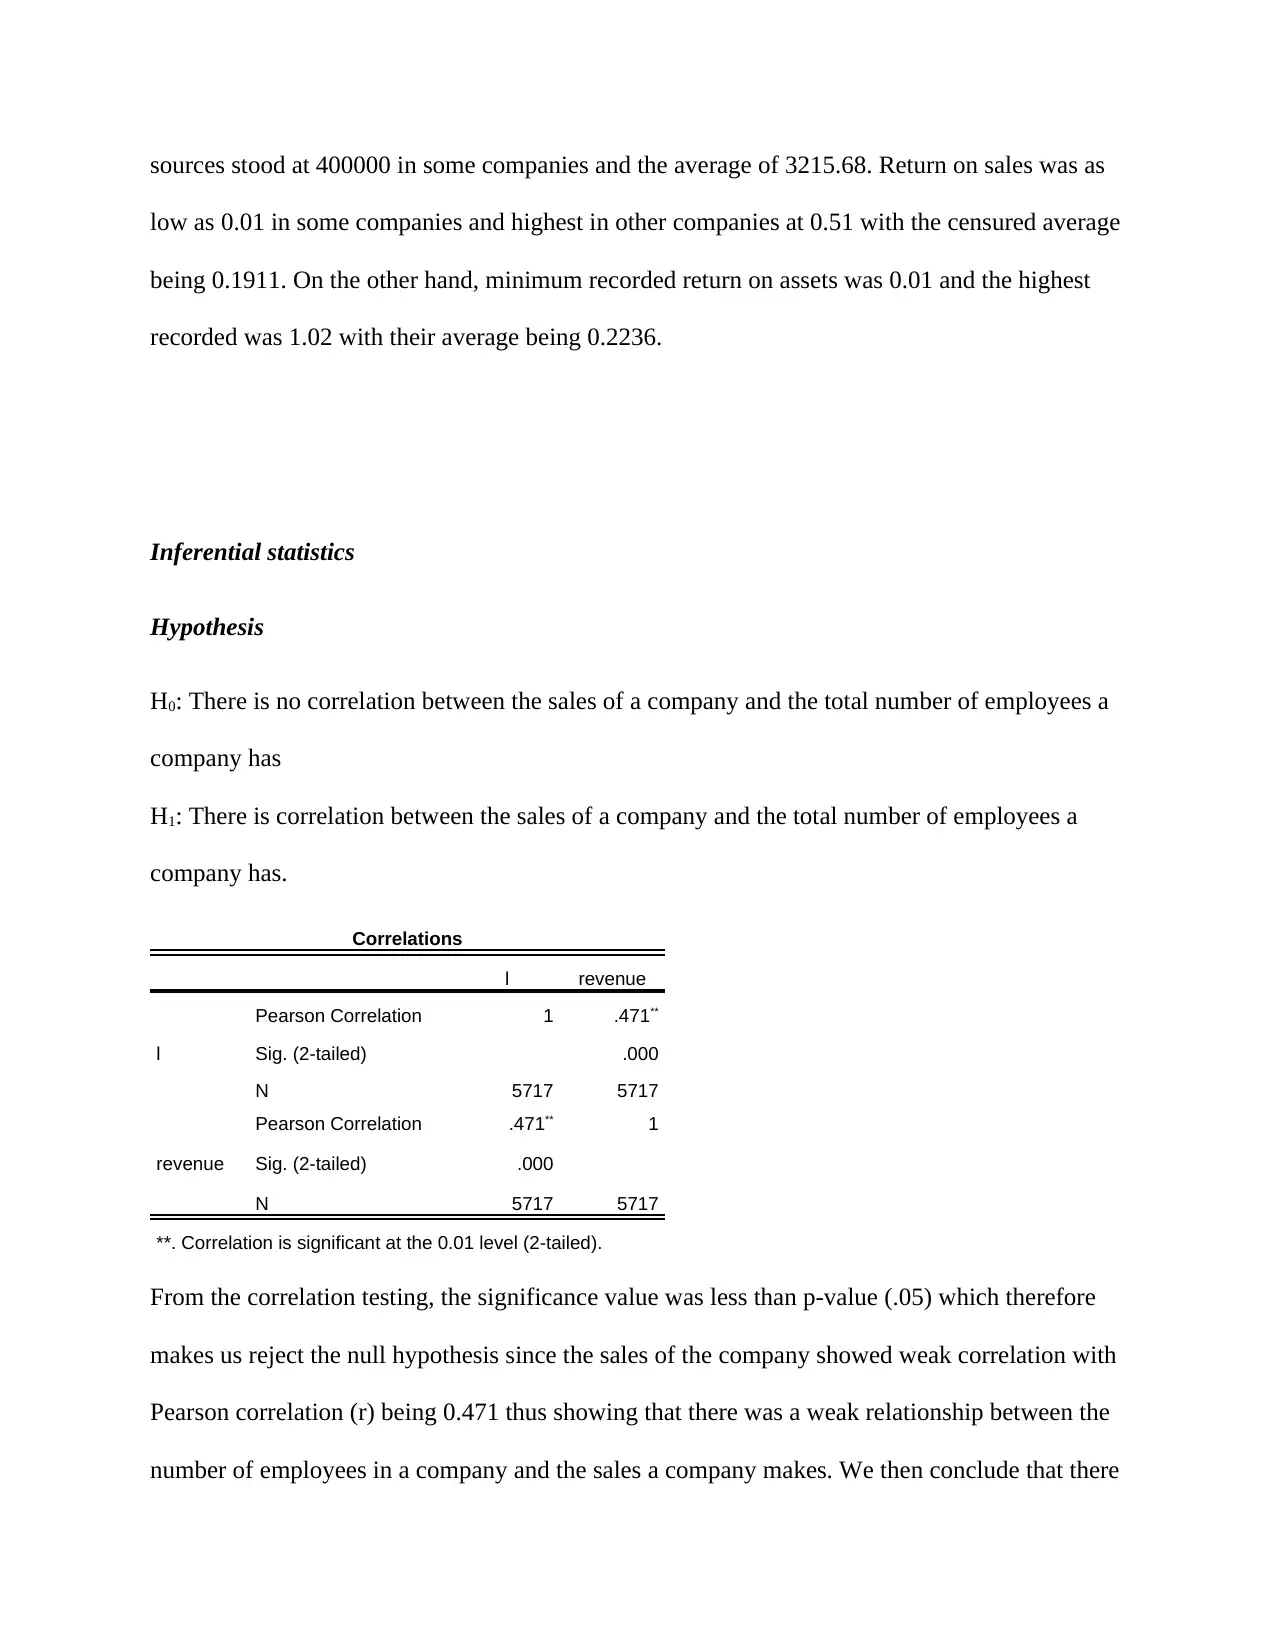
Inferential statistics
Hypothesis
H0: There is no correlation between the sales of a company and the total number of employees a
company has
H1: There is correlation between the sales of a company and the total number of employees a
company has.
From the correlation testing, the significance value was less than p-value (.05) which therefore
makes us reject the null hypothesis since the sales of the company showed weak correlation with
Pearson correlation (r) being 0.471 thus showing that there was a weak relationship between the
number of employees in a company and the sales a company makes. We then conclude that there
Correlations
l revenue
l
Pearson Correlation 1 .471**
Sig. (2-tailed) .000
N 5717 5717
revenue
Pearson Correlation .471** 1
Sig. (2-tailed) .000
N 5717 5717
**. Correlation is significant at the 0.01 level (2-tailed).
low as 0.01 in some companies and highest in other companies at 0.51 with the censured average
being 0.1911. On the other hand, minimum recorded return on assets was 0.01 and the highest
recorded was 1.02 with their average being 0.2236.
Inferential statistics
Hypothesis
H0: There is no correlation between the sales of a company and the total number of employees a
company has
H1: There is correlation between the sales of a company and the total number of employees a
company has.
From the correlation testing, the significance value was less than p-value (.05) which therefore
makes us reject the null hypothesis since the sales of the company showed weak correlation with
Pearson correlation (r) being 0.471 thus showing that there was a weak relationship between the
number of employees in a company and the sales a company makes. We then conclude that there
Correlations
l revenue
l
Pearson Correlation 1 .471**
Sig. (2-tailed) .000
N 5717 5717
revenue
Pearson Correlation .471** 1
Sig. (2-tailed) .000
N 5717 5717
**. Correlation is significant at the 0.01 level (2-tailed).
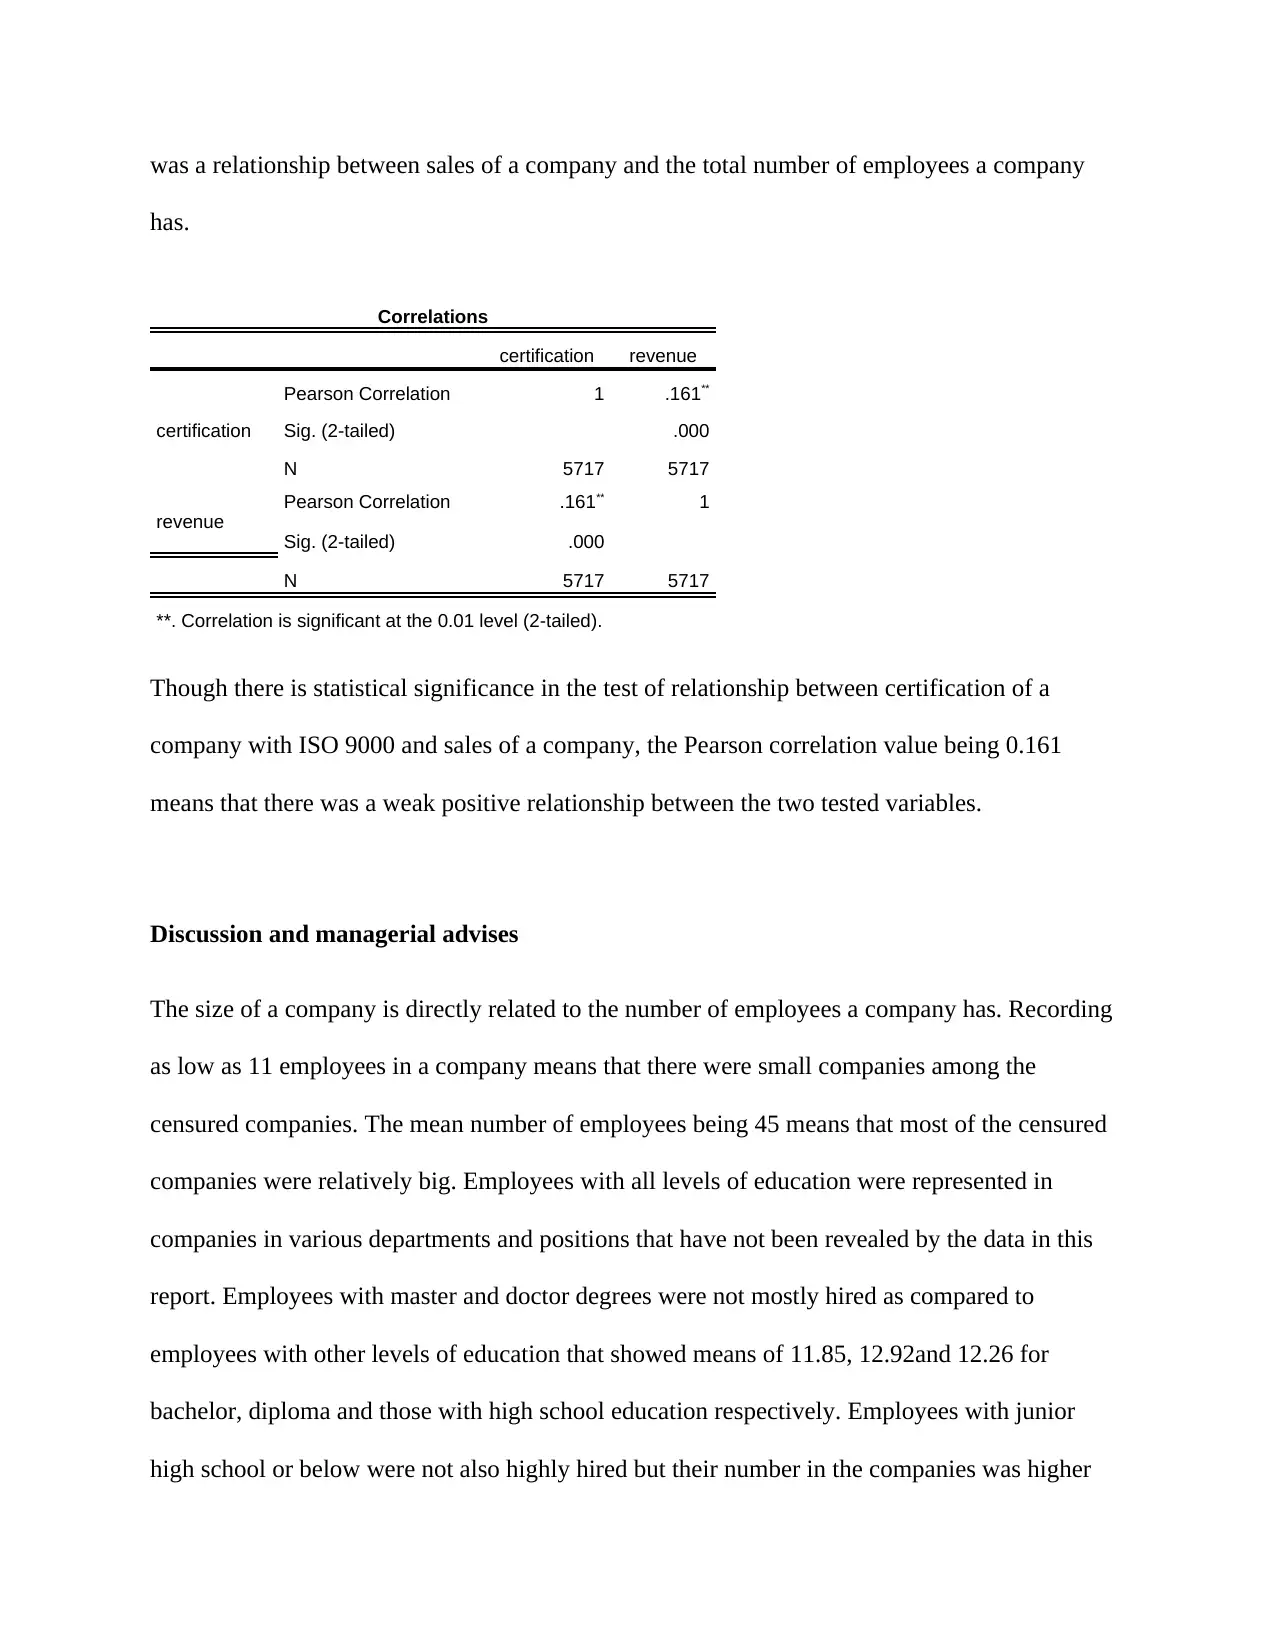
was a relationship between sales of a company and the total number of employees a company
has.
Correlations
certification revenue
certification
Pearson Correlation 1 .161**
Sig. (2-tailed) .000
N 5717 5717
revenue
Pearson Correlation .161** 1
Sig. (2-tailed) .000
N 5717 5717
**. Correlation is significant at the 0.01 level (2-tailed).
Though there is statistical significance in the test of relationship between certification of a
company with ISO 9000 and sales of a company, the Pearson correlation value being 0.161
means that there was a weak positive relationship between the two tested variables.
Discussion and managerial advises
The size of a company is directly related to the number of employees a company has. Recording
as low as 11 employees in a company means that there were small companies among the
censured companies. The mean number of employees being 45 means that most of the censured
companies were relatively big. Employees with all levels of education were represented in
companies in various departments and positions that have not been revealed by the data in this
report. Employees with master and doctor degrees were not mostly hired as compared to
employees with other levels of education that showed means of 11.85, 12.92and 12.26 for
bachelor, diploma and those with high school education respectively. Employees with junior
high school or below were not also highly hired but their number in the companies was higher
⊘ This is a preview!⊘
Do you want full access?
Subscribe today to unlock all pages.
Trusted by 1+ million students worldwide
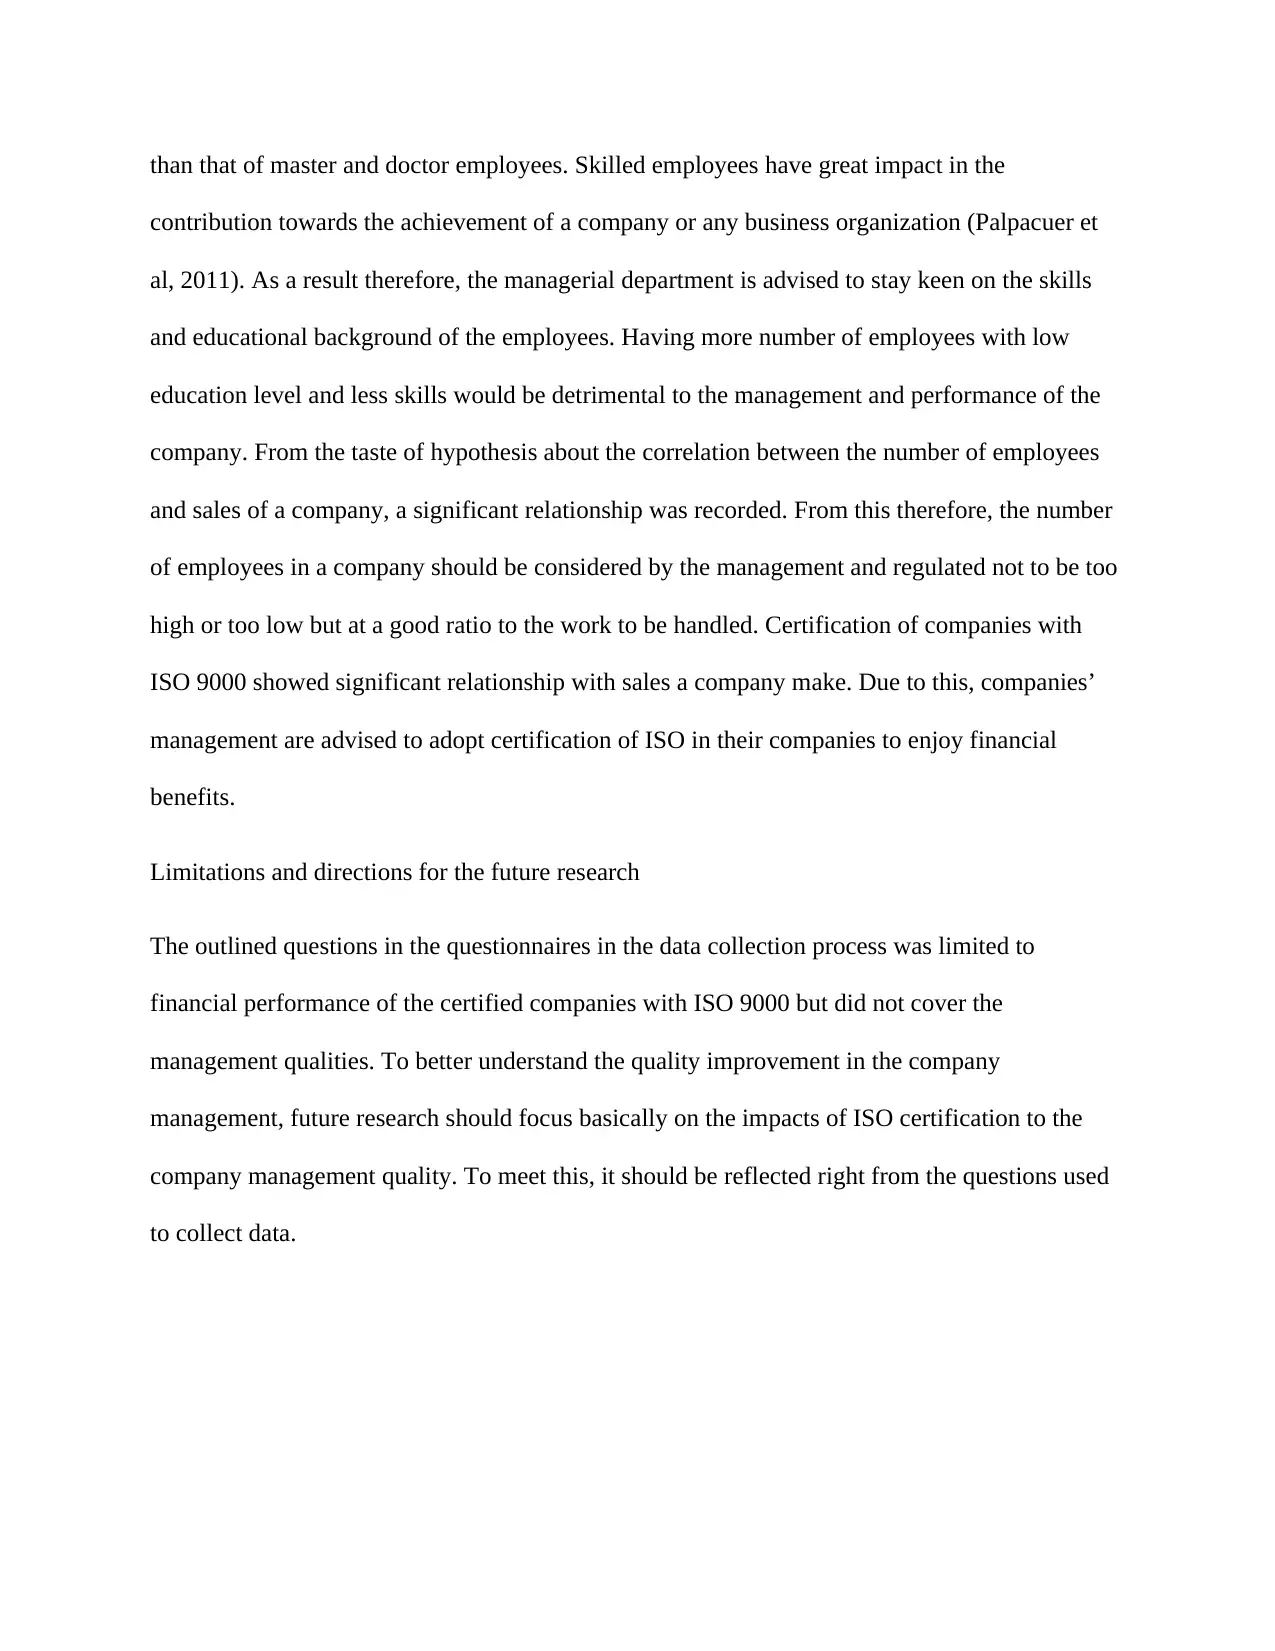
than that of master and doctor employees. Skilled employees have great impact in the
contribution towards the achievement of a company or any business organization (Palpacuer et
al, 2011). As a result therefore, the managerial department is advised to stay keen on the skills
and educational background of the employees. Having more number of employees with low
education level and less skills would be detrimental to the management and performance of the
company. From the taste of hypothesis about the correlation between the number of employees
and sales of a company, a significant relationship was recorded. From this therefore, the number
of employees in a company should be considered by the management and regulated not to be too
high or too low but at a good ratio to the work to be handled. Certification of companies with
ISO 9000 showed significant relationship with sales a company make. Due to this, companies’
management are advised to adopt certification of ISO in their companies to enjoy financial
benefits.
Limitations and directions for the future research
The outlined questions in the questionnaires in the data collection process was limited to
financial performance of the certified companies with ISO 9000 but did not cover the
management qualities. To better understand the quality improvement in the company
management, future research should focus basically on the impacts of ISO certification to the
company management quality. To meet this, it should be reflected right from the questions used
to collect data.
Paraphrase This Document
Need a fresh take? Get an instant paraphrase of this document with our AI Paraphraser
References
Bernardo, M., Simon, A., Tarí, J. J., & Molina-Azorín, J. F. (2015). Benefits of management
systems integration: a literature review. Journal of Cleaner Production, 94, 260-267.
Chatzoglou, P, Chatzoudes, D and Kipraios, N, “The Impact of ISO 9000 certification on firms’
financial performance”, International Journal of Operations and Production Management,
35(1), 145-174, (2015)
Chow-Chua, C., Goh, M., & Boon Wan, T. (2003). Does ISO 9000 certification improve
business performance?. International Journal of Quality & Reliability
Management, 20(8), 936-953.
Ismyrlis,V and Moschidis, O, “The effects of ISO 9001 certification on the performance of
Greek companies”, TQM journal, 27(1), 150-162, (2015)
Franceschini, F., Galetto, M., Maisano, D., & Mastrogiacomo, L. (2010). Clustering of European
countries based on ISO 9000 certification diffusion.International Journal of Quality &
Reliability Management, 27(5), 558-575.
Hajian, S., & Domingo-Ferrer, J. (2013). A methodology for direct and indirect discrimination
prevention in data mining. IEEE transactions on knowledge and data engineering, 25(7),
1445-1459.
Palpacuer, F., Seignour, A., & Vercher, C. (2011). Financialization, Globalization and the
Management of Skilled Employees: Towards a Market‐Based HRM Model in Large
Corporations in France. British Journal of Industrial Relations, 49(3), 560-582.
Psomas, E. L., Kafetzopoulos, D. P., & Fotopoulos, C. V. (2012). Developing and validating a
measurement instrument of ISO 9001 effectiveness in food manufacturing
SMEs. Journal of Manufacturing Technology Management,24(1), 52-77.
Psosmas, E, pantouvakis, A and Kafetzopoulos, D, “The Impact of ISO 9001 effectiveness on
the performance of service companies”, Managing service Quality, 23(2), 149-164,
(2013)
Lafuente, E., Bayo‐Moriones, A., & García‐Cestona, M. (2010). ISO‐9000 Certification and
Ownership Structure: Effects upon Firm Performance. British Journal of
Management, 21(3), 649-665.
Papadimitriou, A., & Westerheijden, D. F. (2010). Adoption of ISO-oriented quality
management system in Greek universities: reactions to isomorphic pressures. The TQM
Journal, 22(3), 229-241.
Zaramdini, W. (2007). An empirical study of the motives and benefits of ISO 9000 certification:
the UAE experience. International Journal of Quality & Reliability Management, 24(5),
472-491.
⊘ This is a preview!⊘
Do you want full access?
Subscribe today to unlock all pages.
Trusted by 1+ million students worldwide
1 out of 13
Related Documents


Your All-in-One AI-Powered Toolkit for Academic Success.
+13062052269
info@desklib.com
Available 24*7 on WhatsApp / Email
![[object Object]](/_next/static/media/star-bottom.7253800d.svg)
Unlock your academic potential
Copyright © 2020–2026 A2Z Services. All Rights Reserved. Developed and managed by ZUCOL.