Research Report: ISO 9000 Adoption Determinants and Firm Performance
VerifiedAdded on 2021/06/18
|21
|5108
|24
Report
AI Summary
This report analyzes the determinants of ISO 9000 adoption and its subsequent impact on firm performance, utilizing data from 5717 industries, of which 460 are ISO 9000 certified. The study compares certified and non-certified firms across various factors including industry type, company age, employee education levels, and financial metrics such as sales, profit, assets, and return on investment. The research employs frequency distribution, descriptive statistics, t-tests, and ANOVA to identify significant differences and correlations. Key findings reveal that software, specialized technology services, and R&D firms exhibit higher certification rates. The report concludes that the number of employees, particularly those with higher education, and company age are crucial determinants of ISO 9000 adoption. Furthermore, significant differences were observed in sales, profit, assets, equity, and returns between certified and non-certified firms, suggesting a positive impact of ISO 9000 certification on financial performance.
Determinants of the adoption of ISO9000 and its impact on firm
performance
Executive Summary
In this study, we have data of 5717 industries out of which 460 are certified (5257 not
certified). We analyzed the certified and non-certified firms. Data is collected for both
certified and non-certified firms with respective to industry type, foundation year of industry,
number of employees with education level (master/Doctor, bachelor, diploma holder, High
school, Junior high school and below), sales of company, profit of company, Total asset of
the company, Equity of the company, Total capital, Capital from government, Capital from
overseas, Capital from other sources, Return on sales, Return on assets, Percentage of
overseas investment in the total investment, Overseas investment and Age of the company.
In this study we determine the determinants of ISO 9000. We analyzed the certified
and non-certified industries with respective to industry type. We considered the number of
employees with education level and age of the company are the important variable for
predicting the status of certification. We studied the impact of certification on the
performance of the industry. We considered sales of company, profit of company, Total asset
of the company, Equity of the company, Total capital, Capital from government, Capital from
overseas, Capital from other sources, Return on sales, Return on assets, Percentage of
overseas investment in the total investment, Overseas investment variables as a performance
variables.
We test whether the proportion of certified firm is same for all the industry type or not. We
study whether the number of employees with education level and age of the company are the
significantly different for certified firms or not. We test whether the performance variables
are significantly different for certified and non-certified firms.
Page 1 of 21
Paraphrase This Document
Need a fresh take? Get an instant paraphrase of this document with our AI Paraphraser
We used the frequency distribution, descriptive statistics for the study variables. We observed
the proportion of certified firm is same for all the industry type or not. We used t-test for
determining the determinants of adoption of ISO 9000. We used t-test for testing the
significance of performance variables for certified and non-certified firms. We used one way
ANOVA for the significance of performance variables for certified firms by considering the
type of industry as a level.
We observed that 19% software, 18% Specialized technology services, 15% Research
and Development firms are certified. Certification adoption was very little in the
Telecommunication (2%), Business services (3%), storage and transportation (4%),
Technology exchange and promotion (5%) and computer services (8%).
We conclude that mean of number of employee, number of masters and doctors,
bachelors, diploma holders and number of employees attended high school for certified firm
is more than non-certified firms. Mean age of certified firm is also more than mean age of
non-certified firms. We can say that as the number of employees, masters and doctors,
bachelors, diploma holder, attended high school and age of company in years are the
important variables for the certified firms and are to be considered as the main determinant.
We observe that mean of Sales of the company, Profit of the company, Total asset of the
company, Equity of the company, Total capital, Capital from other sources, Return on sales
and Return on assets for certified and non-certified firm are significantly different whereas
mean of Capital from government, Capital from overseas and Percentage of overseas
investment in the total investment are not significantly different for certified and non-certified
firm.
Page 2 of 21
Introduction
Complete customer satisfaction is the motto of the most of the industries
(manufacturing as well as service industries). There are many industries who claims that they
fulfill all the customer’s needs. Each consumer have different approach to select his or her
service provider. Certification is one of the most common approach of the customer for
selecting the service provider. Certification is nothing but the provision by an external body
of written assurance (in terms of certificate) that the product, service or system in question
meets specific requirements.
ISO is an independent, non-governmental international organization with a
membership of 161 national standards bodies. Through its members, it brings together
experts to share knowledge and develop voluntary, consensus-based, market relevant
International Standards that support innovation and provide solutions to global challenges.
The ISO 9000 series of quality management systems standard has been widely applied all
over the world since its introduction in 1987. By the end of 2013, ISO 9000 had been adopted
by over 1,129,000 facilities in 189 countries. Both academics and practitioners are interest in
understanding the determinants of adoption of ISO 9000, and the impact of the adoption of
ISO 9000 on firm financial performance (Christmann & Taylor, 2006; Du, Yin, & Zhang,
2016; Fikru, 2014a, 2014b, 2016; Nakamura, Takahashi, & Vertinsky, 2001; Pekovic, 2010;
Wu, Chu, & Liu, 2007).
In this study, we have data of 5717 industries out of which 460 are certified (5257 not
certified). We analyzed the certified and non-certified firms. Data is collected for both
certified and non-certified firms with respective to industry type, foundation year of industry,
number of employees with education level (master/Doctor, bachelor, diploma holder, High
school, Junior high school and below), sales of company, profit of company, Total asset of
the company, Equity of the company, Total capital, Capital from government, Capital from
Page 3 of 21
⊘ This is a preview!⊘
Do you want full access?
Subscribe today to unlock all pages.
Trusted by 1+ million students worldwide
overseas, Capital from other sources, Return on sales, Return on assets, Percentage of
overseas investment in the total investment, Overseas investment and Age of the company.
In this study we determine the determinants of ISO 9000. We analyzed the certified
and non-certified industries with respective to industry type. We considered the number of
employees with education level and age of the company are the important variable for
predicting the status of certification. We studied the impact of certification on the
performance of the industry. We considered sales of company, profit of company, Total asset
of the company, Equity of the company, Total capital, Capital from government, Capital from
overseas, Capital from other sources, Return on sales, Return on assets, Percentage of
overseas investment in the total investment, Overseas investment variables as a performance
variables.
We test whether the proportion of certified firm is same for all the industry type or
not. We study whether the number of employees with education level and age of the company
are the significantly different for certified firms or not. We test whether the performance
variables are significantly different for certified and non-certified firms.
Literature Review
In today’s world certification is an important concern for all the industries. Numerous
empirical studies have examined the determinants of firm participation in ISO Certification in
developed as well as developing countries. (Christmann & Taylor, 2006; Du, Yin, & Zhang,
2016; Fikru, 2014a, 2014b, 2016; Nakamura, Takahashi, & Vertinsky, 2001; Pekovic, 2010;
Wu, Chu, & Liu, 2007). For example, Fikru(2016) finds that foreign ownership, plant size
and business communications through company website are important for the adoption of
standards in Africa. DeCanio and Watkins (1998) conclude that firm size, earnings and
insider shareholders are significant determinants of voluntary participation of US firms in the
Green Lights programme. Fikru (2014a) finds that international connectivity, sources of
Page 4 of 21
Paraphrase This Document
Need a fresh take? Get an instant paraphrase of this document with our AI Paraphraser
finance such as credit from local banks or local customers, and manager’s human capital as
significant determinants of international standards.
Research Methodology
The use of different statistical tools and techniques is becomes mandatory for
analysis. The selection of proper tools and techniques is very important for the analysis of
data. We used the frequency distribution, descriptive statistics for the study variables. We
observed the proportion of certified firm is same for all the industry type or not. We used t-
test for determining the determinants of adoption of ISO 9000. We used t-test for testing the
significance of performance variables for certified and non-certified firms. We used one way
ANOVA for the significance of performance variables for certified firms by considering the
type of industry as a level. We have mostly used SPSS software for analysis.
Data Analysis and Results
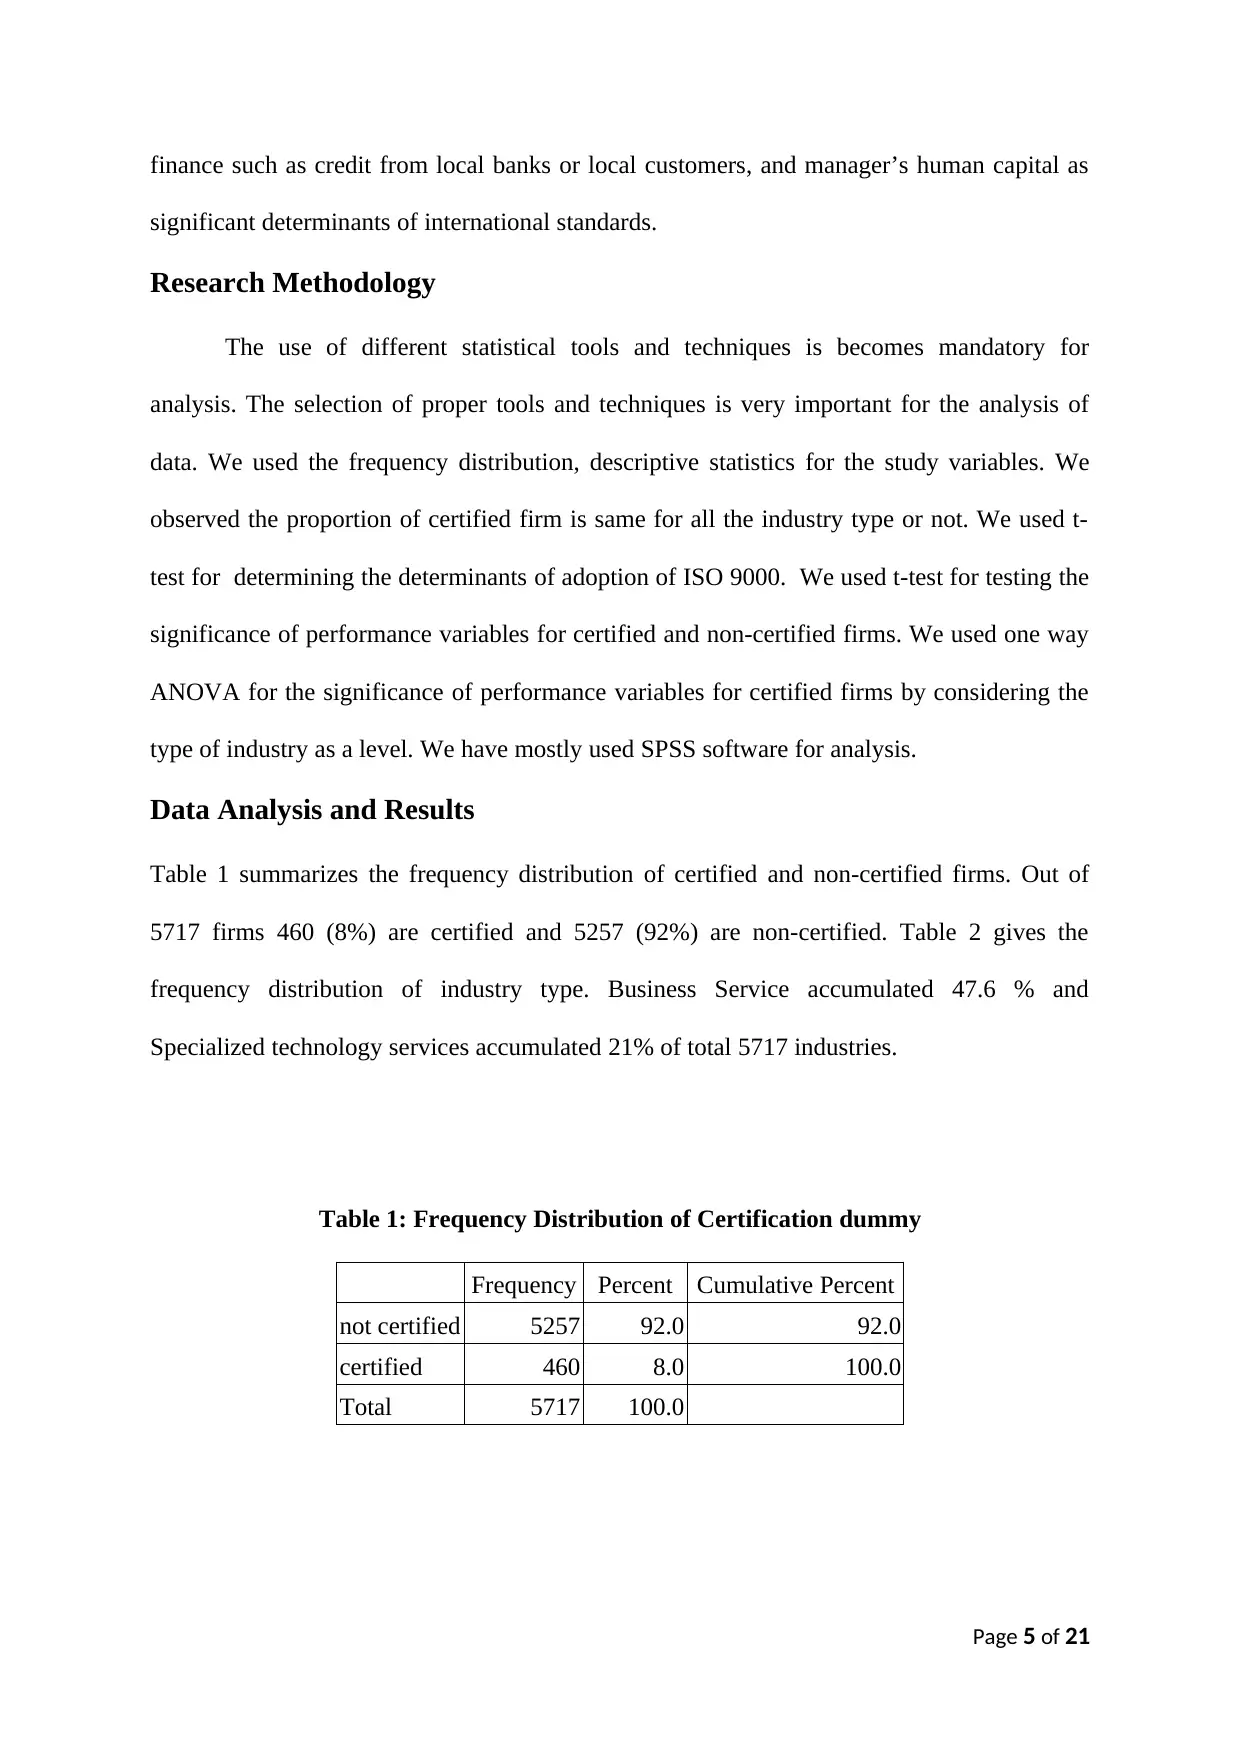
Table 1 summarizes the frequency distribution of certified and non-certified firms. Out of
5717 firms 460 (8%) are certified and 5257 (92%) are non-certified. Table 2 gives the
frequency distribution of industry type. Business Service accumulated 47.6 % and
Specialized technology services accumulated 21% of total 5717 industries.
Table 1: Frequency Distribution of Certification dummy
Frequency Percent Cumulative Percent
not certified 5257 92.0 92.0
certified 460 8.0 100.0
Total 5717 100.0
Page 5 of 21
significant determinants of international standards.
Research Methodology
The use of different statistical tools and techniques is becomes mandatory for
analysis. The selection of proper tools and techniques is very important for the analysis of
data. We used the frequency distribution, descriptive statistics for the study variables. We
observed the proportion of certified firm is same for all the industry type or not. We used t-
test for determining the determinants of adoption of ISO 9000. We used t-test for testing the
significance of performance variables for certified and non-certified firms. We used one way
ANOVA for the significance of performance variables for certified firms by considering the
type of industry as a level. We have mostly used SPSS software for analysis.
Data Analysis and Results
Table 1 summarizes the frequency distribution of certified and non-certified firms. Out of
5717 firms 460 (8%) are certified and 5257 (92%) are non-certified. Table 2 gives the
frequency distribution of industry type. Business Service accumulated 47.6 % and
Specialized technology services accumulated 21% of total 5717 industries.
Table 1: Frequency Distribution of Certification dummy
Frequency Percent Cumulative Percent
not certified 5257 92.0 92.0
certified 460 8.0 100.0
Total 5717 100.0
Page 5 of 21
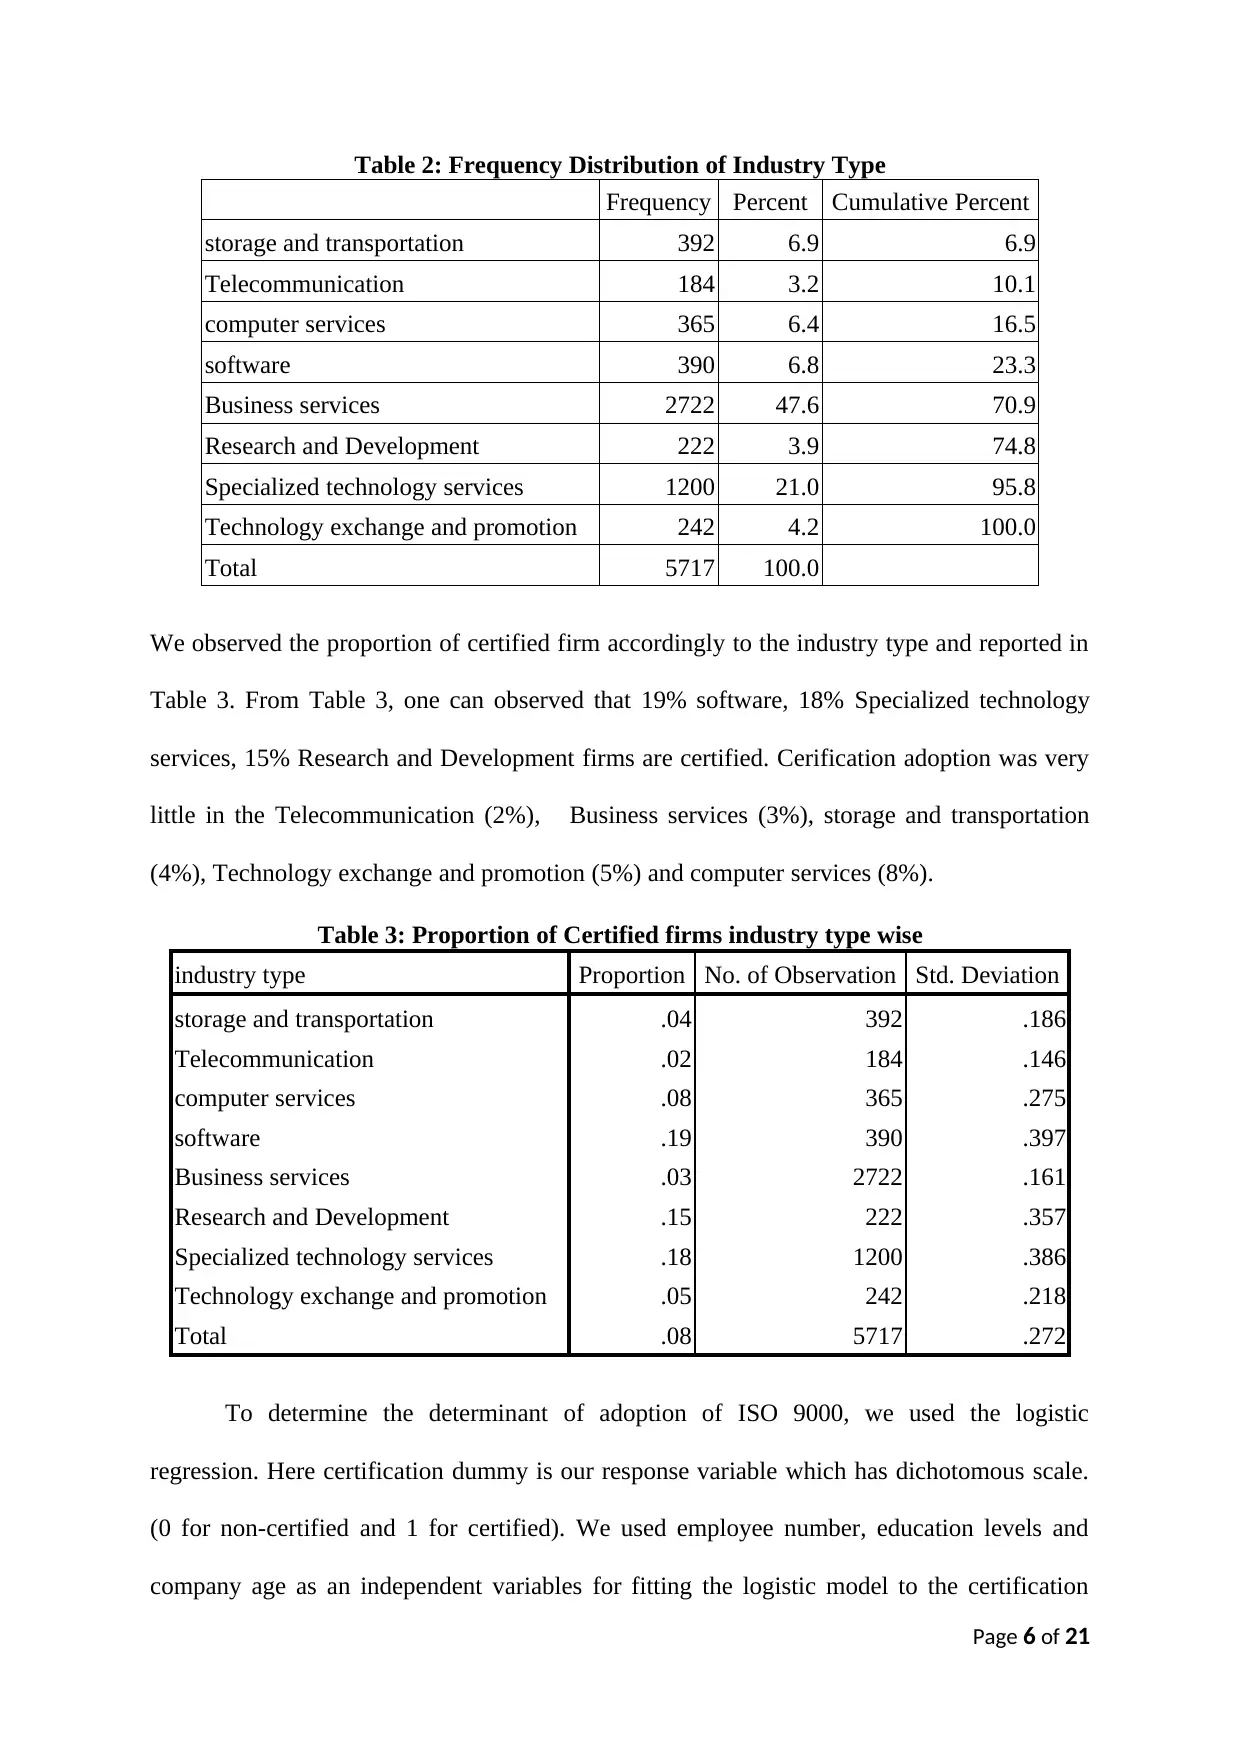
Table 2: Frequency Distribution of Industry Type
Frequency Percent Cumulative Percent
storage and transportation 392 6.9 6.9
Telecommunication 184 3.2 10.1
computer services 365 6.4 16.5
software 390 6.8 23.3
Business services 2722 47.6 70.9
Research and Development 222 3.9 74.8
Specialized technology services 1200 21.0 95.8
Technology exchange and promotion 242 4.2 100.0
Total 5717 100.0
We observed the proportion of certified firm accordingly to the industry type and reported in
Table 3. From Table 3, one can observed that 19% software, 18% Specialized technology
services, 15% Research and Development firms are certified. Cerification adoption was very
little in the Telecommunication (2%), Business services (3%), storage and transportation
(4%), Technology exchange and promotion (5%) and computer services (8%).
Table 3: Proportion of Certified firms industry type wise
industry type Proportion No. of Observation Std. Deviation
storage and transportation .04 392 .186
Telecommunication .02 184 .146
computer services .08 365 .275
software .19 390 .397
Business services .03 2722 .161
Research and Development .15 222 .357
Specialized technology services .18 1200 .386
Technology exchange and promotion .05 242 .218
Total .08 5717 .272
To determine the determinant of adoption of ISO 9000, we used the logistic
regression. Here certification dummy is our response variable which has dichotomous scale.
(0 for non-certified and 1 for certified). We used employee number, education levels and
company age as an independent variables for fitting the logistic model to the certification
Page 6 of 21
⊘ This is a preview!⊘
Do you want full access?
Subscribe today to unlock all pages.
Trusted by 1+ million students worldwide
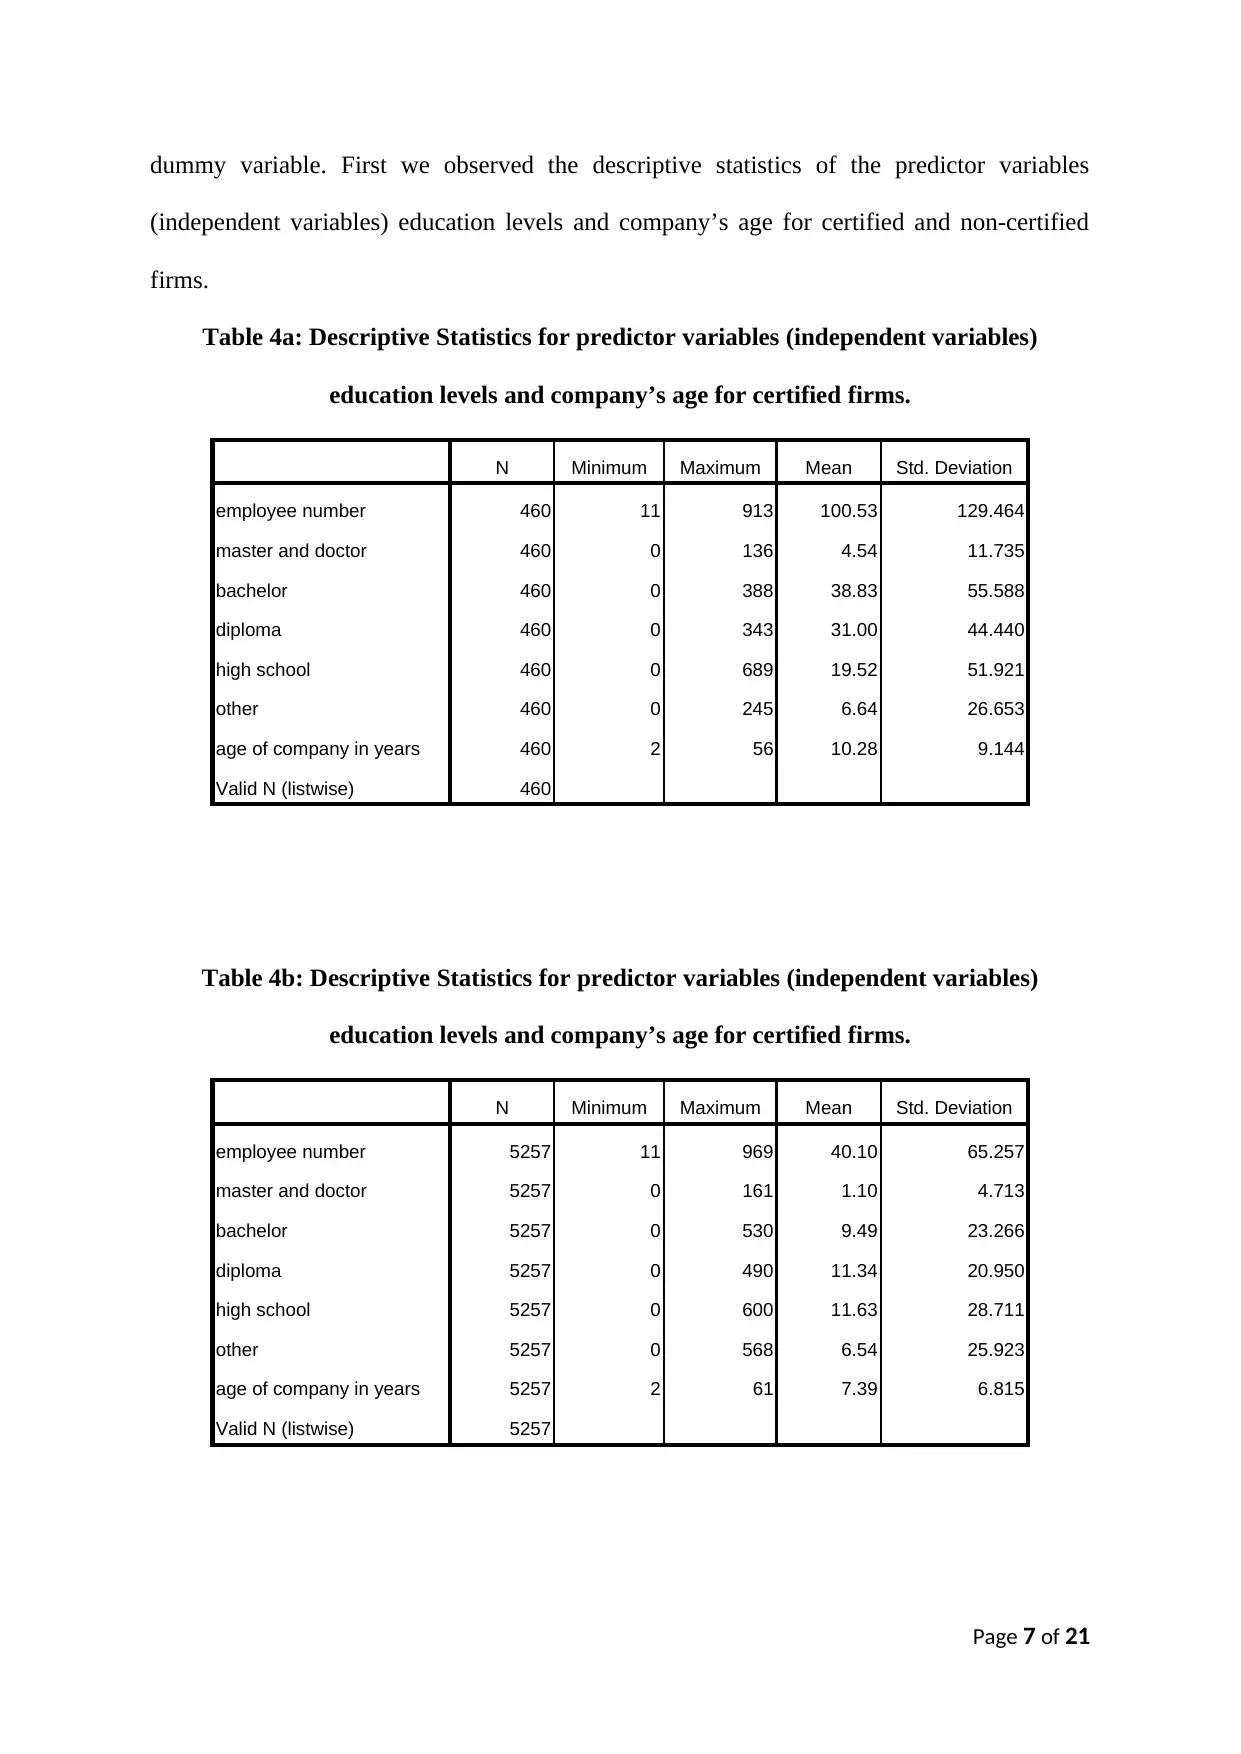
dummy variable. First we observed the descriptive statistics of the predictor variables
(independent variables) education levels and company’s age for certified and non-certified
firms.
Table 4a: Descriptive Statistics for predictor variables (independent variables)
education levels and company’s age for certified firms.
N Minimum Maximum Mean Std. Deviation
employee number 460 11 913 100.53 129.464
master and doctor 460 0 136 4.54 11.735
bachelor 460 0 388 38.83 55.588
diploma 460 0 343 31.00 44.440
high school 460 0 689 19.52 51.921
other 460 0 245 6.64 26.653
age of company in years 460 2 56 10.28 9.144
Valid N (listwise) 460
Table 4b: Descriptive Statistics for predictor variables (independent variables)
education levels and company’s age for certified firms.
N Minimum Maximum Mean Std. Deviation
employee number 5257 11 969 40.10 65.257
master and doctor 5257 0 161 1.10 4.713
bachelor 5257 0 530 9.49 23.266
diploma 5257 0 490 11.34 20.950
high school 5257 0 600 11.63 28.711
other 5257 0 568 6.54 25.923
age of company in years 5257 2 61 7.39 6.815
Valid N (listwise) 5257
Page 7 of 21
Paraphrase This Document
Need a fresh take? Get an instant paraphrase of this document with our AI Paraphraser
By comparing Table 4a and 4b, we can see that mean of number of employee, number of
masters and doctors, bachelors, diploma holders and number of employees attended high
school for certified firm is more than non-certified firms. Mean age of certified firm is also
more than mean age of non-certified firms.
Table 5 represents the Pearson’s correlation coefficient and it’s significance. All the predictor
variable are positively correlated with response variable and significant expect the number of
employees having education below high school and other. From Table 5, one can observe the
correlation between the predictor variables.
Page 8 of 21
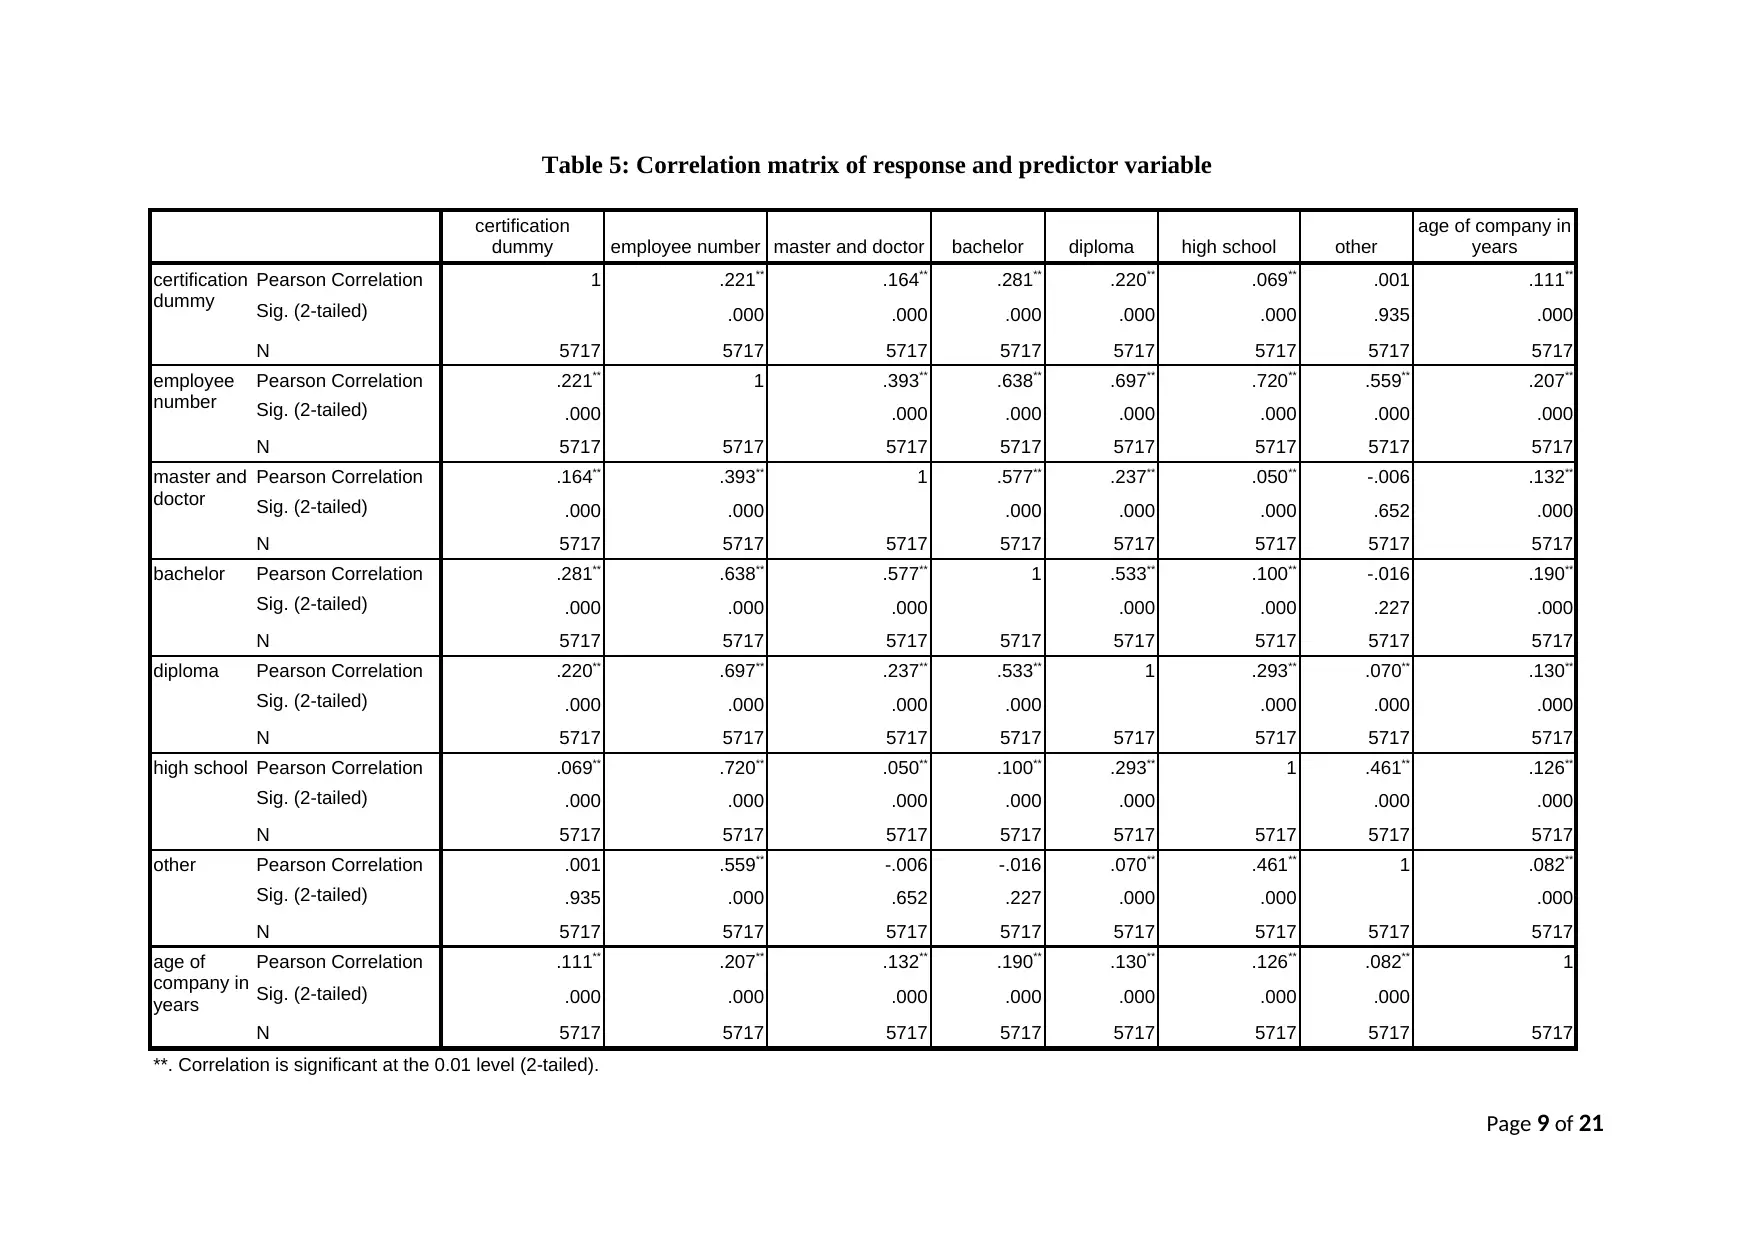
Table 5: Correlation matrix of response and predictor variable
certification
dummy employee number master and doctor bachelor diploma high school other
age of company in
years
certification
dummy
Pearson Correlation 1 .221** .164** .281** .220** .069** .001 .111**
Sig. (2-tailed) .000 .000 .000 .000 .000 .935 .000
N 5717 5717 5717 5717 5717 5717 5717 5717
employee
number
Pearson Correlation .221** 1 .393** .638** .697** .720** .559** .207**
Sig. (2-tailed) .000 .000 .000 .000 .000 .000 .000
N 5717 5717 5717 5717 5717 5717 5717 5717
master and
doctor
Pearson Correlation .164** .393** 1 .577** .237** .050** -.006 .132**
Sig. (2-tailed) .000 .000 .000 .000 .000 .652 .000
N 5717 5717 5717 5717 5717 5717 5717 5717
bachelor Pearson Correlation .281** .638** .577** 1 .533** .100** -.016 .190**
Sig. (2-tailed) .000 .000 .000 .000 .000 .227 .000
N 5717 5717 5717 5717 5717 5717 5717 5717
diploma Pearson Correlation .220** .697** .237** .533** 1 .293** .070** .130**
Sig. (2-tailed) .000 .000 .000 .000 .000 .000 .000
N 5717 5717 5717 5717 5717 5717 5717 5717
high school Pearson Correlation .069** .720** .050** .100** .293** 1 .461** .126**
Sig. (2-tailed) .000 .000 .000 .000 .000 .000 .000
N 5717 5717 5717 5717 5717 5717 5717 5717
other Pearson Correlation .001 .559** -.006 -.016 .070** .461** 1 .082**
Sig. (2-tailed) .935 .000 .652 .227 .000 .000 .000
N 5717 5717 5717 5717 5717 5717 5717 5717
age of
company in
years
Pearson Correlation .111** .207** .132** .190** .130** .126** .082** 1
Sig. (2-tailed) .000 .000 .000 .000 .000 .000 .000
N 5717 5717 5717 5717 5717 5717 5717 5717
**. Correlation is significant at the 0.01 level (2-tailed).
Page 9 of 21
certification
dummy employee number master and doctor bachelor diploma high school other
age of company in
years
certification
dummy
Pearson Correlation 1 .221** .164** .281** .220** .069** .001 .111**
Sig. (2-tailed) .000 .000 .000 .000 .000 .935 .000
N 5717 5717 5717 5717 5717 5717 5717 5717
employee
number
Pearson Correlation .221** 1 .393** .638** .697** .720** .559** .207**
Sig. (2-tailed) .000 .000 .000 .000 .000 .000 .000
N 5717 5717 5717 5717 5717 5717 5717 5717
master and
doctor
Pearson Correlation .164** .393** 1 .577** .237** .050** -.006 .132**
Sig. (2-tailed) .000 .000 .000 .000 .000 .652 .000
N 5717 5717 5717 5717 5717 5717 5717 5717
bachelor Pearson Correlation .281** .638** .577** 1 .533** .100** -.016 .190**
Sig. (2-tailed) .000 .000 .000 .000 .000 .227 .000
N 5717 5717 5717 5717 5717 5717 5717 5717
diploma Pearson Correlation .220** .697** .237** .533** 1 .293** .070** .130**
Sig. (2-tailed) .000 .000 .000 .000 .000 .000 .000
N 5717 5717 5717 5717 5717 5717 5717 5717
high school Pearson Correlation .069** .720** .050** .100** .293** 1 .461** .126**
Sig. (2-tailed) .000 .000 .000 .000 .000 .000 .000
N 5717 5717 5717 5717 5717 5717 5717 5717
other Pearson Correlation .001 .559** -.006 -.016 .070** .461** 1 .082**
Sig. (2-tailed) .935 .000 .652 .227 .000 .000 .000
N 5717 5717 5717 5717 5717 5717 5717 5717
age of
company in
years
Pearson Correlation .111** .207** .132** .190** .130** .126** .082** 1
Sig. (2-tailed) .000 .000 .000 .000 .000 .000 .000
N 5717 5717 5717 5717 5717 5717 5717 5717
**. Correlation is significant at the 0.01 level (2-tailed).
Page 9 of 21
⊘ This is a preview!⊘
Do you want full access?
Subscribe today to unlock all pages.
Trusted by 1+ million students worldwide
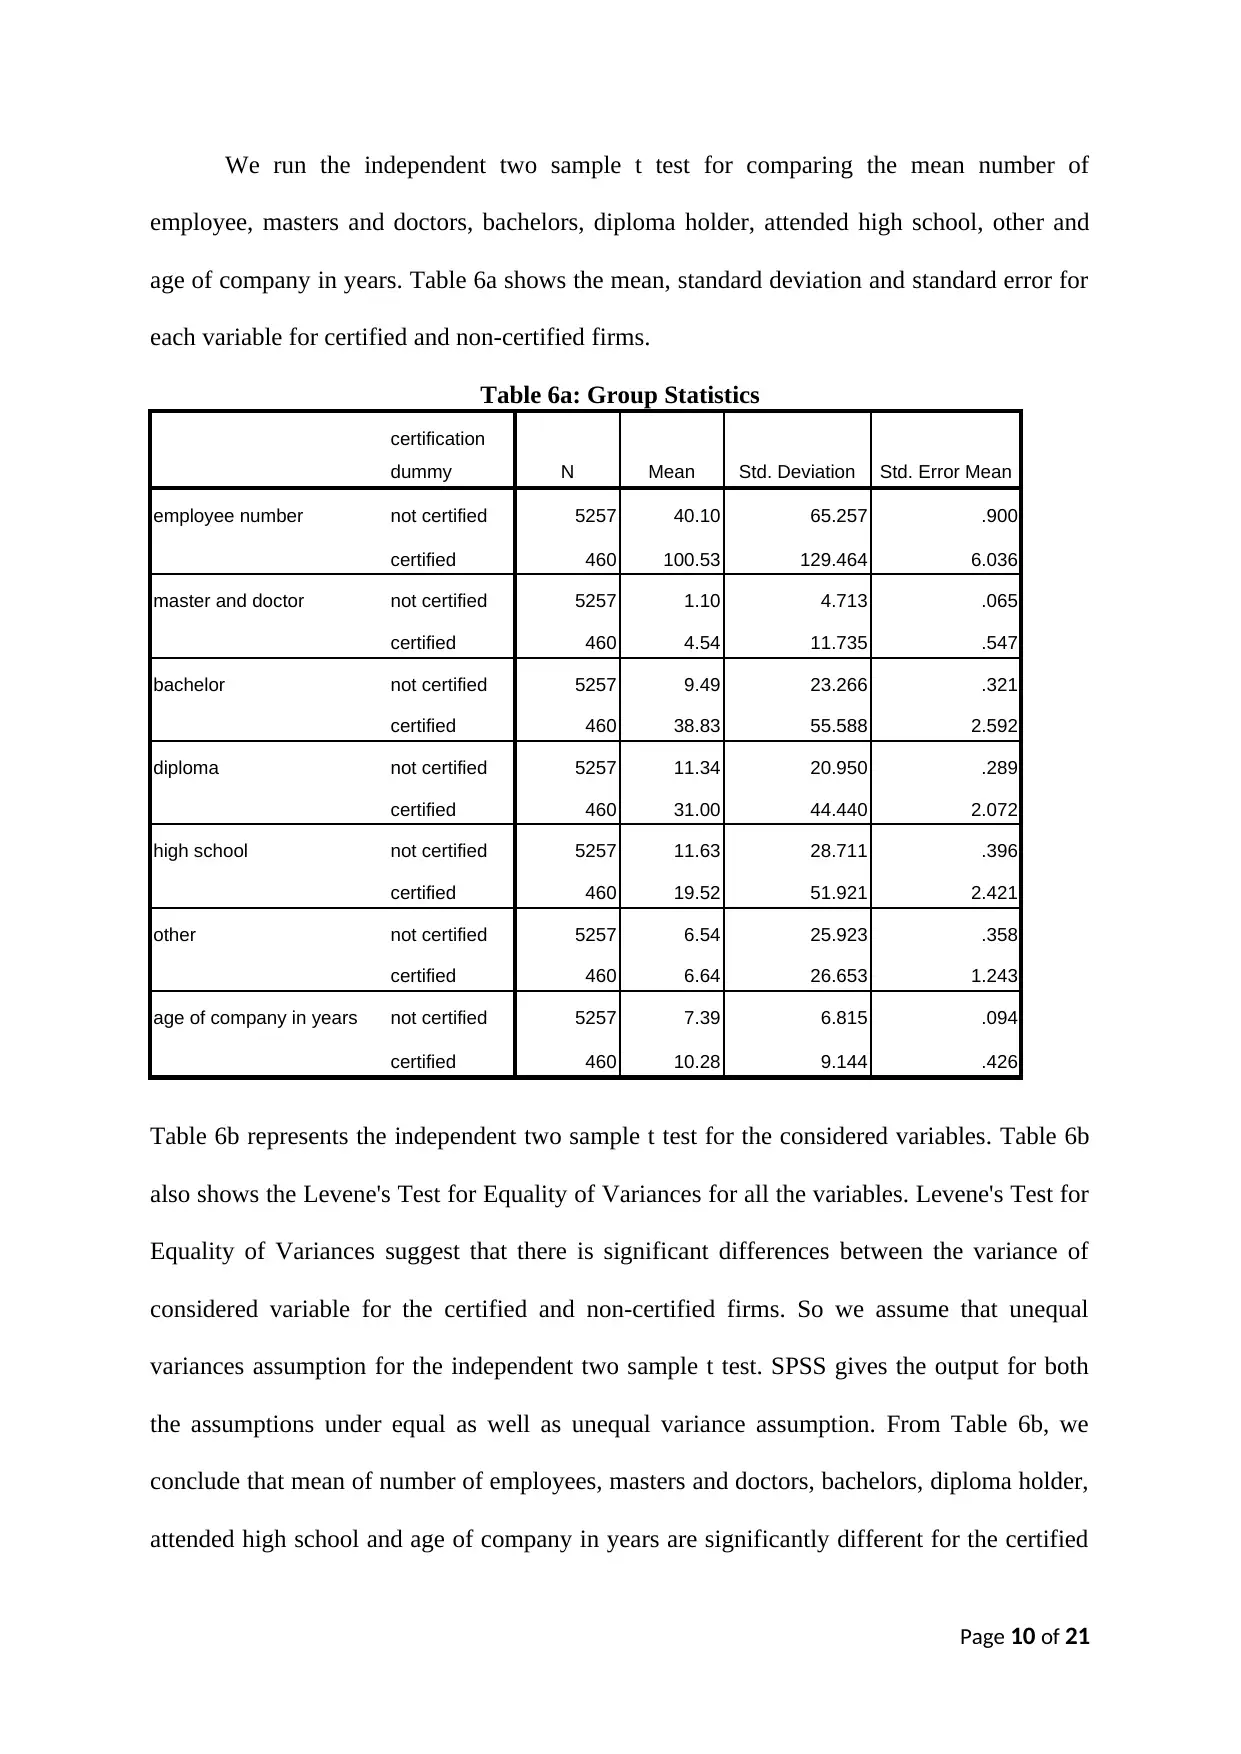
We run the independent two sample t test for comparing the mean number of
employee, masters and doctors, bachelors, diploma holder, attended high school, other and
age of company in years. Table 6a shows the mean, standard deviation and standard error for
each variable for certified and non-certified firms.
Table 6a: Group Statistics
certification
dummy N Mean Std. Deviation Std. Error Mean
employee number not certified 5257 40.10 65.257 .900
certified 460 100.53 129.464 6.036
master and doctor not certified 5257 1.10 4.713 .065
certified 460 4.54 11.735 .547
bachelor not certified 5257 9.49 23.266 .321
certified 460 38.83 55.588 2.592
diploma not certified 5257 11.34 20.950 .289
certified 460 31.00 44.440 2.072
high school not certified 5257 11.63 28.711 .396
certified 460 19.52 51.921 2.421
other not certified 5257 6.54 25.923 .358
certified 460 6.64 26.653 1.243
age of company in years not certified 5257 7.39 6.815 .094
certified 460 10.28 9.144 .426
Table 6b represents the independent two sample t test for the considered variables. Table 6b
also shows the Levene's Test for Equality of Variances for all the variables. Levene's Test for
Equality of Variances suggest that there is significant differences between the variance of
considered variable for the certified and non-certified firms. So we assume that unequal
variances assumption for the independent two sample t test. SPSS gives the output for both
the assumptions under equal as well as unequal variance assumption. From Table 6b, we
conclude that mean of number of employees, masters and doctors, bachelors, diploma holder,
attended high school and age of company in years are significantly different for the certified
Page 10 of 21
Paraphrase This Document
Need a fresh take? Get an instant paraphrase of this document with our AI Paraphraser

and non-certified firms. Mean of number of employees, masters and doctors, bachelors,
diploma holder, attended high school and age of company in years for the certified firm is
more than non-certified firms. We can say that as the number of employees, masters and
doctors, bachelors, diploma holder, attended high school and age of company in years are the
important variables for the certified firms and are to be considered as the main determinant.
Page 11 of 21
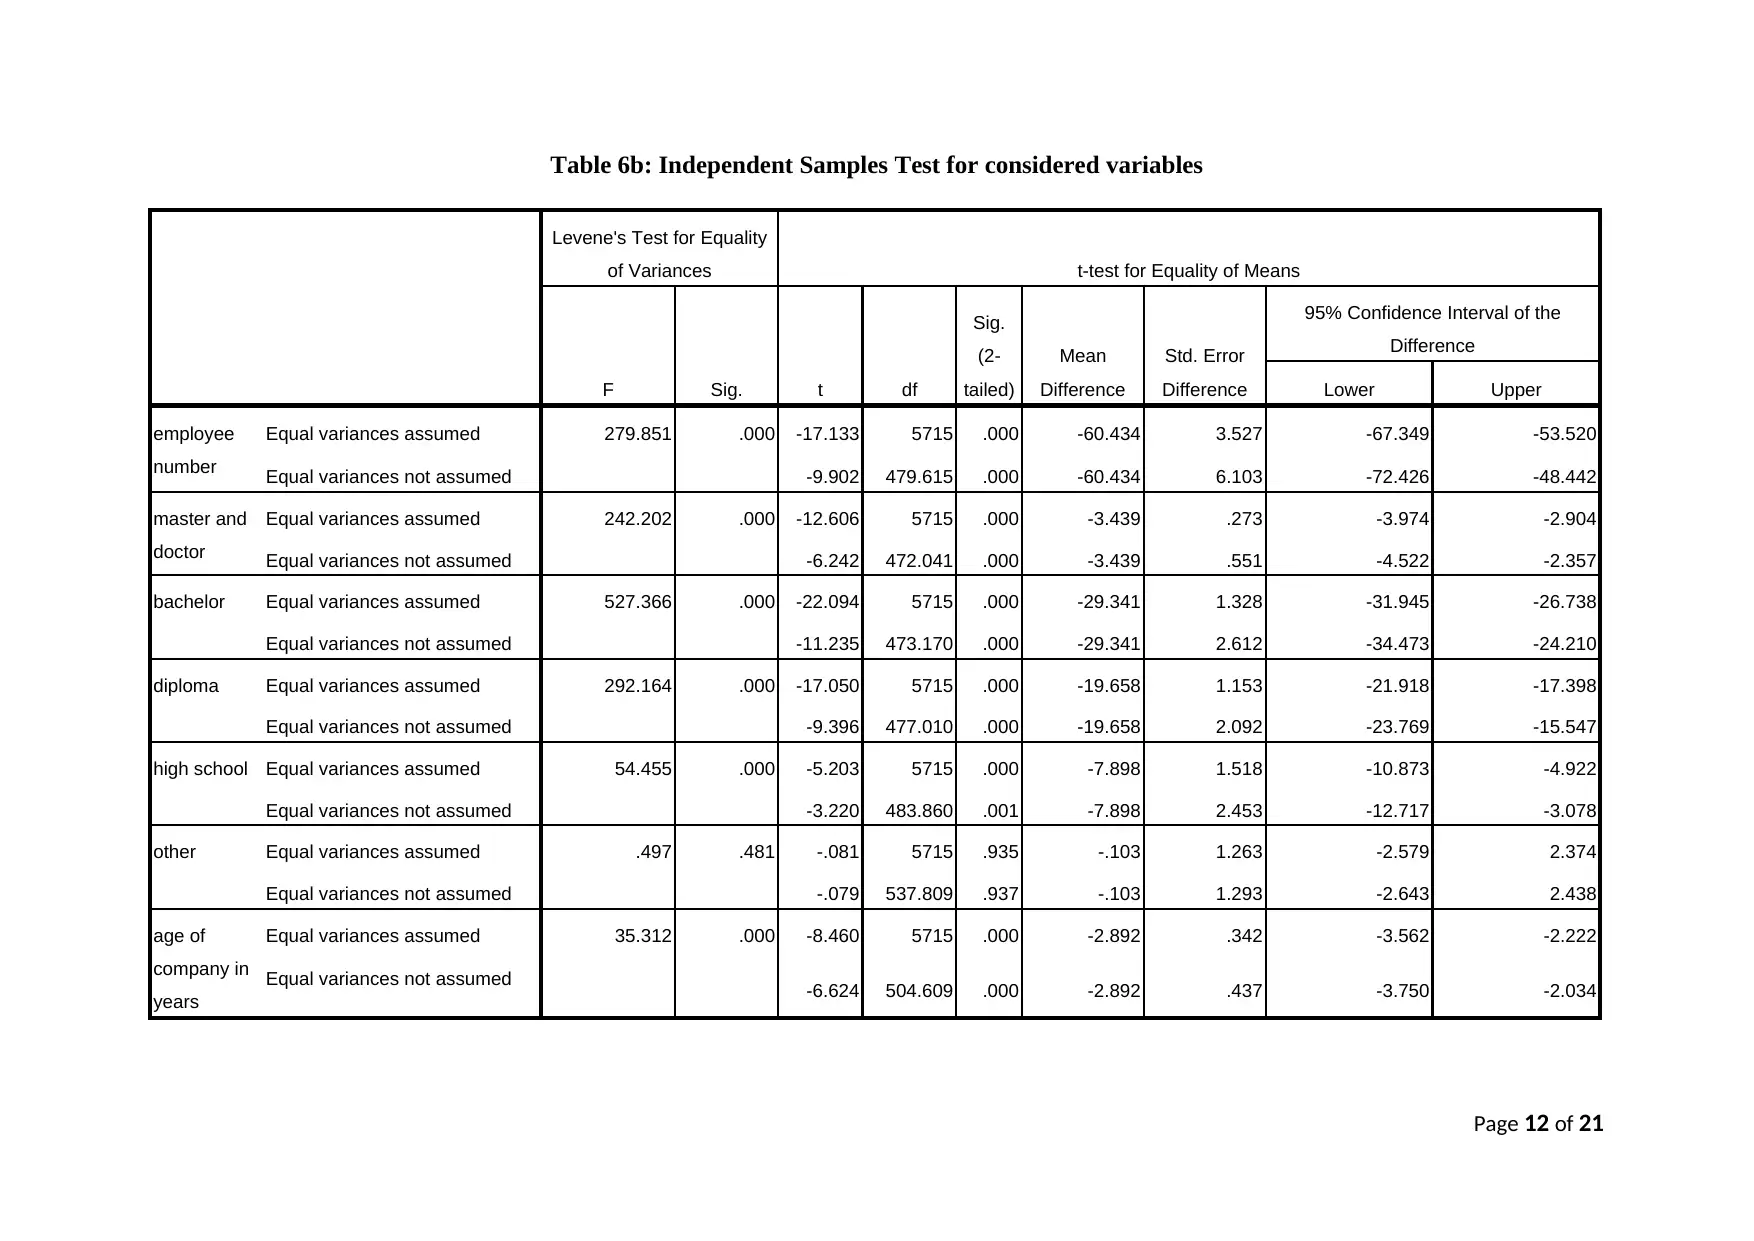
Table 6b: Independent Samples Test for considered variables
Levene's Test for Equality
of Variances t-test for Equality of Means
F Sig. t df
Sig.
(2-
tailed)
Mean
Difference
Std. Error
Difference
95% Confidence Interval of the
Difference
Lower Upper
employee
number
Equal variances assumed 279.851 .000 -17.133 5715 .000 -60.434 3.527 -67.349 -53.520
Equal variances not assumed -9.902 479.615 .000 -60.434 6.103 -72.426 -48.442
master and
doctor
Equal variances assumed 242.202 .000 -12.606 5715 .000 -3.439 .273 -3.974 -2.904
Equal variances not assumed -6.242 472.041 .000 -3.439 .551 -4.522 -2.357
bachelor Equal variances assumed 527.366 .000 -22.094 5715 .000 -29.341 1.328 -31.945 -26.738
Equal variances not assumed -11.235 473.170 .000 -29.341 2.612 -34.473 -24.210
diploma Equal variances assumed 292.164 .000 -17.050 5715 .000 -19.658 1.153 -21.918 -17.398
Equal variances not assumed -9.396 477.010 .000 -19.658 2.092 -23.769 -15.547
high school Equal variances assumed 54.455 .000 -5.203 5715 .000 -7.898 1.518 -10.873 -4.922
Equal variances not assumed -3.220 483.860 .001 -7.898 2.453 -12.717 -3.078
other Equal variances assumed .497 .481 -.081 5715 .935 -.103 1.263 -2.579 2.374
Equal variances not assumed -.079 537.809 .937 -.103 1.293 -2.643 2.438
age of
company in
years
Equal variances assumed 35.312 .000 -8.460 5715 .000 -2.892 .342 -3.562 -2.222
Equal variances not assumed -6.624 504.609 .000 -2.892 .437 -3.750 -2.034
Page 12 of 21
⊘ This is a preview!⊘
Do you want full access?
Subscribe today to unlock all pages.
Trusted by 1+ million students worldwide
1 out of 21
Related Documents


Your All-in-One AI-Powered Toolkit for Academic Success.
+13062052269
info@desklib.com
Available 24*7 on WhatsApp / Email
![[object Object]](/_next/static/media/star-bottom.7253800d.svg)
Unlock your academic potential
Copyright © 2020–2026 A2Z Services. All Rights Reserved. Developed and managed by ZUCOL.