Investigating ISO 9000 Adoption Factors & Impact on Firm Performance
VerifiedAdded on 2023/06/11
|18
|3943
|409
Report
AI Summary
This report investigates the factors influencing the adoption of ISO 9000 certification and its subsequent impact on firm performance, focusing on service firms in China from 2004 to 2008. Using a panel data approach and ordinary least squares regression, the study examines the relationship between ISO 9000 certification and variables such as employee number, company age, return on sales, and return on assets. The research also employs an independent samples t-test to compare the financial performance of certified and non-certified firms. The findings indicate a significant association between certification status and industry, with certified firms demonstrating higher profitability. Key determinants of ISO 9000 certification include employee number and company age (positively related) and return on sales and return on assets (negatively related). The report concludes with managerial advice and suggestions for future research, acknowledging limitations in the current study.

Statistics and business research method
Name:
Institution:
26th May 2018
Name:
Institution:
26th May 2018
Paraphrase This Document
Need a fresh take? Get an instant paraphrase of this document with our AI Paraphraser
Table of Contents
Executive Summary.........................................................................................................................3
Introduction......................................................................................................................................4
Research Questions......................................................................................................................5
Literature review and hypothesis development...............................................................................5
Research methodology and design..................................................................................................7
Analyses and findings......................................................................................................................8
Descriptive statistics:...................................................................................................................8
Inferential statistics:...................................................................................................................10
Chi-Square test.......................................................................................................................10
Independent t-test...................................................................................................................11
Logistic regression.................................................................................................................12
Discussion and managerial advises...............................................................................................14
Limitations and directions for future research...............................................................................14
References......................................................................................................................................15
Appendix........................................................................................................................................18
Executive Summary
The purpose of this paper is to investigate the determinants of the adoption of ISO 9000 and its
impact on firm performance. The adoption of ISO 9000 is theoretically assumed to be pegged on
factors such as cost of goods sold, sales revenue and asset turnover (sales/total assets). The study
employed a panel data approach covering all service firms in China (both the certified and the
non-certified firms) from the year 2004 to 2008. The impact of the firm certification as well as
the influencing factors was done using ordinary least squares regression model. While
comparisons of the performance for the certified and non-certified was done using independent
samples t-test.
Results showed that there is evidence of significant association between certification status and
industry where the firm belongs to. Majority of certified firms (47.6%) were in specialized
technology services while for the non-certified firms, majority (50.4%) were in Business
services.
We also found out that a significant difference in the mean profit for the certified and non-
certified firms exists where the certified firms were found to make more profits (more than
double) as compared to the non-certified firms. Lastly, four factors were found to significantly
affect the ISO 9000 certification of firms in China. The four factors are; employee number, age
of the company, return on sales and return on assets. Variables such as FDI dummy, asset and
equity had no significant influence on ISO 9000 certification of the firms.
The employee number and age of the company were found to be positively related with the ISO
9000 certification while return on sales and return on assets had a negative relationship with the
ISO certification.
⊘ This is a preview!⊘
Do you want full access?
Subscribe today to unlock all pages.
Trusted by 1+ million students worldwide
Introduction
The concept of ISO 9000 series of value administration frameworks standard has been broadly
applauded worldwide since its inception in 1987. Beginning of 2014 saw over 1million facilities
adopting ISO 9000 in close to 189 countries. Practitioners and academicians are enthusiastic in
understanding the influencing factors that determine the adoption of ISO 9000 and the impact
these factors have on financial performance of the firms (Benner & Veloso , 2008).
The current study sought to explore whether the ISO 9000 accreditation is a vital factor
influencing firms' present and future performance. Specifically, we center the study on whether
the ownership of an ISO 9000 affirmation, which is viewed as demonstrative of a company's
quality administration framework, is in the end converted into a change of the company's
financial performance (Du, Yin, & Zhang, 2016).
In doing as such, we look at the impact of the ISO 9000 accreditation on the monetary
performance of traded on an open market firms by contrasting the groups of firms that hold the
ISO 9000 accreditation with a control group of firms that have never gained such a certification,
utilizing both unmatched and matched analysis (Nakamura, Takahashi, & Vertinsky, 2001).
Moreover, the impact of the ISO 9000 affirmation is inspected by looking at the monetary
performance in the certified subgroups. The investigation is pegged on census data of the service
firms that was conducted by the National Bureau of Statistics of China in 2008.
The contributions from this investigation to existing body of knowledge is three-fold. Right off
the bat, the investigation utilizes a sample comprising of the considerable number of firms in the
Paraphrase This Document
Need a fresh take? Get an instant paraphrase of this document with our AI Paraphraser
service industry (Chatzoglou, Chatzoudes, & Kipraios , The impact of ISO 9000 certification on
firms’ financial performance, 2015). Besides, a more significant examination is performed in
view of both unmatched and matched sample strategies utilizing coarsened exact matching
systems to match the ISO 9000 accredited firms with the control firms.
Research Questions
The study sought to answer three research questions. The three research questions are;
Q1: Is there significant difference in the financial performance of the ISO 9000 certified firms
and the non-certified firms?
Q2: What factors significantly influence the adoption of ISO 9000 certification by companies?
Q3: Is there association between ISO 900 certification and the industry where the firm operates
in?
Literature review and hypothesis development
Existing body of knowledge examines the impact on company's money related performance as a
result of the adoption of the ISO 9000 certification. As earlier mentioned, a substantial
assortment of existing literature gives blended and clashing confirmation with respect to the
connection between ISO 9000 accreditation and organization's financial performance. Different
investigations contend that there exists a solid and positive connection while other scholars
contend that such a connection are feeble or even negative. The non-existent or weak role of the
ISO 9000 accreditation on company's financial performance is accounted for by existing
examinations.
The investigation of Singels et al. (2001), finds that the execution of the ISO 9000 confirmed
firms isn't superior to that of non-certified firms. Additionally, the investigation of Lima et al.
(2005), finds that there is no distinction with respect to the financial performance between the
ISO 9000 affirmed firms and a control group of comparative non-certified firms.
In a similar line, the examination of Wayhan et al. (2002), reports that the effect of ISO 9000
accreditation on the organization's financial performance, measured by return on assets (ROA), is
extremely constrained and this impact rapidly blurs away after some time. Correspondingly, the
investigation of Martinez-Costa and Martinez-Lorente (2007), reports that the ISO 9000
accreditation effect is negative as affirmed firms receive less profit and ROA in the post three-
year accreditation period.
Moreover, the investigation of Naveh and Marcus (2005), reports that the ISO 9000 certified
firms are not profited from the accreditation as the accreditation does not prompt an expansion in
their profitability. Furthermore, the exploration of Tsekouras et al. (2002), utilizing a sample of
143 Greek firms that embraced ISO 9000 schemes in the vicinity of 1989 and 1993 and
comparative non-adopters, finds no impact of the ISO 9000 accreditation on firm's performance.
Then again, it creates the impression that more recent examinations demonstrate a solid and
positive relationship between ISO 9000 certification and company's financial performance.
The investigation of Sharma (2005), finds that the monetary performance of the ISO 9000
affirmed firms, is essentially more prominent in contrast with the money related performance of
matched non-certified firms (particularly in net revenue). In a similar vein, the investigation of
Corbett et al. (2005), finds that traded on an open market ISO 9000 accredited US firms
demonstrate essential unusual money related performance improvements three years after
accreditation, in all instances of the matched control groups studied. Moreover, the examination
⊘ This is a preview!⊘
Do you want full access?
Subscribe today to unlock all pages.
Trusted by 1+ million students worldwide
of Chow-Chua, et al. (2005), finds that the ISO 9000 accreditation prompts critical upgrades in
performance, in the five year time frame following confirmation paying little mind to matched
control group specification, however this isn't really the case for business performance
improvements. Also, the investigation of Levine and Toffel (2010), reports that the ISO 9000
accredited firms encounter significantly more prominent development after accreditation
concerning employment, sales and several employee results in contrast with the matched non-
accredited firms. In a similar line, the exploration of Ullah et al. (2014), finds that the ISO
affirmed firms display higher work efficiency and lower cost of sales when contrasted with a
matched control group of non-certified firms. Also, the investigation of Chatzoglou et al. (2015),
finds that the ISO 9000 accreditation is exceptionally connected with general monetary
performance improvements.
Research methodology and design
This section describes how to perform the unmatched and matched analysis of this study based
on the proposed group classification. The unmatched analysis involves comparing the
performance of the ISO 9000 certified groups with a control group of non-certified firms
irrespectively of the different characteristics of the compared firms. The matched analysis
involves comparing the relevant groups (the ISO certified group versus the non-certified) by
including those certified and non-certified firms that share similar characteristics based on
specific pre-certification matching criteria such as firm size, firm age and business. Independent
t-test will be used to compare the financial performance of the two groups (certified and non-
certified groups). In regard to factors influencing certification, a logistic regression model will be
used to test whether there is significant influence of the factors on the dummy variable for
certification (i.e. 1 = certified, 0 = non-certified).
Paraphrase This Document
Need a fresh take? Get an instant paraphrase of this document with our AI Paraphraser
Analyses and findings
Descriptive statistics:
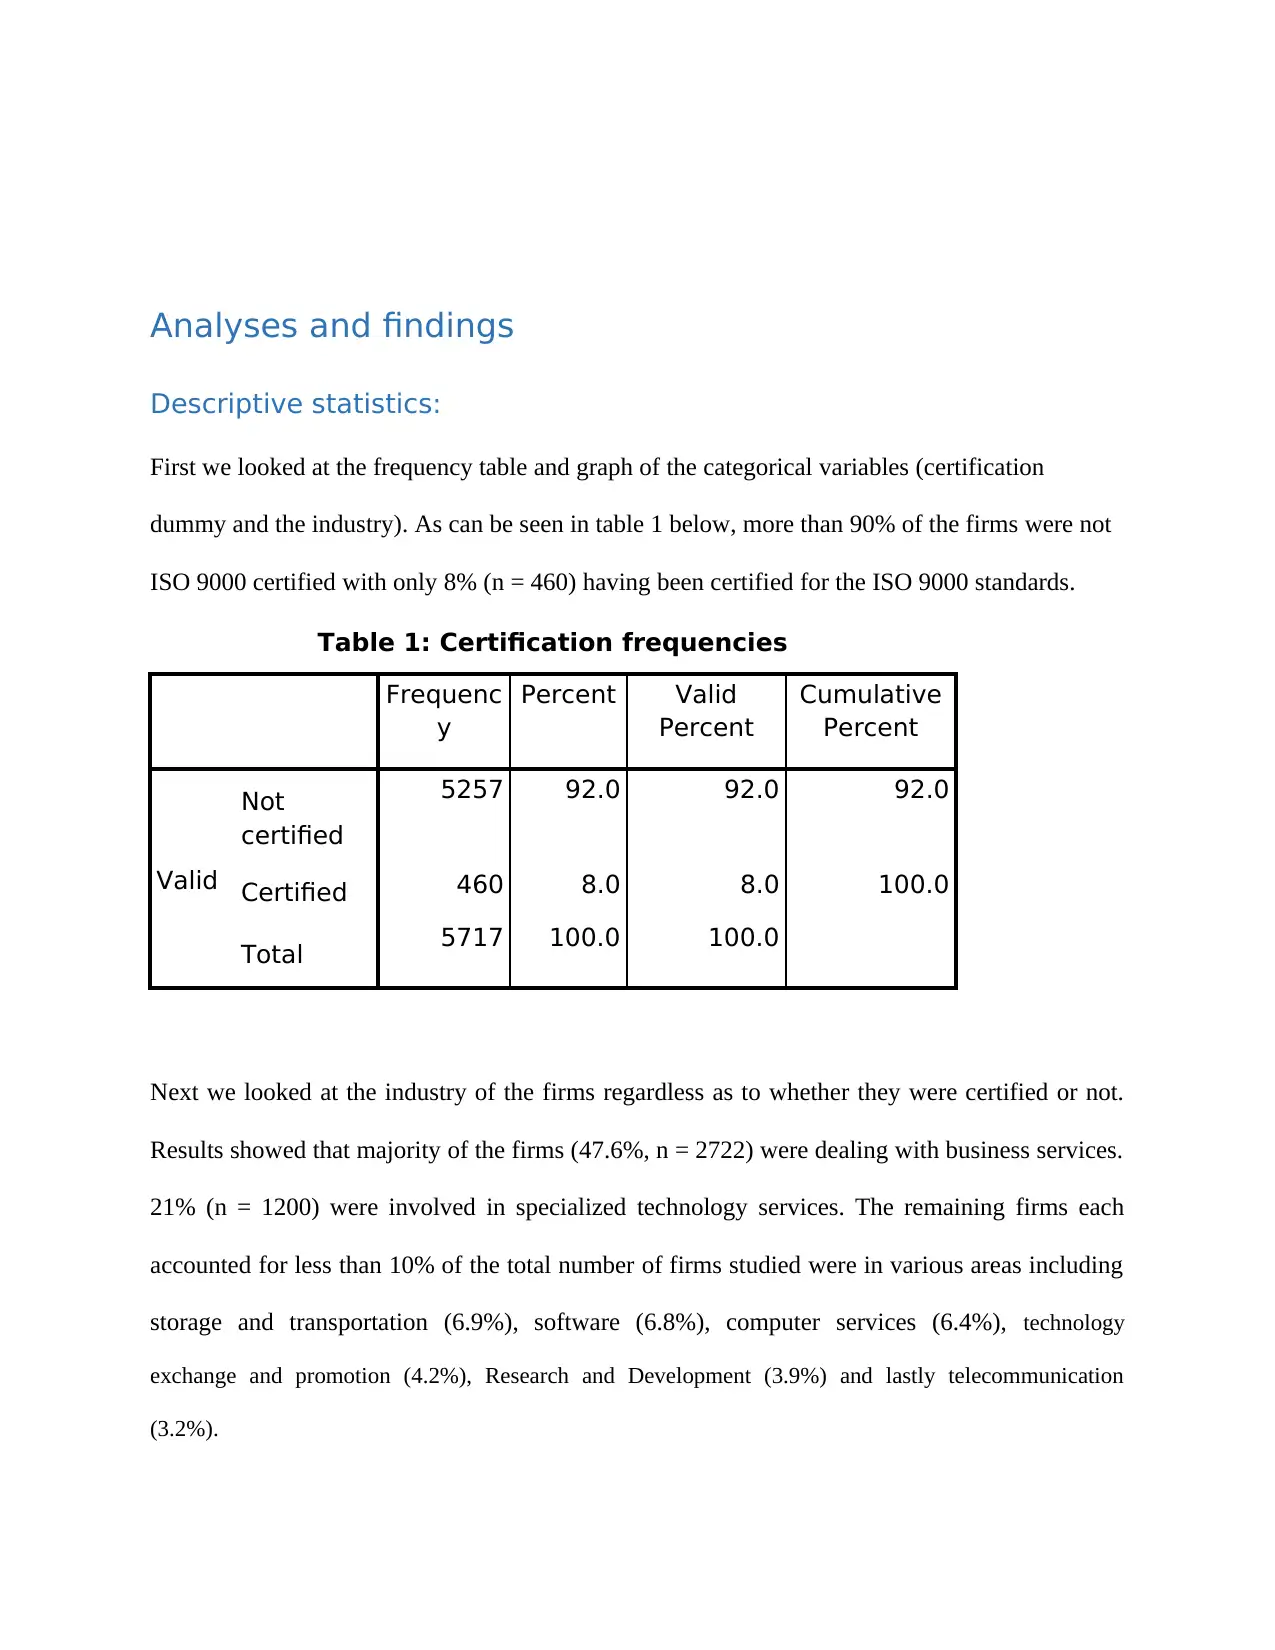
First we looked at the frequency table and graph of the categorical variables (certification
dummy and the industry). As can be seen in table 1 below, more than 90% of the firms were not
ISO 9000 certified with only 8% (n = 460) having been certified for the ISO 9000 standards.
Table 1: Certification frequencies
Frequenc
y
Percent Valid
Percent
Cumulative
Percent
Valid
Not
certified
5257 92.0 92.0 92.0
Certified 460 8.0 8.0 100.0
Total 5717 100.0 100.0
Next we looked at the industry of the firms regardless as to whether they were certified or not.
Results showed that majority of the firms (47.6%, n = 2722) were dealing with business services.
21% (n = 1200) were involved in specialized technology services. The remaining firms each
accounted for less than 10% of the total number of firms studied were in various areas including
storage and transportation (6.9%), software (6.8%), computer services (6.4%), technology
exchange and promotion (4.2%), Research and Development (3.9%) and lastly telecommunication
(3.2%).
Descriptive statistics:
First we looked at the frequency table and graph of the categorical variables (certification
dummy and the industry). As can be seen in table 1 below, more than 90% of the firms were not
ISO 9000 certified with only 8% (n = 460) having been certified for the ISO 9000 standards.
Table 1: Certification frequencies
Frequenc
y
Percent Valid
Percent
Cumulative
Percent
Valid
Not
certified
5257 92.0 92.0 92.0
Certified 460 8.0 8.0 100.0
Total 5717 100.0 100.0
Next we looked at the industry of the firms regardless as to whether they were certified or not.
Results showed that majority of the firms (47.6%, n = 2722) were dealing with business services.
21% (n = 1200) were involved in specialized technology services. The remaining firms each
accounted for less than 10% of the total number of firms studied were in various areas including
storage and transportation (6.9%), software (6.8%), computer services (6.4%), technology
exchange and promotion (4.2%), Research and Development (3.9%) and lastly telecommunication
(3.2%).
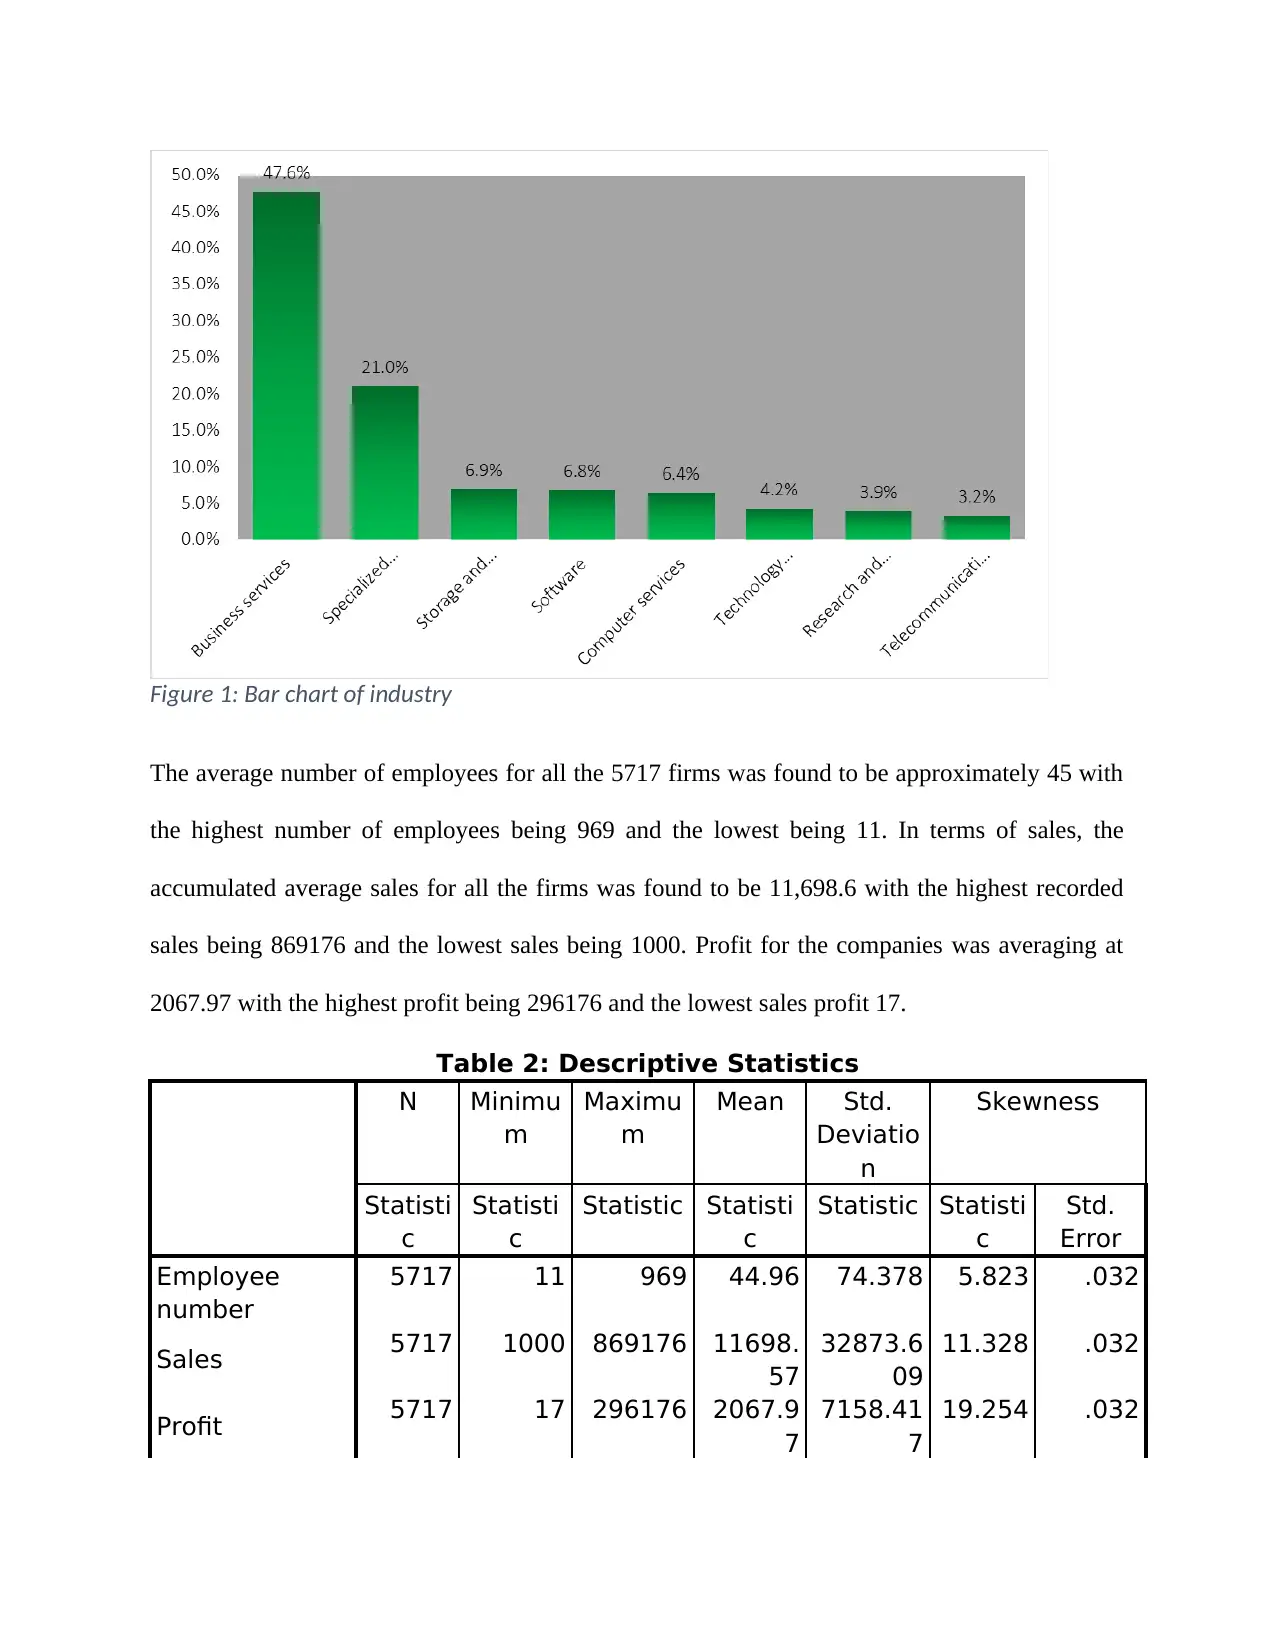
Figure 1: Bar chart of industry
The average number of employees for all the 5717 firms was found to be approximately 45 with
the highest number of employees being 969 and the lowest being 11. In terms of sales, the
accumulated average sales for all the firms was found to be 11,698.6 with the highest recorded
sales being 869176 and the lowest sales being 1000. Profit for the companies was averaging at
2067.97 with the highest profit being 296176 and the lowest sales profit 17.
Table 2: Descriptive Statistics
N Minimu
m
Maximu
m
Mean Std.
Deviatio
n
Skewness
Statisti
c
Statisti
c
Statistic Statisti
c
Statistic Statisti
c
Std.
Error
Employee
number
5717 11 969 44.96 74.378 5.823 .032
Sales 5717 1000 869176 11698.
57
32873.6
09
11.328 .032
Profit 5717 17 296176 2067.9
7
7158.41
7
19.254 .032
⊘ This is a preview!⊘
Do you want full access?
Subscribe today to unlock all pages.
Trusted by 1+ million students worldwide
Asset 5717 1000 978548 16473.
16
54666.5
60
9.296 .032
Return on
sales
5717 .01 .51 .1911 .12397 .514 .032
Return on
asset
5717 .01 1.02 .2236 .20858 1.500 .032
Valid N
(listwise)
5717
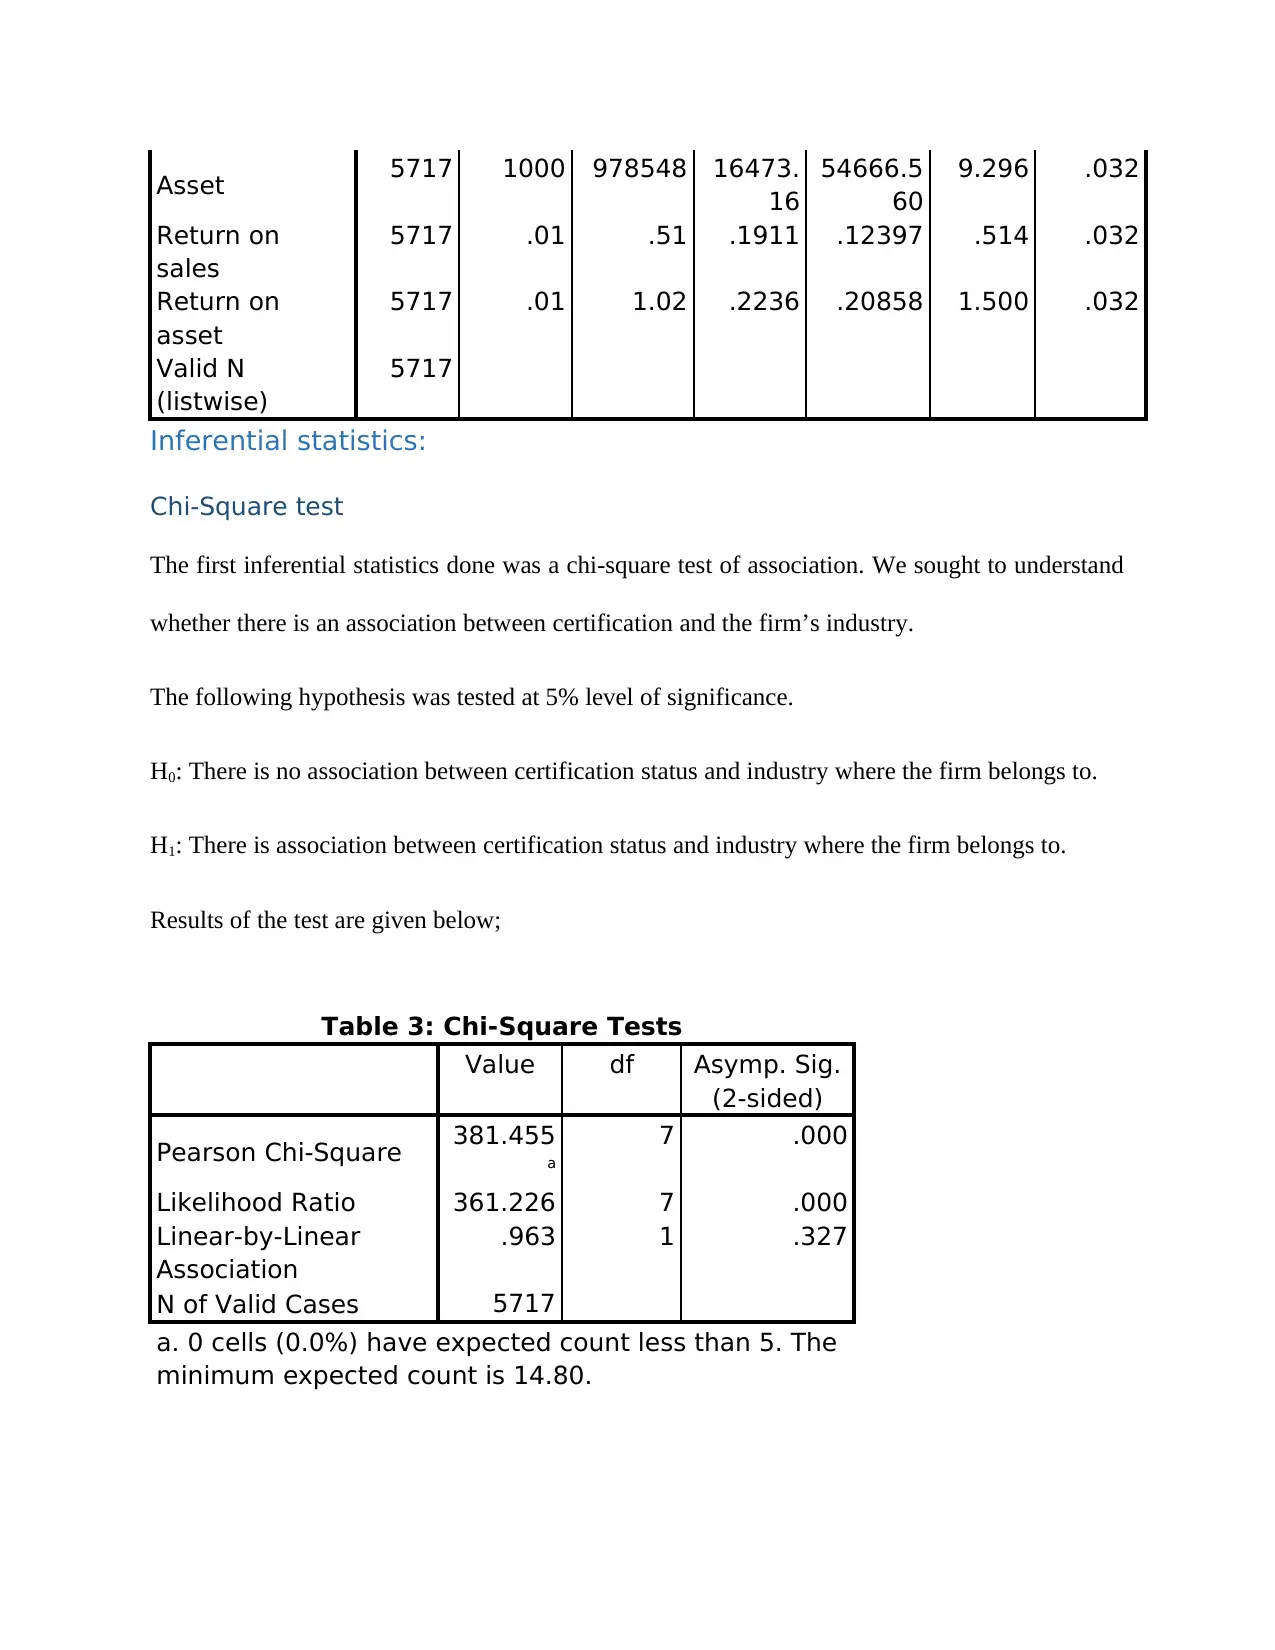
Inferential statistics:
Chi-Square test
The first inferential statistics done was a chi-square test of association. We sought to understand
whether there is an association between certification and the firm’s industry.
The following hypothesis was tested at 5% level of significance.
H0: There is no association between certification status and industry where the firm belongs to.
H1: There is association between certification status and industry where the firm belongs to.
Results of the test are given below;
Table 3: Chi-Square Tests
Value df Asymp. Sig.
(2-sided)
Pearson Chi-Square 381.455
a
7 .000
Likelihood Ratio 361.226 7 .000
Linear-by-Linear
Association
.963 1 .327
N of Valid Cases 5717
a. 0 cells (0.0%) have expected count less than 5. The
minimum expected count is 14.80.
16
54666.5
60
9.296 .032
Return on
sales
5717 .01 .51 .1911 .12397 .514 .032
Return on
asset
5717 .01 1.02 .2236 .20858 1.500 .032
Valid N
(listwise)
5717
Inferential statistics:
Chi-Square test
The first inferential statistics done was a chi-square test of association. We sought to understand
whether there is an association between certification and the firm’s industry.
The following hypothesis was tested at 5% level of significance.
H0: There is no association between certification status and industry where the firm belongs to.
H1: There is association between certification status and industry where the firm belongs to.
Results of the test are given below;
Table 3: Chi-Square Tests
Value df Asymp. Sig.
(2-sided)
Pearson Chi-Square 381.455
a
7 .000
Likelihood Ratio 361.226 7 .000
Linear-by-Linear
Association
.963 1 .327
N of Valid Cases 5717
a. 0 cells (0.0%) have expected count less than 5. The
minimum expected count is 14.80.
Paraphrase This Document
Need a fresh take? Get an instant paraphrase of this document with our AI Paraphraser
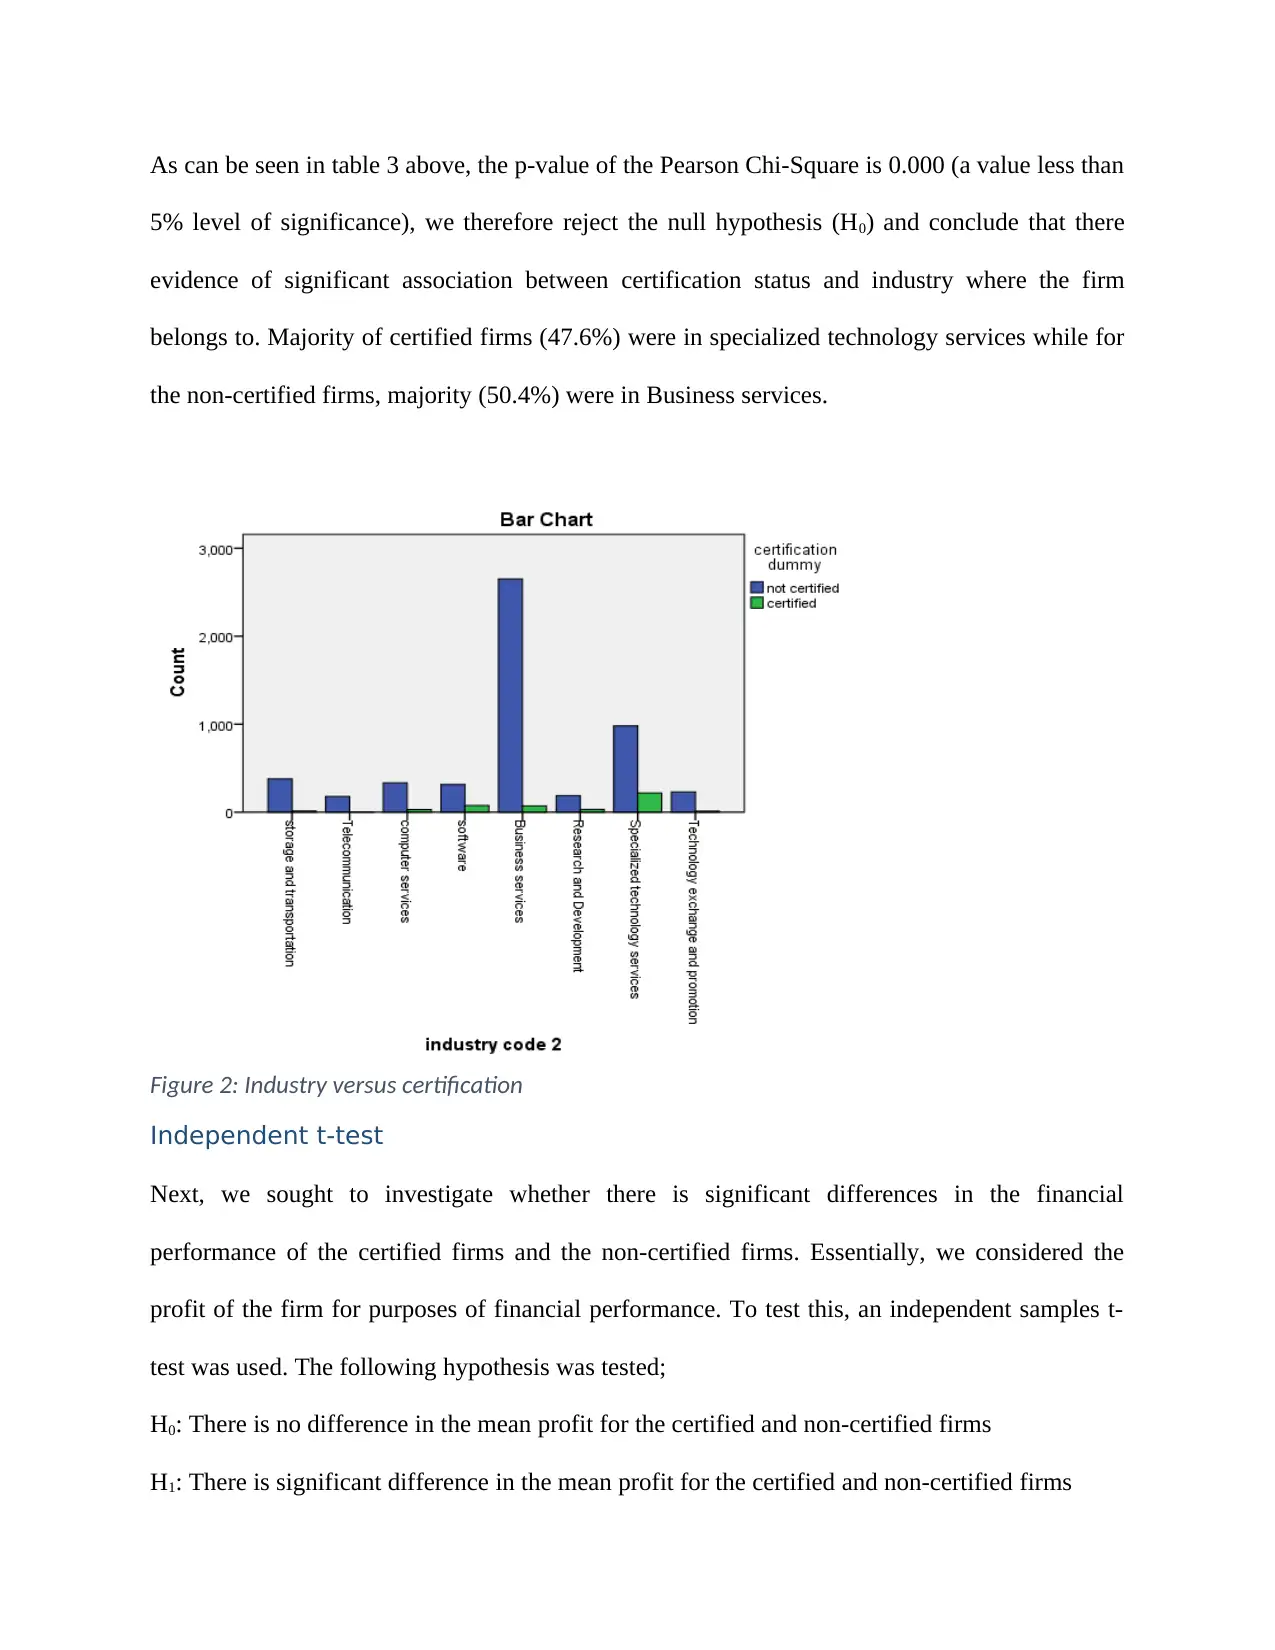
As can be seen in table 3 above, the p-value of the Pearson Chi-Square is 0.000 (a value less than
5% level of significance), we therefore reject the null hypothesis (H0) and conclude that there
evidence of significant association between certification status and industry where the firm
belongs to. Majority of certified firms (47.6%) were in specialized technology services while for
the non-certified firms, majority (50.4%) were in Business services.
Figure 2: Industry versus certification
Independent t-test
Next, we sought to investigate whether there is significant differences in the financial
performance of the certified firms and the non-certified firms. Essentially, we considered the
profit of the firm for purposes of financial performance. To test this, an independent samples t-
test was used. The following hypothesis was tested;
H0: There is no difference in the mean profit for the certified and non-certified firms
H1: There is significant difference in the mean profit for the certified and non-certified firms
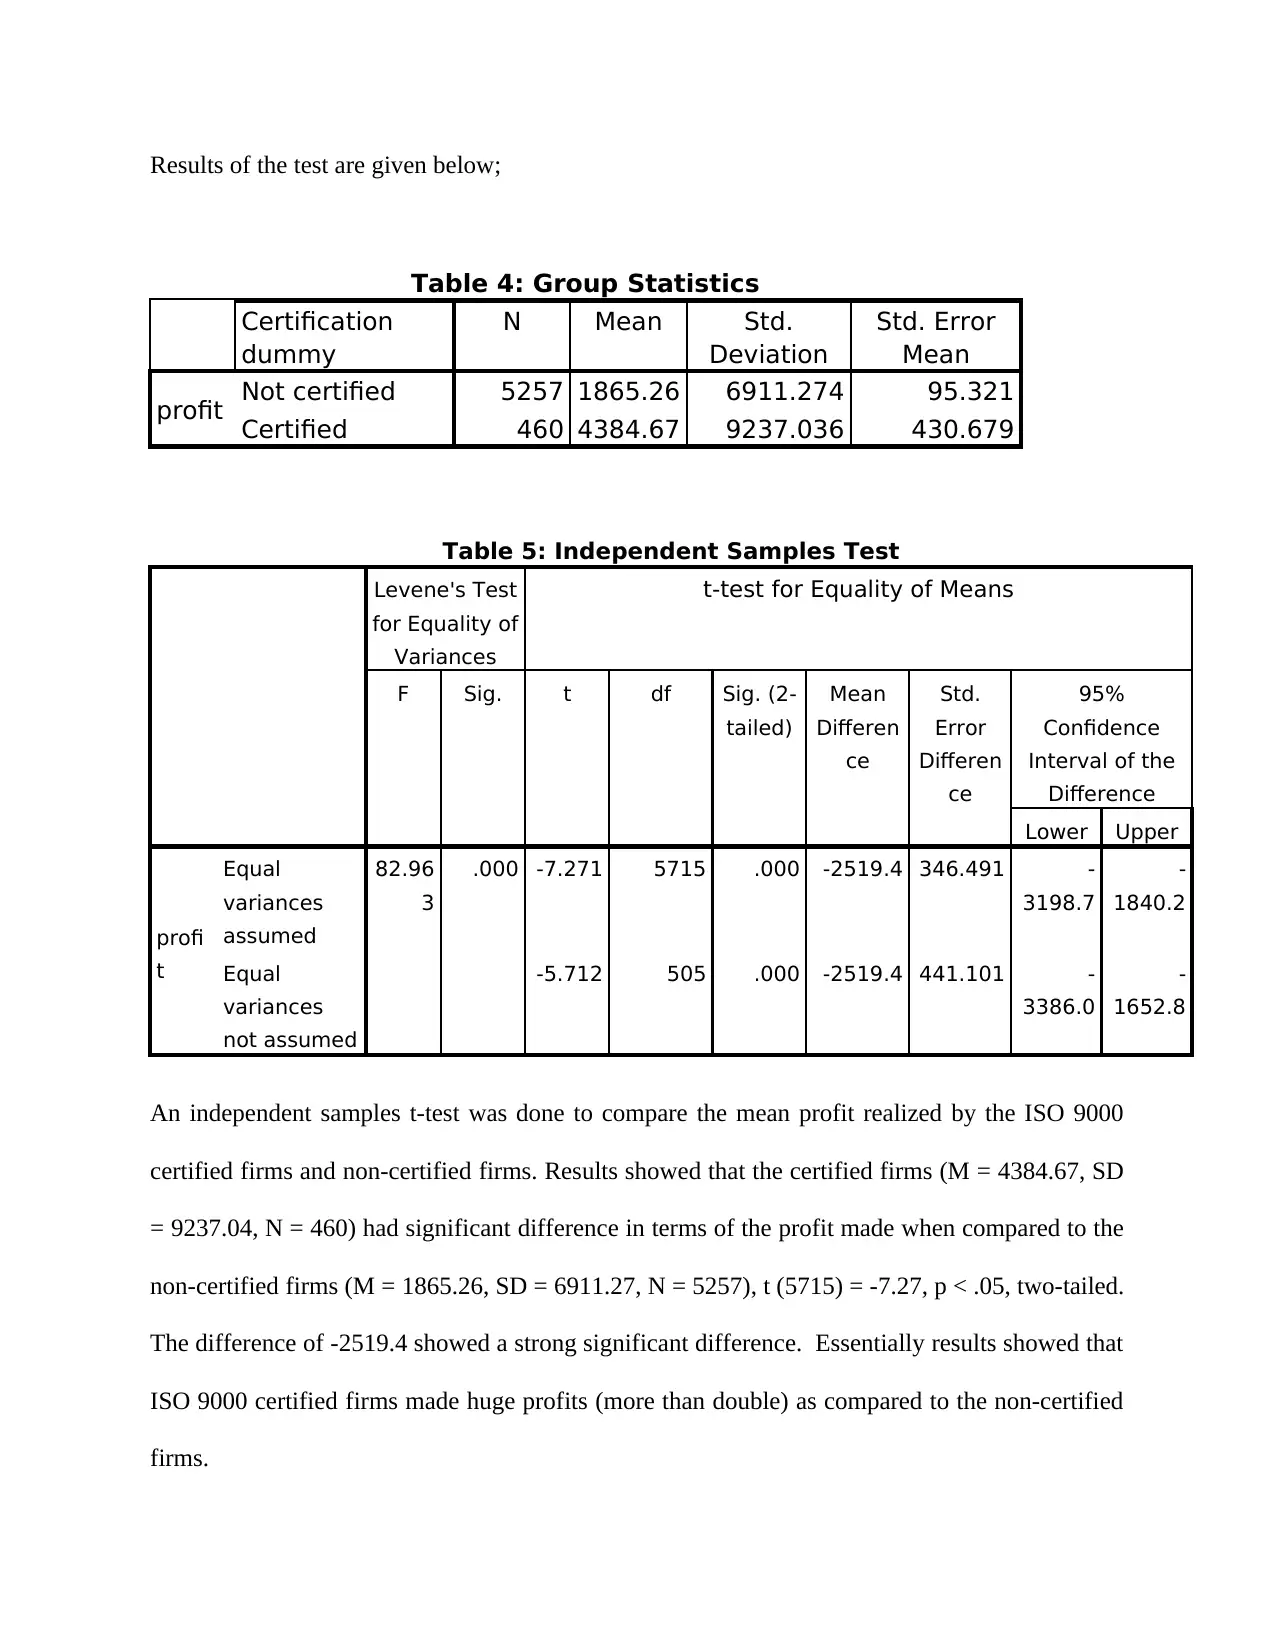
Results of the test are given below;
Table 4: Group Statistics
Certification
dummy
N Mean Std.
Deviation
Std. Error
Mean
profit Not certified 5257 1865.26 6911.274 95.321
Certified 460 4384.67 9237.036 430.679
Table 5: Independent Samples Test
Levene's Test
for Equality of
Variances
t-test for Equality of Means
F Sig. t df Sig. (2-
tailed)
Mean
Differen
ce
Std.
Error
Differen
ce
95%
Confidence
Interval of the
Difference
Lower Upper
profi
t
Equal
variances
assumed
82.96
3
.000 -7.271 5715 .000 -2519.4 346.491 -
3198.7
-
1840.2
Equal
variances
not assumed
-5.712 505 .000 -2519.4 441.101 -
3386.0
-
1652.8
An independent samples t-test was done to compare the mean profit realized by the ISO 9000
certified firms and non-certified firms. Results showed that the certified firms (M = 4384.67, SD
= 9237.04, N = 460) had significant difference in terms of the profit made when compared to the
non-certified firms (M = 1865.26, SD = 6911.27, N = 5257), t (5715) = -7.27, p < .05, two-tailed.
The difference of -2519.4 showed a strong significant difference. Essentially results showed that
ISO 9000 certified firms made huge profits (more than double) as compared to the non-certified
firms.
⊘ This is a preview!⊘
Do you want full access?
Subscribe today to unlock all pages.
Trusted by 1+ million students worldwide
1 out of 18
Related Documents


Your All-in-One AI-Powered Toolkit for Academic Success.
+13062052269
info@desklib.com
Available 24*7 on WhatsApp / Email
![[object Object]](/_next/static/media/star-bottom.7253800d.svg)
Unlock your academic potential
Copyright © 2020–2026 A2Z Services. All Rights Reserved. Developed and managed by ZUCOL.