Analysis of ISO Certification in China's Service Industry
VerifiedAdded on 2022/11/24
|17
|3873
|222
Report
AI Summary
This report investigates the association between ISO certification and various factors within China's service industry, based on a 2008 economic census dataset comprising 5717 observations. The study aims to determine the preferences of firms for ISO certification, considering metrics like equity, revenue, and return on assets, and to examine the differences in operational profits between certified and non-certified firms. Furthermore, it seeks to identify any industry-specific preferences for ISO certification and to assess the relationships between firm profitability, ISO certification status, and company age. The analysis reveals that only 8% of firms were ISO certified, with specialized technology services having the highest percentage of certified firms. Descriptive statistics show that the number of employees, profit, return on sales, and other variables are skewed. Inferential statistics, including t-tests, were used to investigate the relationship between certification status and company age. The study concludes with an analysis of the trend between capital paid by the state and overseas, as well as the distribution of profit across different industries and certification years.
Introduction
China economy is one of the largest economies in the world. This is constituted by its enormous
manufacturing industry. In the Middle East, China is the dominating nation in terms of the gross
domestic product (GDP) and it's high per capita income (Vries et al, 2012). This is made so by
the quality of the products and services that the firms in China offer to their clients and
customers. Further, the government of China creates a favorable and conducive environment for
the firms to operate through considerable taxation and the user-friendly bureaucratic. The firms
that operate in China also nurtures talent by coming up with institutions that promote talents in
various firms. The reports that were released last year by the national bureau of statistics of
China indicated that China was ranked third in the country’s that have improved in the delivery
of service in the past decade. This is made possible by the Chinese body that ensures quality
assurance of products and services that are offered by firms to the end users. The quality
assurance body ensures that the products produced and services offered to meet the quality of the
market and they also satisfy the customers (Nguyen and Hens, 2015). Quality assurance is done
through the International Organization for Standardization (ISO) certification of firms. Before
being ISO certified a firm must go through various assessment to ensure it meets the requirement
of getting an ISO certificate.
To investigate how ISO certification is associated with various factors that are involved in a
business setting this study was conducted. The study entails ISO certification in China on a
survey that was conducted on service firms. The study aims in investigating whether firms prefer
operating in iso certified status or without being iso certified, this will be done by considering
certain metrics like the equity of the firm, the revenue obtained from the firm, and the return on
assets. The study also aims in investigating whether the profit operating in firms differs between
Paraphrase This Document
Need a fresh take? Get an instant paraphrase of this document with our AI Paraphraser
the firms that are iso certified and the firms that are not iso certified. The study aims to determine
whether there is an association between the iso certification status of a firm and the type of
industry. Since the firms operate under different industries it may be found out that firms from a
certain industry prefer being iso certified than firms from other industries. Finally, the study aims
to investigate whether there is any relationship between profit operating in a firm and various
factors like equity the iso certification status, and the age of the company since it was founded.
Literature review
From a study that was conducted by Fura and Wang (2017), they found out that globally 30% of
all iso certified firms are in China. This indicated that the companies in China value the quality
of products that services they provide to their customers. Their study was also supported by Wu
and Chen (2011), who also found out that not only chines companies’ iso certified in China but
they were also seeking international iso certification.
ISO certification depends on the quality of standards that needs to be ISO certified, the most
common iso certification is iso 9000. ISO 9000 define, establish and maintain an effective
quality assurance system for manufacturing and service industries (Tuppura et al, 2016). Iso
9000 presents guidelines intended to increase business efficiency and customer certification.
Once the firms are iso certified it gets a competitive advantage in the market. This means that the
more Chinese companies become certified with iso 9000 the more they will improve sale
opportunities and win trust in the market.
Iso certification involves a process that each company seeking to be iso certified has to follow. In
China, iso certification is done by various organizations like Beijing united certification center
and Hong Kong quality assurance agency. These firms that issue iso certificates must be
accredited so that their services may remain valid and upheld by the law of China. Once a firm is
iso certified by an organization it may also seek to be iso certified by international bodies such as
united kingdom accreditation service (UKAS), by doing this the company knows that it can
create a brand that can be internationally accepted. For instance, Zhu, Cordeiro, and Sarkis
(2013), found out that certain customers in the market preferred products that had a brand name
“made in China”. This meant that Chinese products had won trust in the market. The iso
certification of a firm may also influence the overseas to invest in such firms and they boost their
production.
However, some researchers contradict that a company being iso certified will ensure the
production of quality goods and service. Some firms will just be iso certified for the sake of
winning and attracting customers to their products, while in real sense they do not follow the
standards (Wignaraja, 2012). This is most organizations that provide iso certificates do not
follow up to ensure that companies follow the quality management systems (Tuppura et al,
2016). Mostly auditing is done about the quality products is done once in a year and thus the iso
certified firm may just be following the quality assurance standards only around the auditing
periods leading to the productions of goods and services that are below the quality standards
(Zhang, Tan, & Wong, 2015). On the contrary, there are many benefits that a firm gets once its
iso certified.
Methodology.
The data set used in this study was obtained from the national bureau of statistics of China. The
data is on a survey census that was conducted on service firms in 2008. The dataset contains
5717 observation and 23 variables. For the study purpose, the dataset was filtered and only 11
variables have been used. Data analysis was conducted using SPSS (Statistical Package for
⊘ This is a preview!⊘
Do you want full access?
Subscribe today to unlock all pages.
Trusted by 1+ million students worldwide
Social Sciences). This was because coding in spss is easy and spss produces graphics that
making a comparison between variables easy. Additionally, spss have capabilities for performing
both descriptive and inferential statistics in a version that makes reporting of output to be
convenient.
Analysis and Results
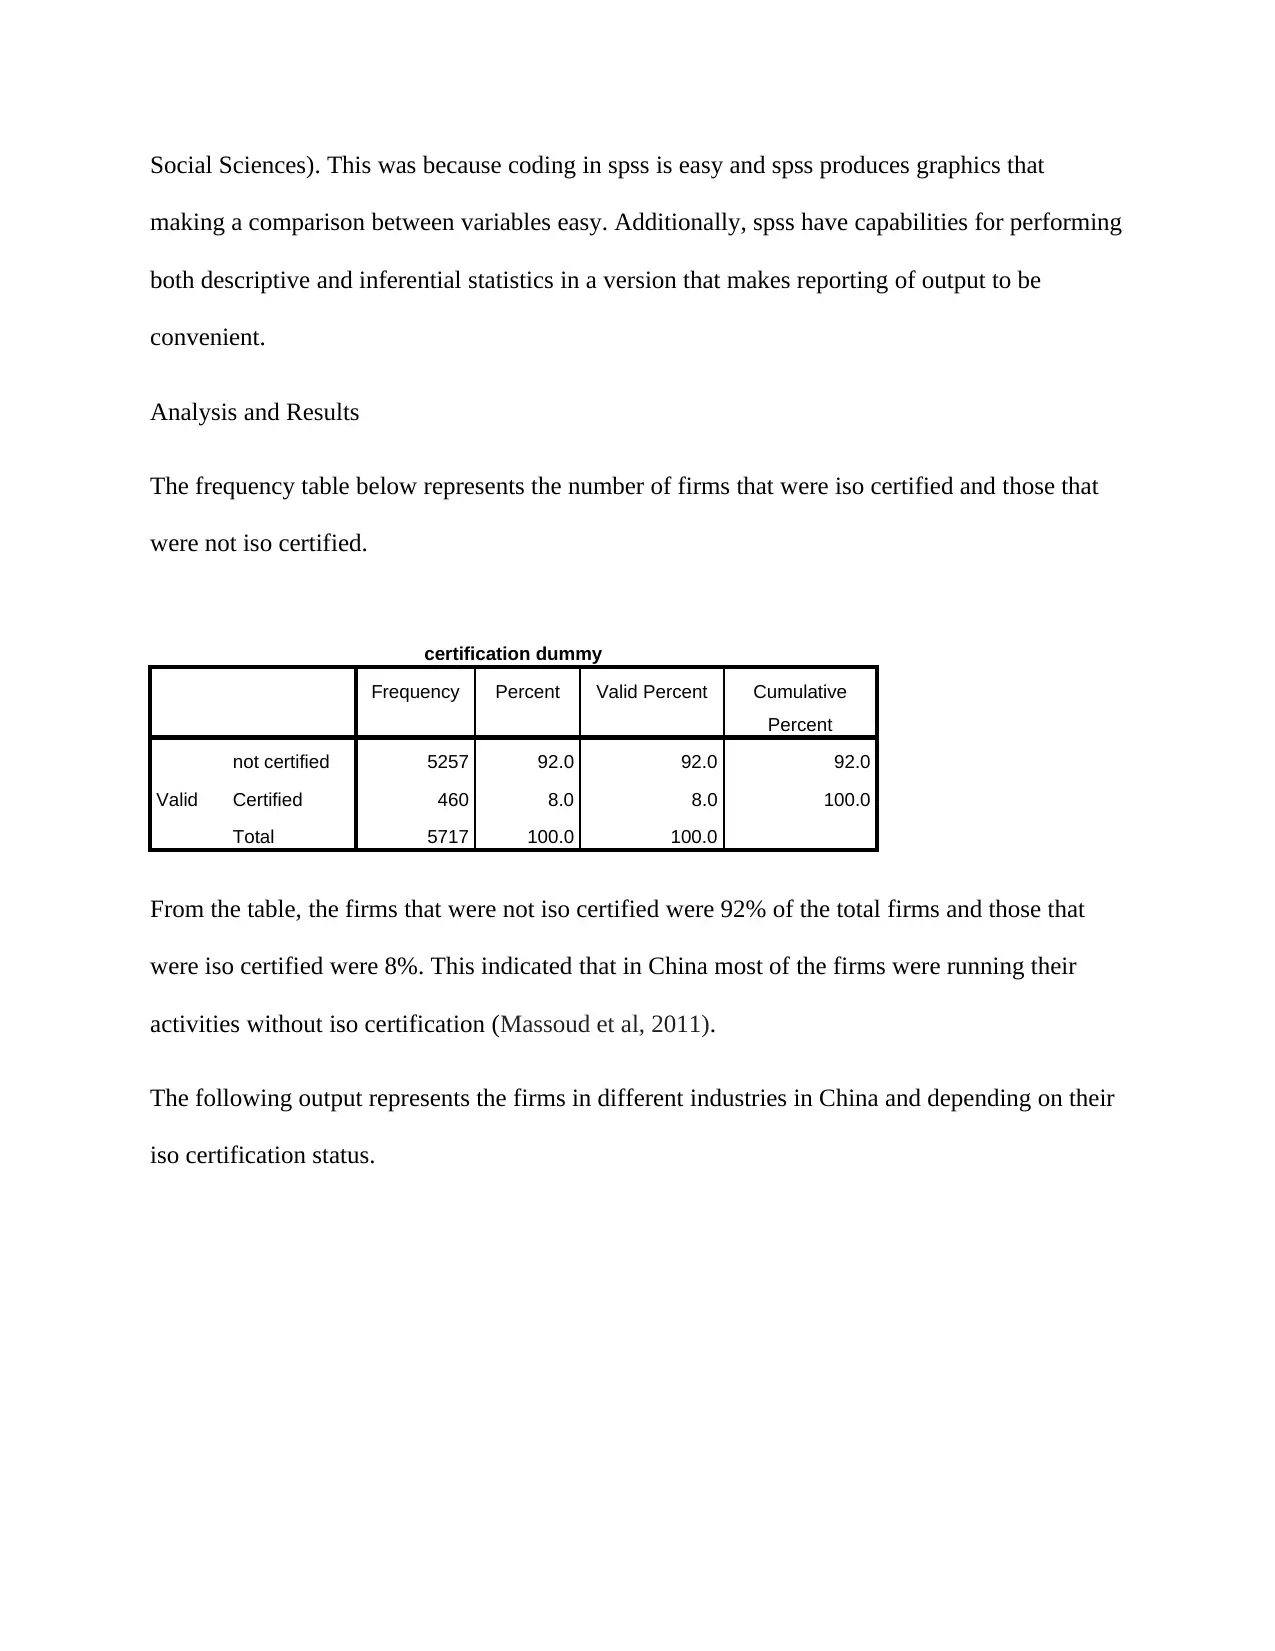
The frequency table below represents the number of firms that were iso certified and those that
were not iso certified.
certification dummy
Frequency Percent Valid Percent Cumulative
Percent
Valid
not certified 5257 92.0 92.0 92.0
Certified 460 8.0 8.0 100.0
Total 5717 100.0 100.0
From the table, the firms that were not iso certified were 92% of the total firms and those that
were iso certified were 8%. This indicated that in China most of the firms were running their
activities without iso certification (Massoud et al, 2011).
The following output represents the firms in different industries in China and depending on their
iso certification status.
making a comparison between variables easy. Additionally, spss have capabilities for performing
both descriptive and inferential statistics in a version that makes reporting of output to be
convenient.
Analysis and Results
The frequency table below represents the number of firms that were iso certified and those that
were not iso certified.
certification dummy
Frequency Percent Valid Percent Cumulative
Percent
Valid
not certified 5257 92.0 92.0 92.0
Certified 460 8.0 8.0 100.0
Total 5717 100.0 100.0
From the table, the firms that were not iso certified were 92% of the total firms and those that
were iso certified were 8%. This indicated that in China most of the firms were running their
activities without iso certification (Massoud et al, 2011).
The following output represents the firms in different industries in China and depending on their
iso certification status.
Paraphrase This Document
Need a fresh take? Get an instant paraphrase of this document with our AI Paraphraser
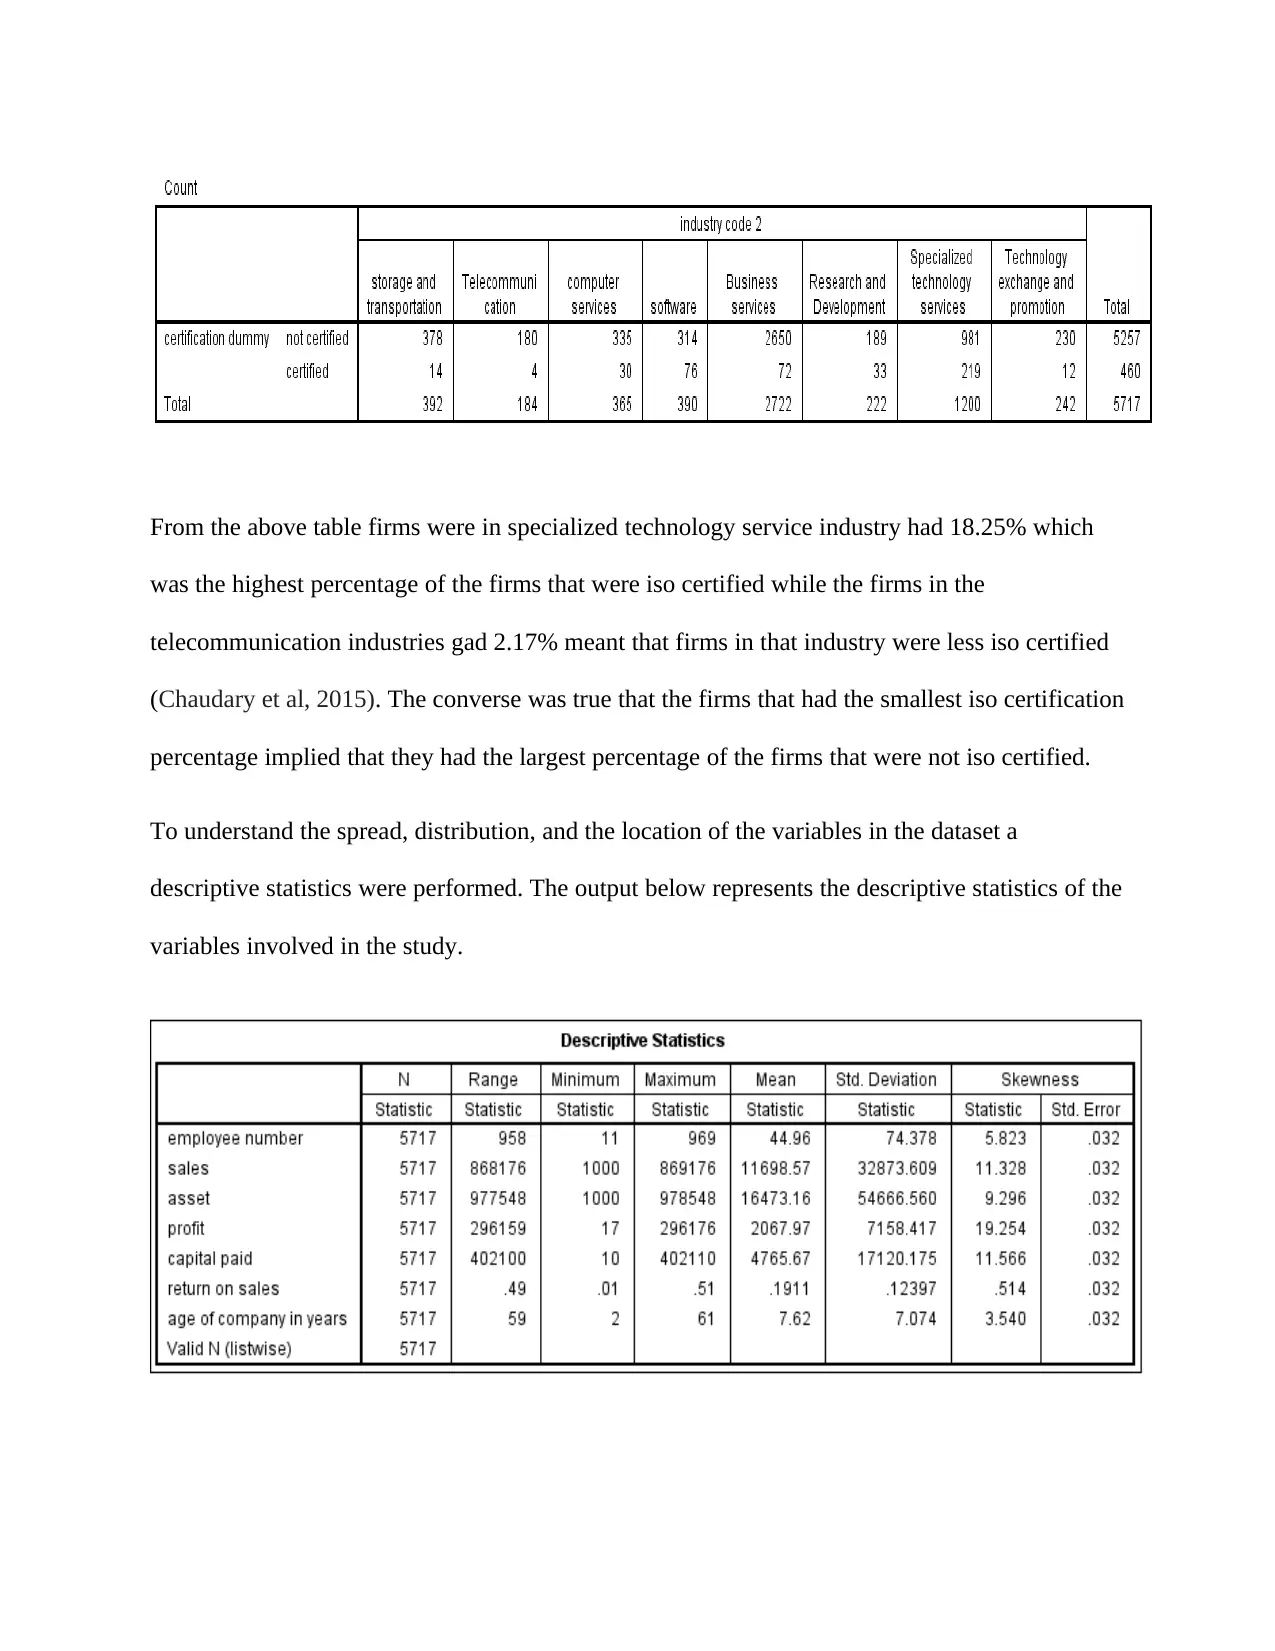
From the above table firms were in specialized technology service industry had 18.25% which
was the highest percentage of the firms that were iso certified while the firms in the
telecommunication industries gad 2.17% meant that firms in that industry were less iso certified
(Chaudary et al, 2015). The converse was true that the firms that had the smallest iso certification
percentage implied that they had the largest percentage of the firms that were not iso certified.
To understand the spread, distribution, and the location of the variables in the dataset a
descriptive statistics were performed. The output below represents the descriptive statistics of the
variables involved in the study.
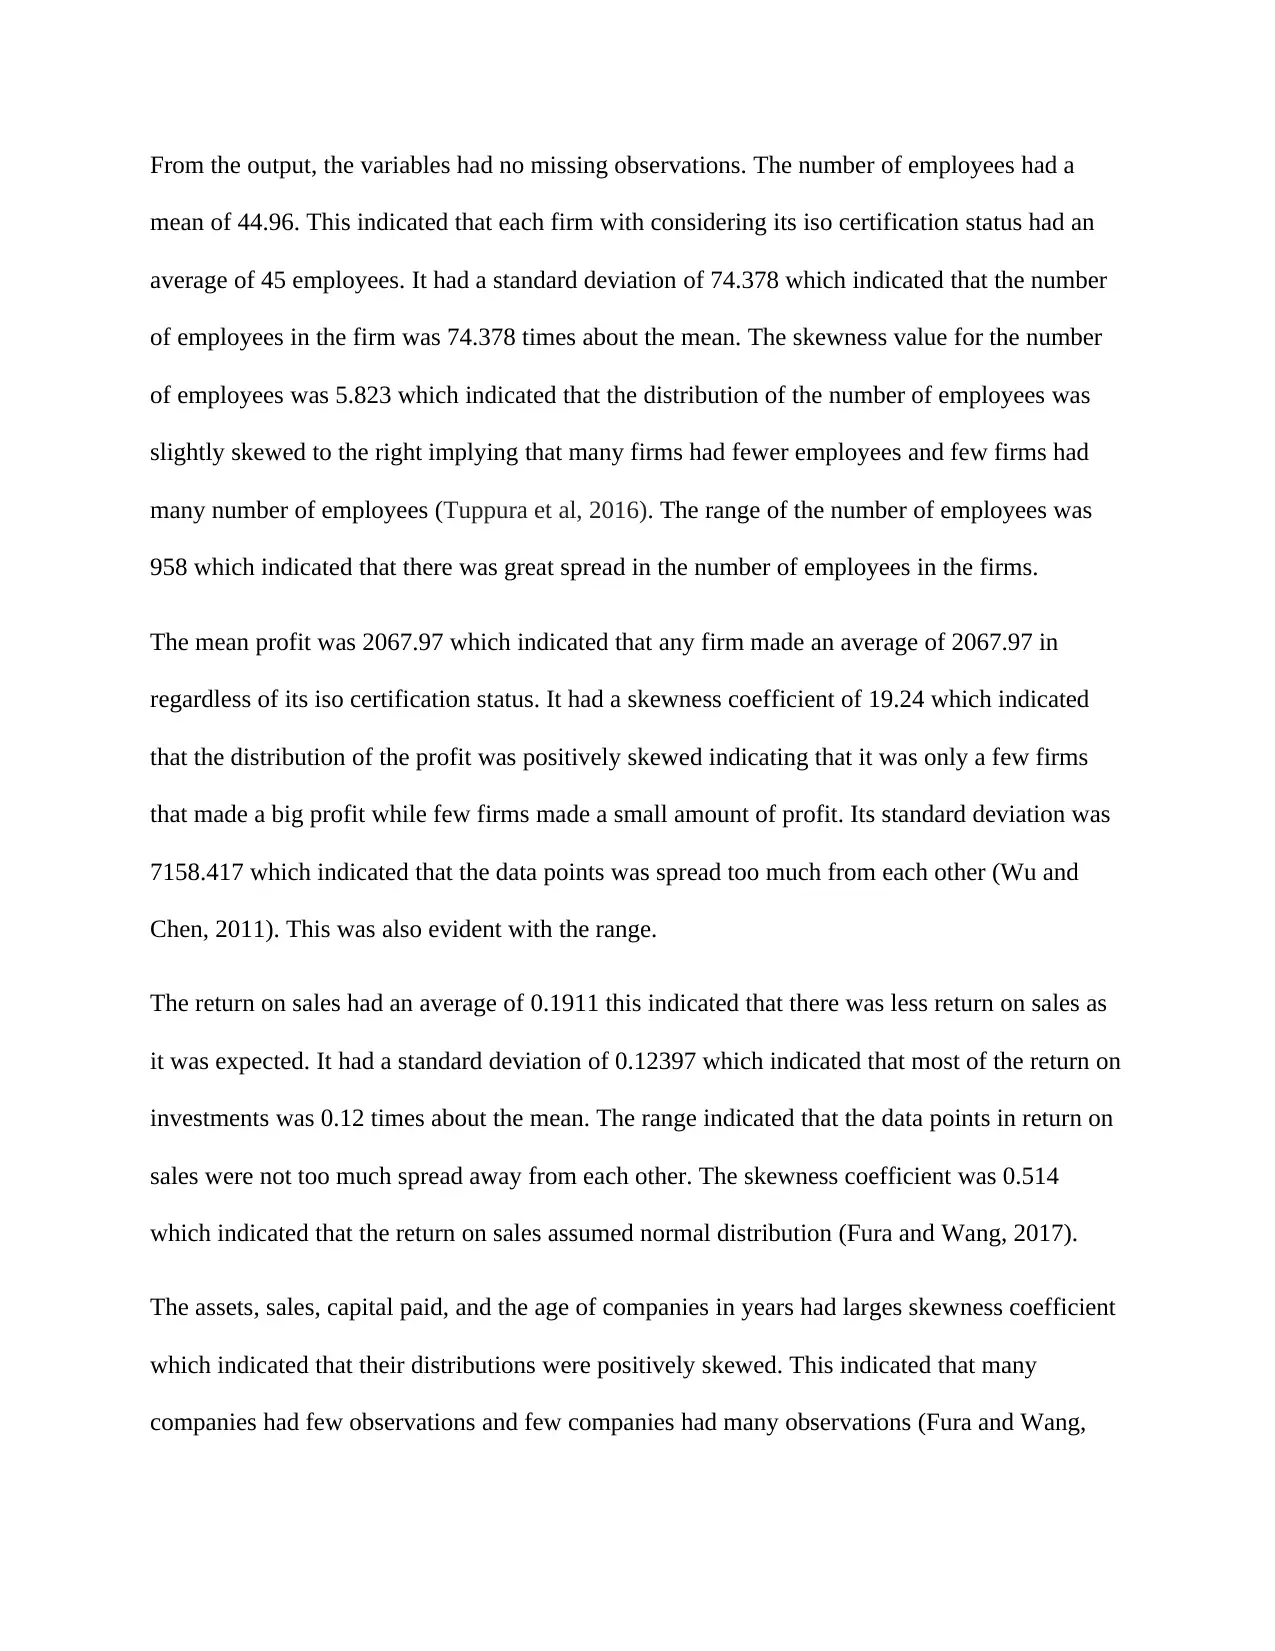
From the output, the variables had no missing observations. The number of employees had a
mean of 44.96. This indicated that each firm with considering its iso certification status had an
average of 45 employees. It had a standard deviation of 74.378 which indicated that the number
of employees in the firm was 74.378 times about the mean. The skewness value for the number
of employees was 5.823 which indicated that the distribution of the number of employees was
slightly skewed to the right implying that many firms had fewer employees and few firms had
many number of employees (Tuppura et al, 2016). The range of the number of employees was
958 which indicated that there was great spread in the number of employees in the firms.
The mean profit was 2067.97 which indicated that any firm made an average of 2067.97 in
regardless of its iso certification status. It had a skewness coefficient of 19.24 which indicated
that the distribution of the profit was positively skewed indicating that it was only a few firms
that made a big profit while few firms made a small amount of profit. Its standard deviation was
7158.417 which indicated that the data points was spread too much from each other (Wu and
Chen, 2011). This was also evident with the range.
The return on sales had an average of 0.1911 this indicated that there was less return on sales as
it was expected. It had a standard deviation of 0.12397 which indicated that most of the return on
investments was 0.12 times about the mean. The range indicated that the data points in return on
sales were not too much spread away from each other. The skewness coefficient was 0.514
which indicated that the return on sales assumed normal distribution (Fura and Wang, 2017).
The assets, sales, capital paid, and the age of companies in years had larges skewness coefficient
which indicated that their distributions were positively skewed. This indicated that many
companies had few observations and few companies had many observations (Fura and Wang,
⊘ This is a preview!⊘
Do you want full access?
Subscribe today to unlock all pages.
Trusted by 1+ million students worldwide
2017). The variables also had large values of the range that indicated that their data points were
spread too much away from each other.
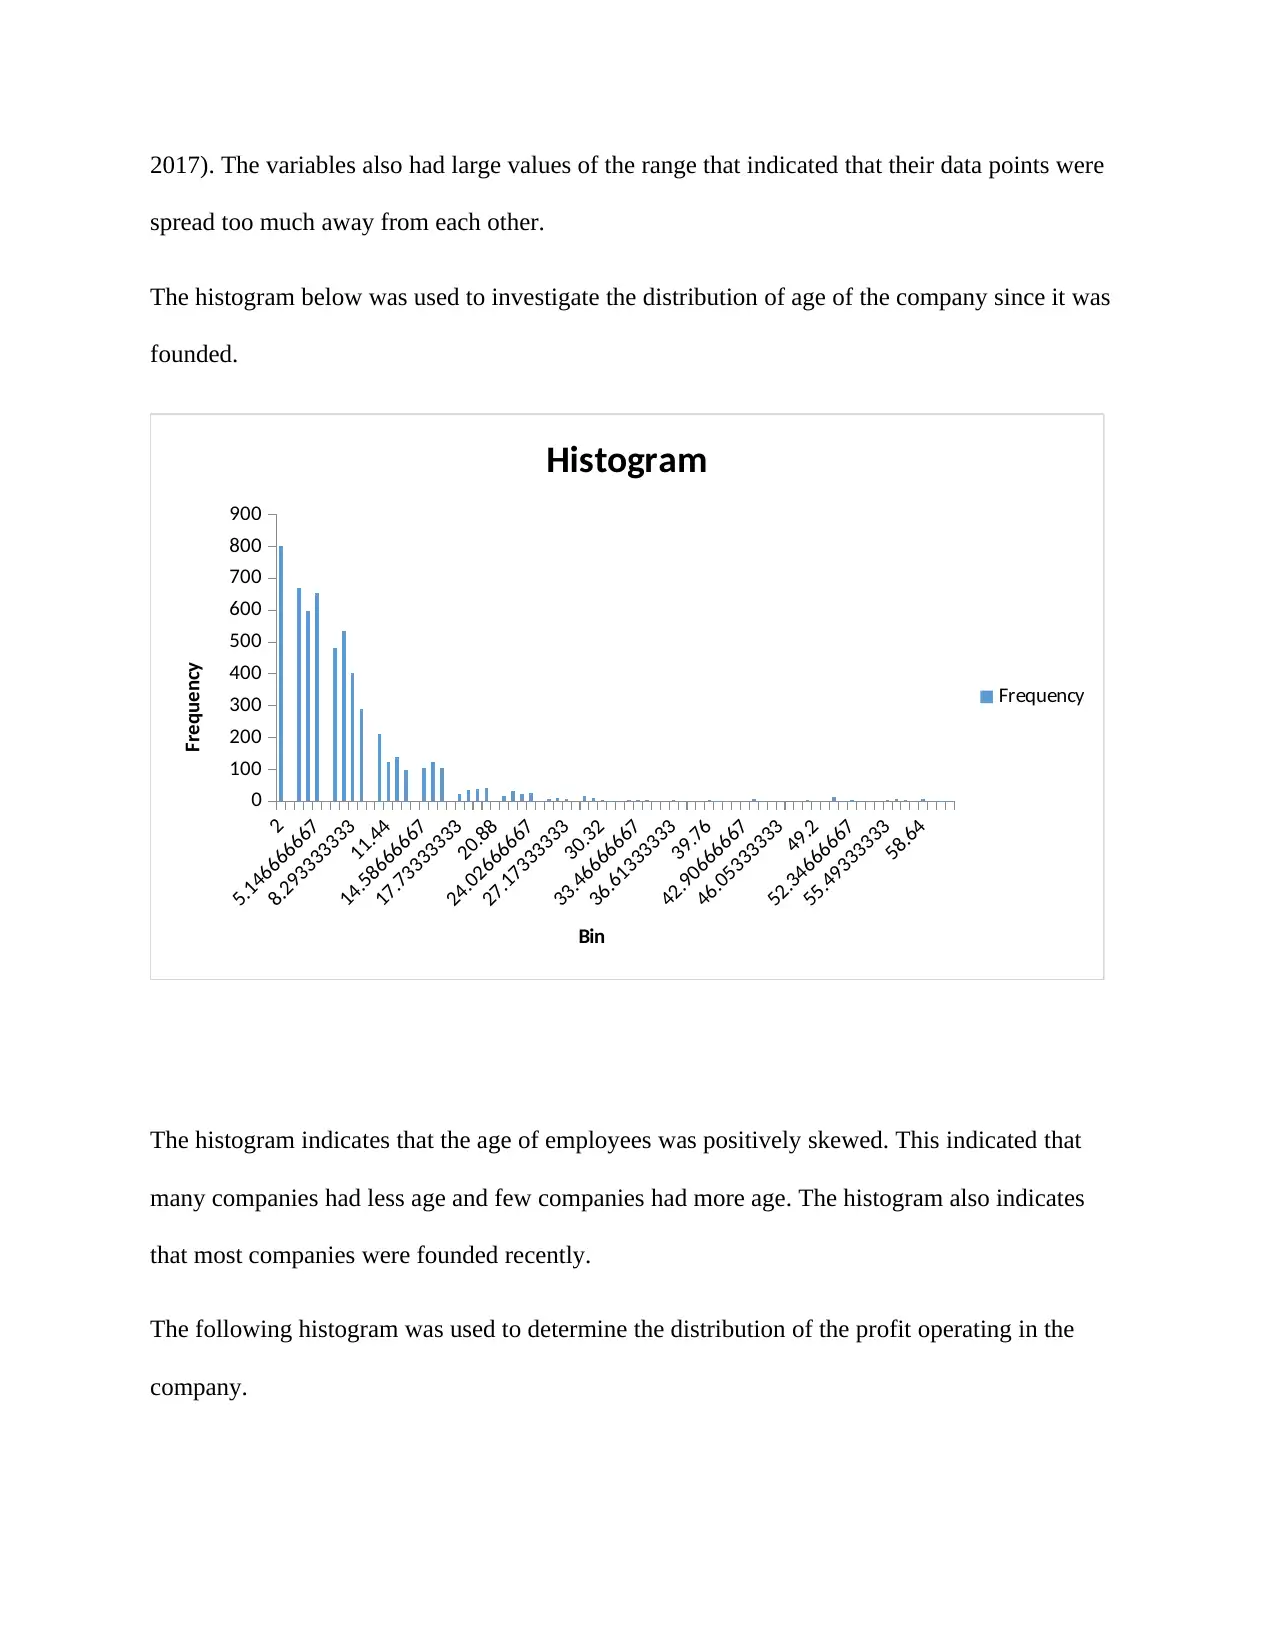
The histogram below was used to investigate the distribution of age of the company since it was
founded.
2
5.146666667
8.293333333
11.44
14.58666667
17.73333333
20.88
24.02666667
27.17333333
30.32
33.46666667
36.61333333
39.76
42.90666667
46.05333333
49.2
52.34666667
55.49333333
58.64
0
100
200
300
400
500
600
700
800
900
Histogram
Frequency
Bin
Frequency
The histogram indicates that the age of employees was positively skewed. This indicated that
many companies had less age and few companies had more age. The histogram also indicates
that most companies were founded recently.
The following histogram was used to determine the distribution of the profit operating in the
company.
spread too much away from each other.
The histogram below was used to investigate the distribution of age of the company since it was
founded.
2
5.146666667
8.293333333
11.44
14.58666667
17.73333333
20.88
24.02666667
27.17333333
30.32
33.46666667
36.61333333
39.76
42.90666667
46.05333333
49.2
52.34666667
55.49333333
58.64
0
100
200
300
400
500
600
700
800
900
Histogram
Frequency
Bin
Frequency
The histogram indicates that the age of employees was positively skewed. This indicated that
many companies had less age and few companies had more age. The histogram also indicates
that most companies were founded recently.
The following histogram was used to determine the distribution of the profit operating in the
company.
Paraphrase This Document
Need a fresh take? Get an instant paraphrase of this document with our AI Paraphraser
482 522 540 564 790 1757 More
0
500
1000
1500
2000
2500
Histogram for profit operating
in a company
Frequency
bin
Frequency
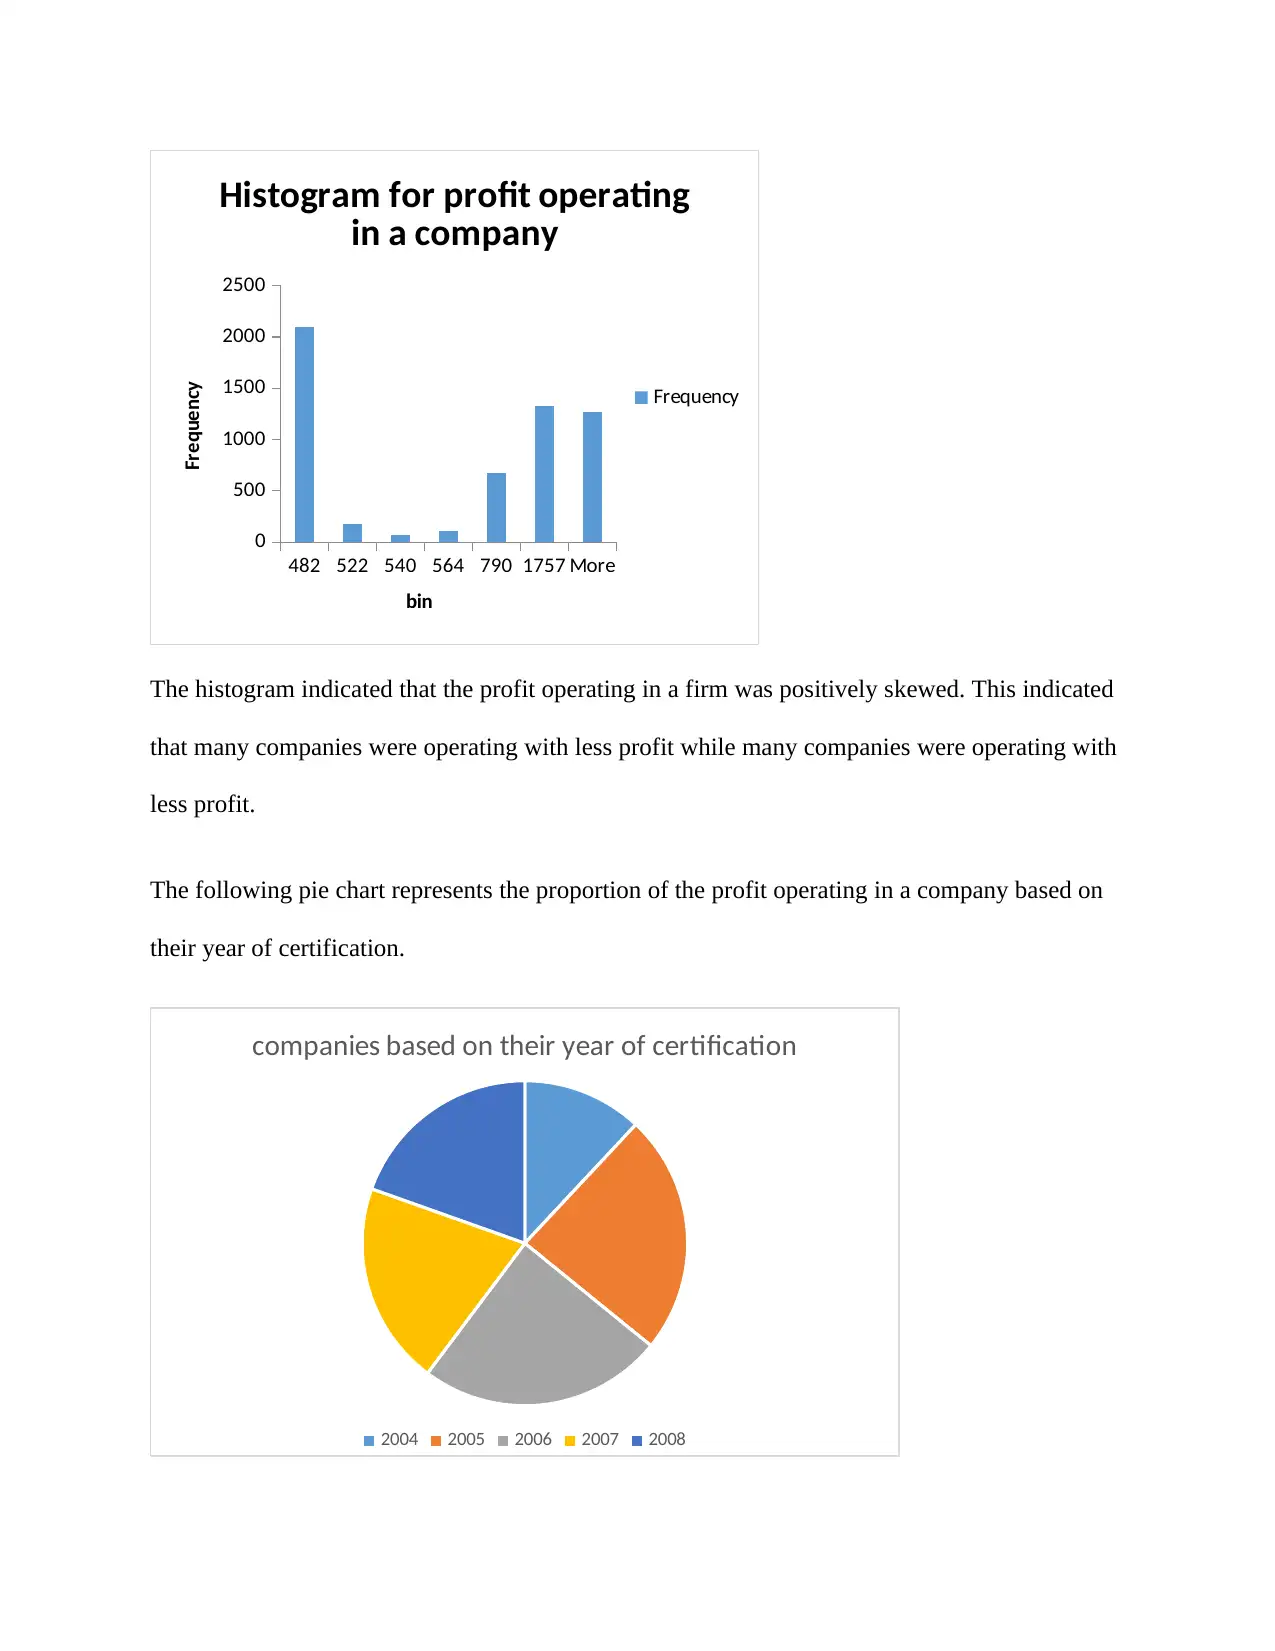
The histogram indicated that the profit operating in a firm was positively skewed. This indicated
that many companies were operating with less profit while many companies were operating with
less profit.
The following pie chart represents the proportion of the profit operating in a company based on
their year of certification.
companies based on their year of certification
2004 2005 2006 2007 2008
0
500
1000
1500
2000
2500
Histogram for profit operating
in a company
Frequency
bin
Frequency
The histogram indicated that the profit operating in a firm was positively skewed. This indicated
that many companies were operating with less profit while many companies were operating with
less profit.
The following pie chart represents the proportion of the profit operating in a company based on
their year of certification.
companies based on their year of certification
2004 2005 2006 2007 2008
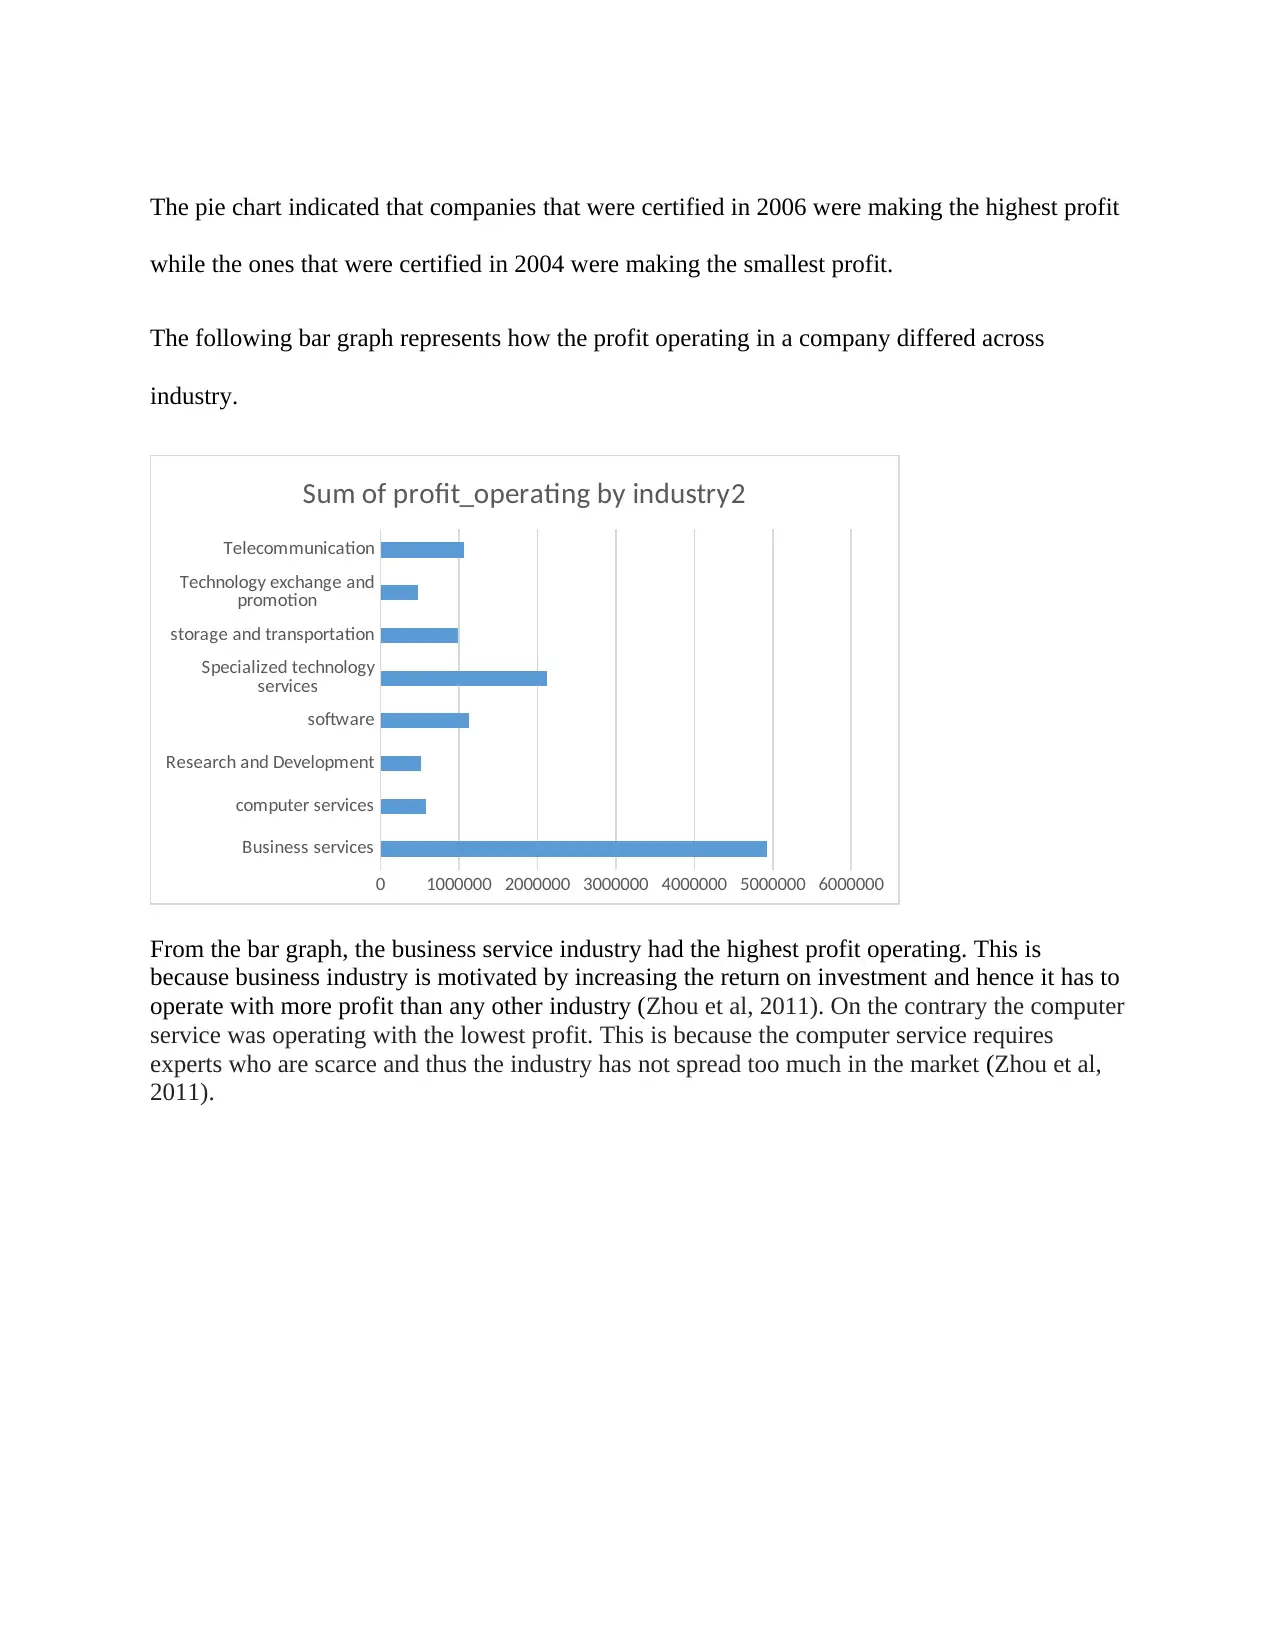
The pie chart indicated that companies that were certified in 2006 were making the highest profit
while the ones that were certified in 2004 were making the smallest profit.
The following bar graph represents how the profit operating in a company differed across
industry.
Business services
computer services
Research and Development
software
Specialized technology
services
storage and transportation
Technology exchange and
promotion
Telecommunication
0 1000000 2000000 3000000 4000000 5000000 6000000
Sum of profit_operating by industry2
From the bar graph, the business service industry had the highest profit operating. This is
because business industry is motivated by increasing the return on investment and hence it has to
operate with more profit than any other industry (Zhou et al, 2011). On the contrary the computer
service was operating with the lowest profit. This is because the computer service requires
experts who are scarce and thus the industry has not spread too much in the market (Zhou et al,
2011).
⊘ This is a preview!⊘
Do you want full access?
Subscribe today to unlock all pages.
Trusted by 1+ million students worldwide
6 270 534 798 106213261590185421182382264629103174343837023966423044944758502252865550
0
50000
100000
150000
200000
250000
300000
350000
400000
450000
relationship between capital from state and capital from
overseas
kstate koversea
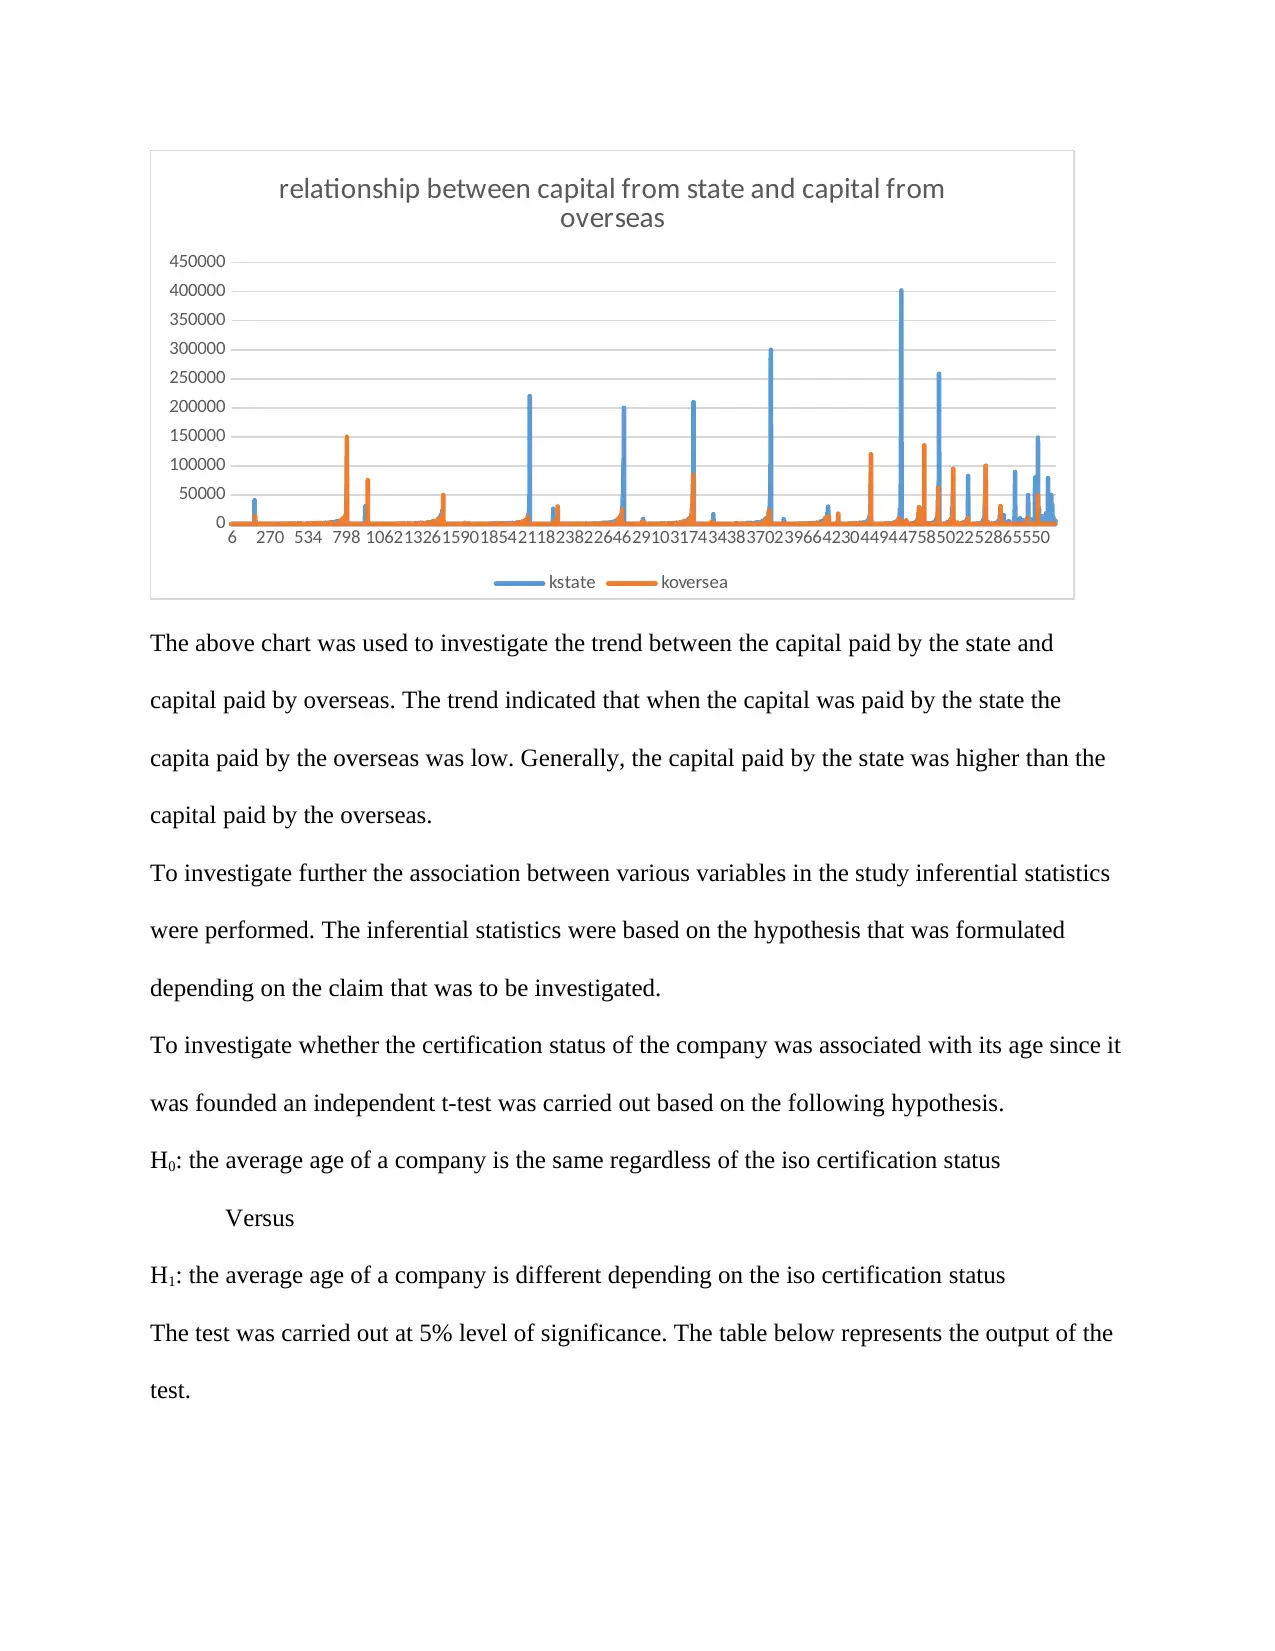
The above chart was used to investigate the trend between the capital paid by the state and
capital paid by overseas. The trend indicated that when the capital was paid by the state the
capita paid by the overseas was low. Generally, the capital paid by the state was higher than the
capital paid by the overseas.
To investigate further the association between various variables in the study inferential statistics
were performed. The inferential statistics were based on the hypothesis that was formulated
depending on the claim that was to be investigated.
To investigate whether the certification status of the company was associated with its age since it
was founded an independent t-test was carried out based on the following hypothesis.
H0: the average age of a company is the same regardless of the iso certification status
Versus
H1: the average age of a company is different depending on the iso certification status
The test was carried out at 5% level of significance. The table below represents the output of the
test.
0
50000
100000
150000
200000
250000
300000
350000
400000
450000
relationship between capital from state and capital from
overseas
kstate koversea
The above chart was used to investigate the trend between the capital paid by the state and
capital paid by overseas. The trend indicated that when the capital was paid by the state the
capita paid by the overseas was low. Generally, the capital paid by the state was higher than the
capital paid by the overseas.
To investigate further the association between various variables in the study inferential statistics
were performed. The inferential statistics were based on the hypothesis that was formulated
depending on the claim that was to be investigated.
To investigate whether the certification status of the company was associated with its age since it
was founded an independent t-test was carried out based on the following hypothesis.
H0: the average age of a company is the same regardless of the iso certification status
Versus
H1: the average age of a company is different depending on the iso certification status
The test was carried out at 5% level of significance. The table below represents the output of the
test.
Paraphrase This Document
Need a fresh take? Get an instant paraphrase of this document with our AI Paraphraser
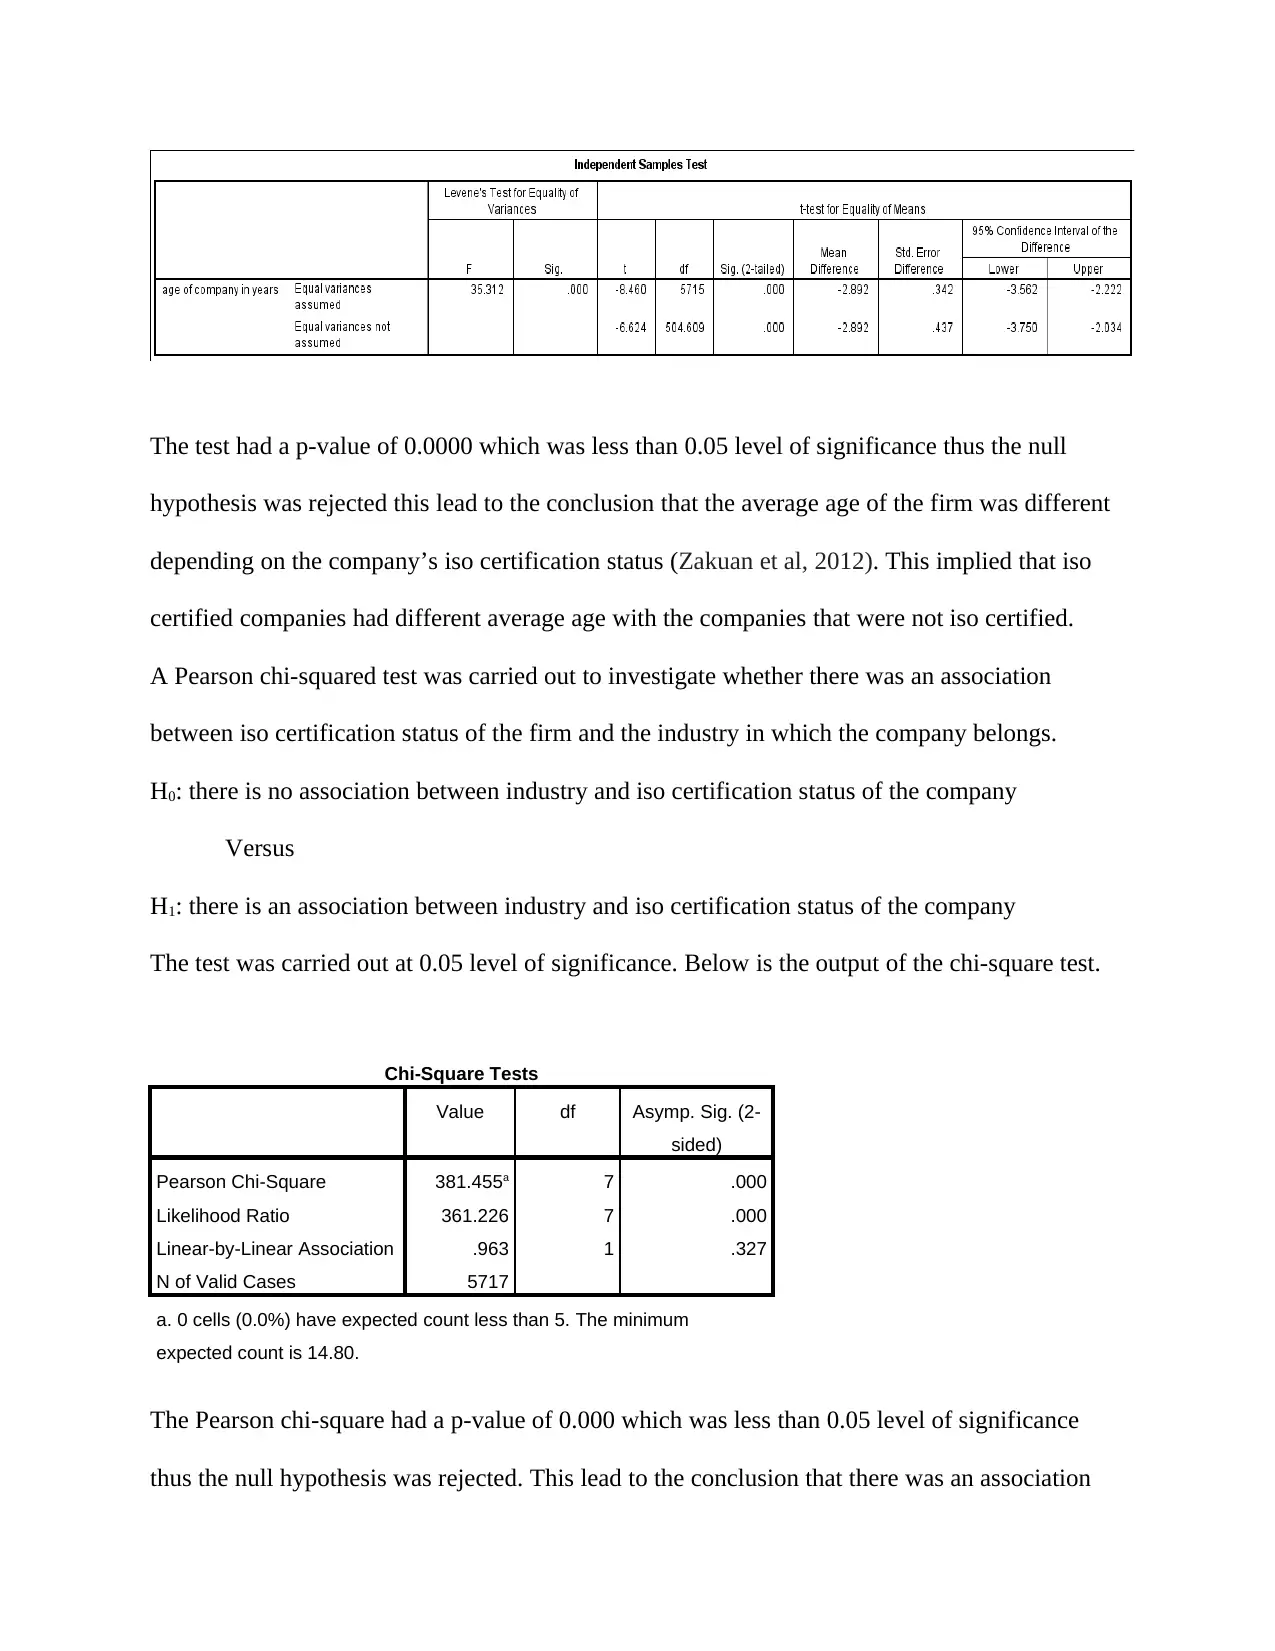
The test had a p-value of 0.0000 which was less than 0.05 level of significance thus the null
hypothesis was rejected this lead to the conclusion that the average age of the firm was different
depending on the company’s iso certification status (Zakuan et al, 2012). This implied that iso
certified companies had different average age with the companies that were not iso certified.
A Pearson chi-squared test was carried out to investigate whether there was an association
between iso certification status of the firm and the industry in which the company belongs.
H0: there is no association between industry and iso certification status of the company
Versus
H1: there is an association between industry and iso certification status of the company
The test was carried out at 0.05 level of significance. Below is the output of the chi-square test.
Chi-Square Tests
Value df Asymp. Sig. (2-
sided)
Pearson Chi-Square 381.455a 7 .000
Likelihood Ratio 361.226 7 .000
Linear-by-Linear Association .963 1 .327
N of Valid Cases 5717
a. 0 cells (0.0%) have expected count less than 5. The minimum
expected count is 14.80.
The Pearson chi-square had a p-value of 0.000 which was less than 0.05 level of significance
thus the null hypothesis was rejected. This lead to the conclusion that there was an association
between the iso certification status of the firm and the industry type which the company
belonged to (Massoud et al, 2011).
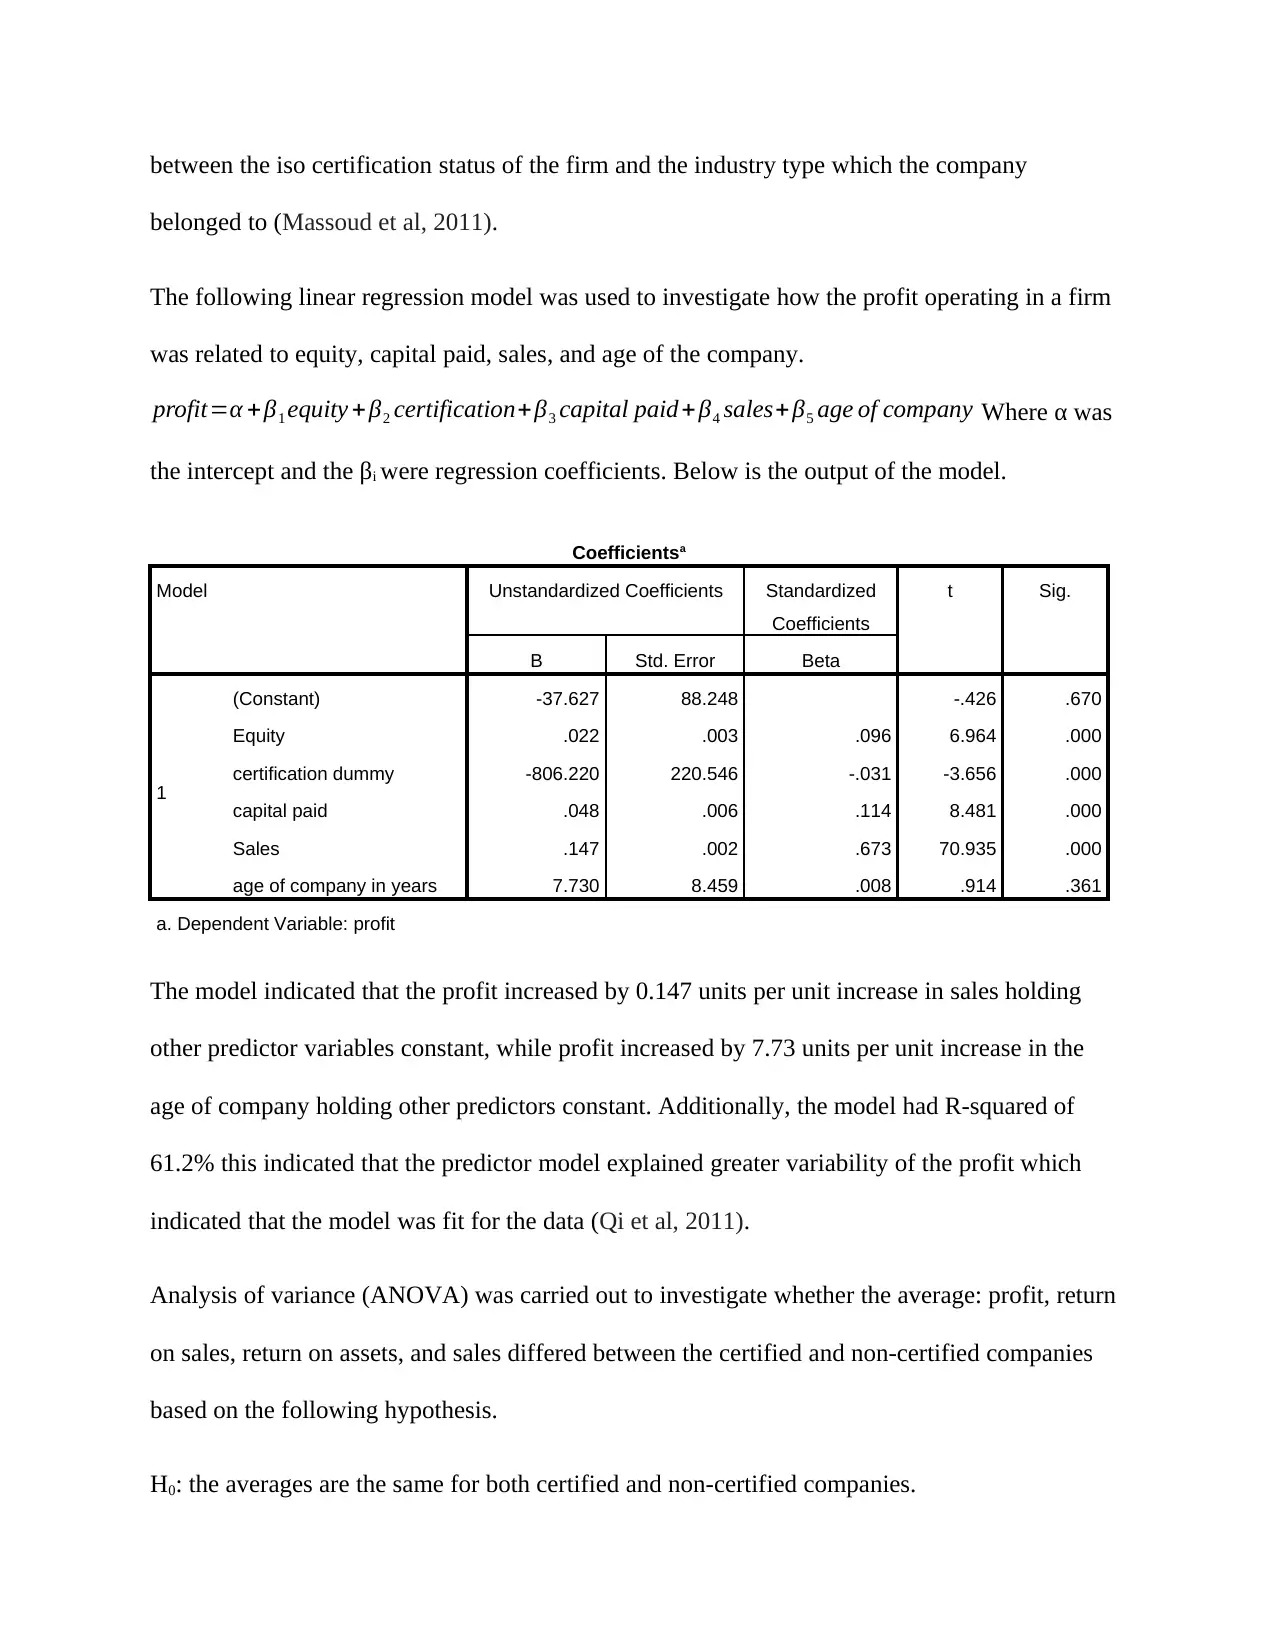
The following linear regression model was used to investigate how the profit operating in a firm
was related to equity, capital paid, sales, and age of the company.
profit=α + β1 equity + β2 certification+β3 capital paid + β4 sales+β5 age of company Where α was
the intercept and the βi were regression coefficients. Below is the output of the model.
Coefficientsa
Model Unstandardized Coefficients Standardized
Coefficients
t Sig.
B Std. Error Beta
1
(Constant) -37.627 88.248 -.426 .670
Equity .022 .003 .096 6.964 .000
certification dummy -806.220 220.546 -.031 -3.656 .000
capital paid .048 .006 .114 8.481 .000
Sales .147 .002 .673 70.935 .000
age of company in years 7.730 8.459 .008 .914 .361
a. Dependent Variable: profit
The model indicated that the profit increased by 0.147 units per unit increase in sales holding
other predictor variables constant, while profit increased by 7.73 units per unit increase in the
age of company holding other predictors constant. Additionally, the model had R-squared of
61.2% this indicated that the predictor model explained greater variability of the profit which
indicated that the model was fit for the data (Qi et al, 2011).
Analysis of variance (ANOVA) was carried out to investigate whether the average: profit, return
on sales, return on assets, and sales differed between the certified and non-certified companies
based on the following hypothesis.
H0: the averages are the same for both certified and non-certified companies.
belonged to (Massoud et al, 2011).
The following linear regression model was used to investigate how the profit operating in a firm
was related to equity, capital paid, sales, and age of the company.
profit=α + β1 equity + β2 certification+β3 capital paid + β4 sales+β5 age of company Where α was
the intercept and the βi were regression coefficients. Below is the output of the model.
Coefficientsa
Model Unstandardized Coefficients Standardized
Coefficients
t Sig.
B Std. Error Beta
1
(Constant) -37.627 88.248 -.426 .670
Equity .022 .003 .096 6.964 .000
certification dummy -806.220 220.546 -.031 -3.656 .000
capital paid .048 .006 .114 8.481 .000
Sales .147 .002 .673 70.935 .000
age of company in years 7.730 8.459 .008 .914 .361
a. Dependent Variable: profit
The model indicated that the profit increased by 0.147 units per unit increase in sales holding
other predictor variables constant, while profit increased by 7.73 units per unit increase in the
age of company holding other predictors constant. Additionally, the model had R-squared of
61.2% this indicated that the predictor model explained greater variability of the profit which
indicated that the model was fit for the data (Qi et al, 2011).
Analysis of variance (ANOVA) was carried out to investigate whether the average: profit, return
on sales, return on assets, and sales differed between the certified and non-certified companies
based on the following hypothesis.
H0: the averages are the same for both certified and non-certified companies.
⊘ This is a preview!⊘
Do you want full access?
Subscribe today to unlock all pages.
Trusted by 1+ million students worldwide
1 out of 17
Related Documents


Your All-in-One AI-Powered Toolkit for Academic Success.
+13062052269
info@desklib.com
Available 24*7 on WhatsApp / Email
![[object Object]](/_next/static/media/star-bottom.7253800d.svg)
Unlock your academic potential
Copyright © 2020–2026 A2Z Services. All Rights Reserved. Developed and managed by ZUCOL.