ISY2004 Project Management: Time Sheet System Implementation Plan
VerifiedAdded on 2023/06/04
|15
|3110
|82
Report
AI Summary
This document presents the second part of a project plan focused on the implementation of a Time Sheet System within Time Inc., an international software firm. It includes a Gantt chart, a network diagram with a critical path, project milestones, a resources table, a project budget, a RACI table, potential risks, and a probability/impact matrix of the risks. The project aims to research and recommend the best Time Sheet System to meet the needs of the software centers, focusing on capturing data related to Cost of Quality and Resource Optimization. The plan details various tasks, resources, and potential risks associated with the implementation, providing a comprehensive overview of the project's execution strategy. The document uses MS Project to create the Gantt chart and budget.
Project Plan Part 2
[Name]
[Institution]
[Name]
[Institution]
Paraphrase This Document
Need a fresh take? Get an instant paraphrase of this document with our AI Paraphraser
Table of Contents
1.0 Introduction and Background of the project...................................................................................3
2.0 Gantt chart.......................................................................................................................................3
3.0 Network Diagram.............................................................................................................................5
4.0 Project milestones...........................................................................................................................6
5.0 Resources table...............................................................................................................................7
6.0 Project budget.................................................................................................................................7
7.0 RACI Table........................................................................................................................................9
8.0 Potential Risks................................................................................................................................11
9.0 Probability/ Impact Matrix.............................................................................................................13
Conclusion.................................................................................................................................................14
1.0 Introduction and Background of the project
The Steering committee of Time Inc.- an software International firm, with a footprint in 15
countries - has taken a decision to implement Time Sheets in all of its software centres. The goal
is to enable the committee gain insight into how time is utilized across projects in various
software centers. Primarily, the Committee intends to capture data relating to Cost of Quality and
Resource Optimisation; enabling the committee to assimilate Project Management Excellence
throughout the firm. The company has the intention of implementing a Time Sheet System that
integrates with an Enterprise Project Management System; giving the management visibility into
the projects across all the centers.
This project aims to research and recommend the best Time Sheet System to meet all the needs
of the software centers. This project document presents a Gantt chart, a Network Diagram with a
critical path, project Milestones, resources, a project budget, RACI table, potential risks and a
probability / impact matrix of the risks.
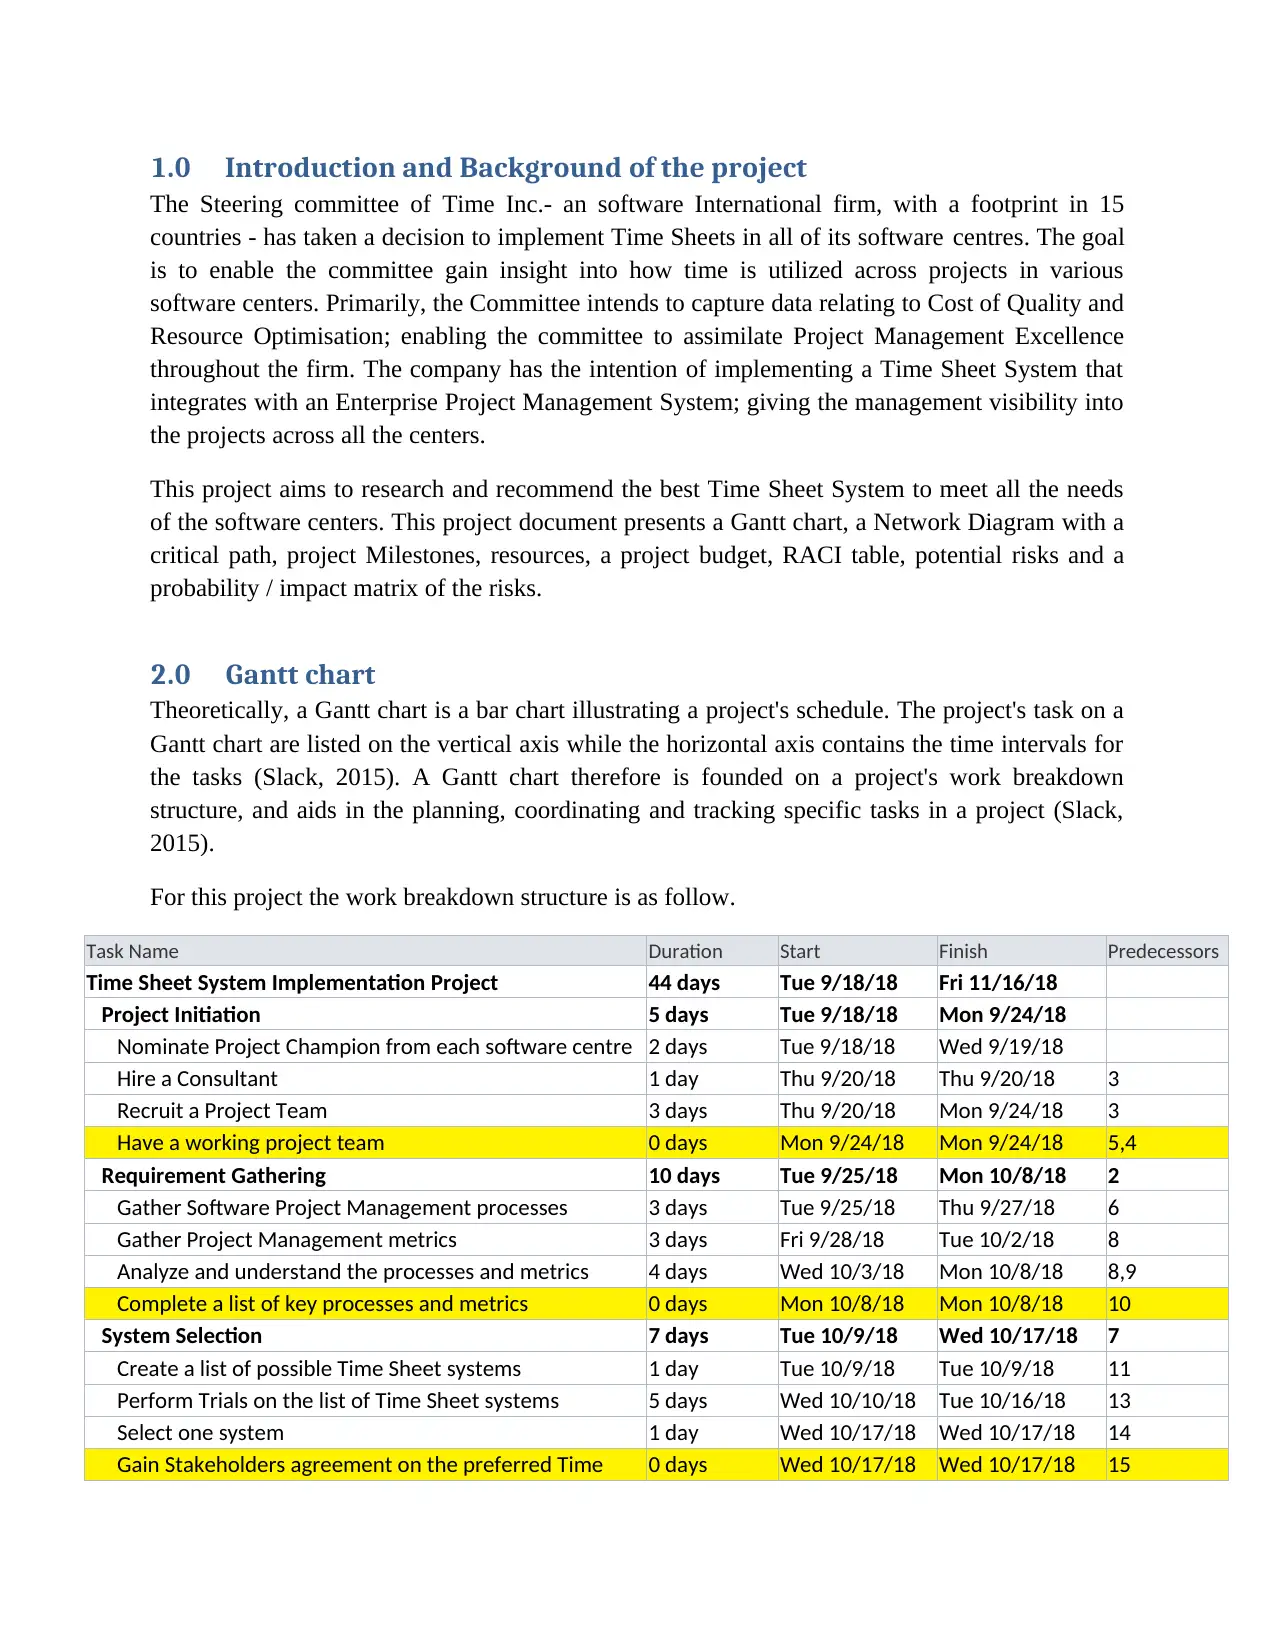
2.0 Gantt chart
Theoretically, a Gantt chart is a bar chart illustrating a project's schedule. The project's task on a
Gantt chart are listed on the vertical axis while the horizontal axis contains the time intervals for
the tasks (Slack, 2015). A Gantt chart therefore is founded on a project's work breakdown
structure, and aids in the planning, coordinating and tracking specific tasks in a project (Slack,
2015).
For this project the work breakdown structure is as follow.
Task Name Duration Start Finish Predecessors
Time Sheet System Implementation Project 44 days Tue 9/18/18 Fri 11/16/18
Project Initiation 5 days Tue 9/18/18 Mon 9/24/18
Nominate Project Champion from each software centre 2 days Tue 9/18/18 Wed 9/19/18
Hire a Consultant 1 day Thu 9/20/18 Thu 9/20/18 3
Recruit a Project Team 3 days Thu 9/20/18 Mon 9/24/18 3
Have a working project team 0 days Mon 9/24/18 Mon 9/24/18 5,4
Requirement Gathering 10 days Tue 9/25/18 Mon 10/8/18 2
Gather Software Project Management processes 3 days Tue 9/25/18 Thu 9/27/18 6
Gather Project Management metrics 3 days Fri 9/28/18 Tue 10/2/18 8
Analyze and understand the processes and metrics 4 days Wed 10/3/18 Mon 10/8/18 8,9
Complete a list of key processes and metrics 0 days Mon 10/8/18 Mon 10/8/18 10
System Selection 7 days Tue 10/9/18 Wed 10/17/18 7
Create a list of possible Time Sheet systems 1 day Tue 10/9/18 Tue 10/9/18 11
Perform Trials on the list of Time Sheet systems 5 days Wed 10/10/18 Tue 10/16/18 13
Select one system 1 day Wed 10/17/18 Wed 10/17/18 14
Gain Stakeholders agreement on the preferred Time 0 days Wed 10/17/18 Wed 10/17/18 15
The Steering committee of Time Inc.- an software International firm, with a footprint in 15
countries - has taken a decision to implement Time Sheets in all of its software centres. The goal
is to enable the committee gain insight into how time is utilized across projects in various
software centers. Primarily, the Committee intends to capture data relating to Cost of Quality and
Resource Optimisation; enabling the committee to assimilate Project Management Excellence
throughout the firm. The company has the intention of implementing a Time Sheet System that
integrates with an Enterprise Project Management System; giving the management visibility into
the projects across all the centers.
This project aims to research and recommend the best Time Sheet System to meet all the needs
of the software centers. This project document presents a Gantt chart, a Network Diagram with a
critical path, project Milestones, resources, a project budget, RACI table, potential risks and a
probability / impact matrix of the risks.
2.0 Gantt chart
Theoretically, a Gantt chart is a bar chart illustrating a project's schedule. The project's task on a
Gantt chart are listed on the vertical axis while the horizontal axis contains the time intervals for
the tasks (Slack, 2015). A Gantt chart therefore is founded on a project's work breakdown
structure, and aids in the planning, coordinating and tracking specific tasks in a project (Slack,
2015).
For this project the work breakdown structure is as follow.
Task Name Duration Start Finish Predecessors
Time Sheet System Implementation Project 44 days Tue 9/18/18 Fri 11/16/18
Project Initiation 5 days Tue 9/18/18 Mon 9/24/18
Nominate Project Champion from each software centre 2 days Tue 9/18/18 Wed 9/19/18
Hire a Consultant 1 day Thu 9/20/18 Thu 9/20/18 3
Recruit a Project Team 3 days Thu 9/20/18 Mon 9/24/18 3
Have a working project team 0 days Mon 9/24/18 Mon 9/24/18 5,4
Requirement Gathering 10 days Tue 9/25/18 Mon 10/8/18 2
Gather Software Project Management processes 3 days Tue 9/25/18 Thu 9/27/18 6
Gather Project Management metrics 3 days Fri 9/28/18 Tue 10/2/18 8
Analyze and understand the processes and metrics 4 days Wed 10/3/18 Mon 10/8/18 8,9
Complete a list of key processes and metrics 0 days Mon 10/8/18 Mon 10/8/18 10
System Selection 7 days Tue 10/9/18 Wed 10/17/18 7
Create a list of possible Time Sheet systems 1 day Tue 10/9/18 Tue 10/9/18 11
Perform Trials on the list of Time Sheet systems 5 days Wed 10/10/18 Tue 10/16/18 13
Select one system 1 day Wed 10/17/18 Wed 10/17/18 14
Gain Stakeholders agreement on the preferred Time 0 days Wed 10/17/18 Wed 10/17/18 15
⊘ This is a preview!⊘
Do you want full access?
Subscribe today to unlock all pages.
Trusted by 1+ million students worldwide
Sheet system
System Procurement 3 days Thu 10/18/18 Mon 10/22/18 12
Negotiate with the system Vendor 2 days Thu 10/18/18 Fri 10/19/18 16
Procure the licenses 1 day Mon 10/22/18 Mon 10/22/18 18
Have the necessary licenses for the system 0 days Mon 10/22/18 Mon 10/22/18 19
System Implementation 13 days Tue 10/23/18 Thu 11/8/18 17
Deploy required IT infrastructure 4 days Tue 10/23/18 Fri 10/26/18 19
Implement chosen Time Sheet system 2 days Mon 10/29/18 Tue 10/30/18 22
Complete System Implementation 0 days Tue 10/30/18 Tue 10/30/18 23
Measure Return on Investment 2 days Wed 10/31/18 Thu 11/1/18 23
Measure degree of customer satisfaction 3 days Wed 10/31/18 Fri 11/2/18 23
Train users and IT maintenance staff 5 days Wed 10/31/18 Tue 11/6/18 23
Transition the system from special projects to
production 2 days Wed 11/7/18 Thu 11/8/18 25,26,27
Go Live 0 days Thu 11/8/18 Thu 11/8/18 28
Project Closure 6 days Fri 11/9/18 Fri 11/16/18 21
Document Lessons leant 2 days Fri 11/9/18 Mon 11/12/18 28
Identify further project to enhance Project Management
Excellence 2 days Tue 11/13/18 Wed 11/14/18 31
Project Sign-off 1 day Thu 11/15/18 Thu 11/15/18 32
Close the project 1 day Fri 11/16/18 Fri 11/16/18 33
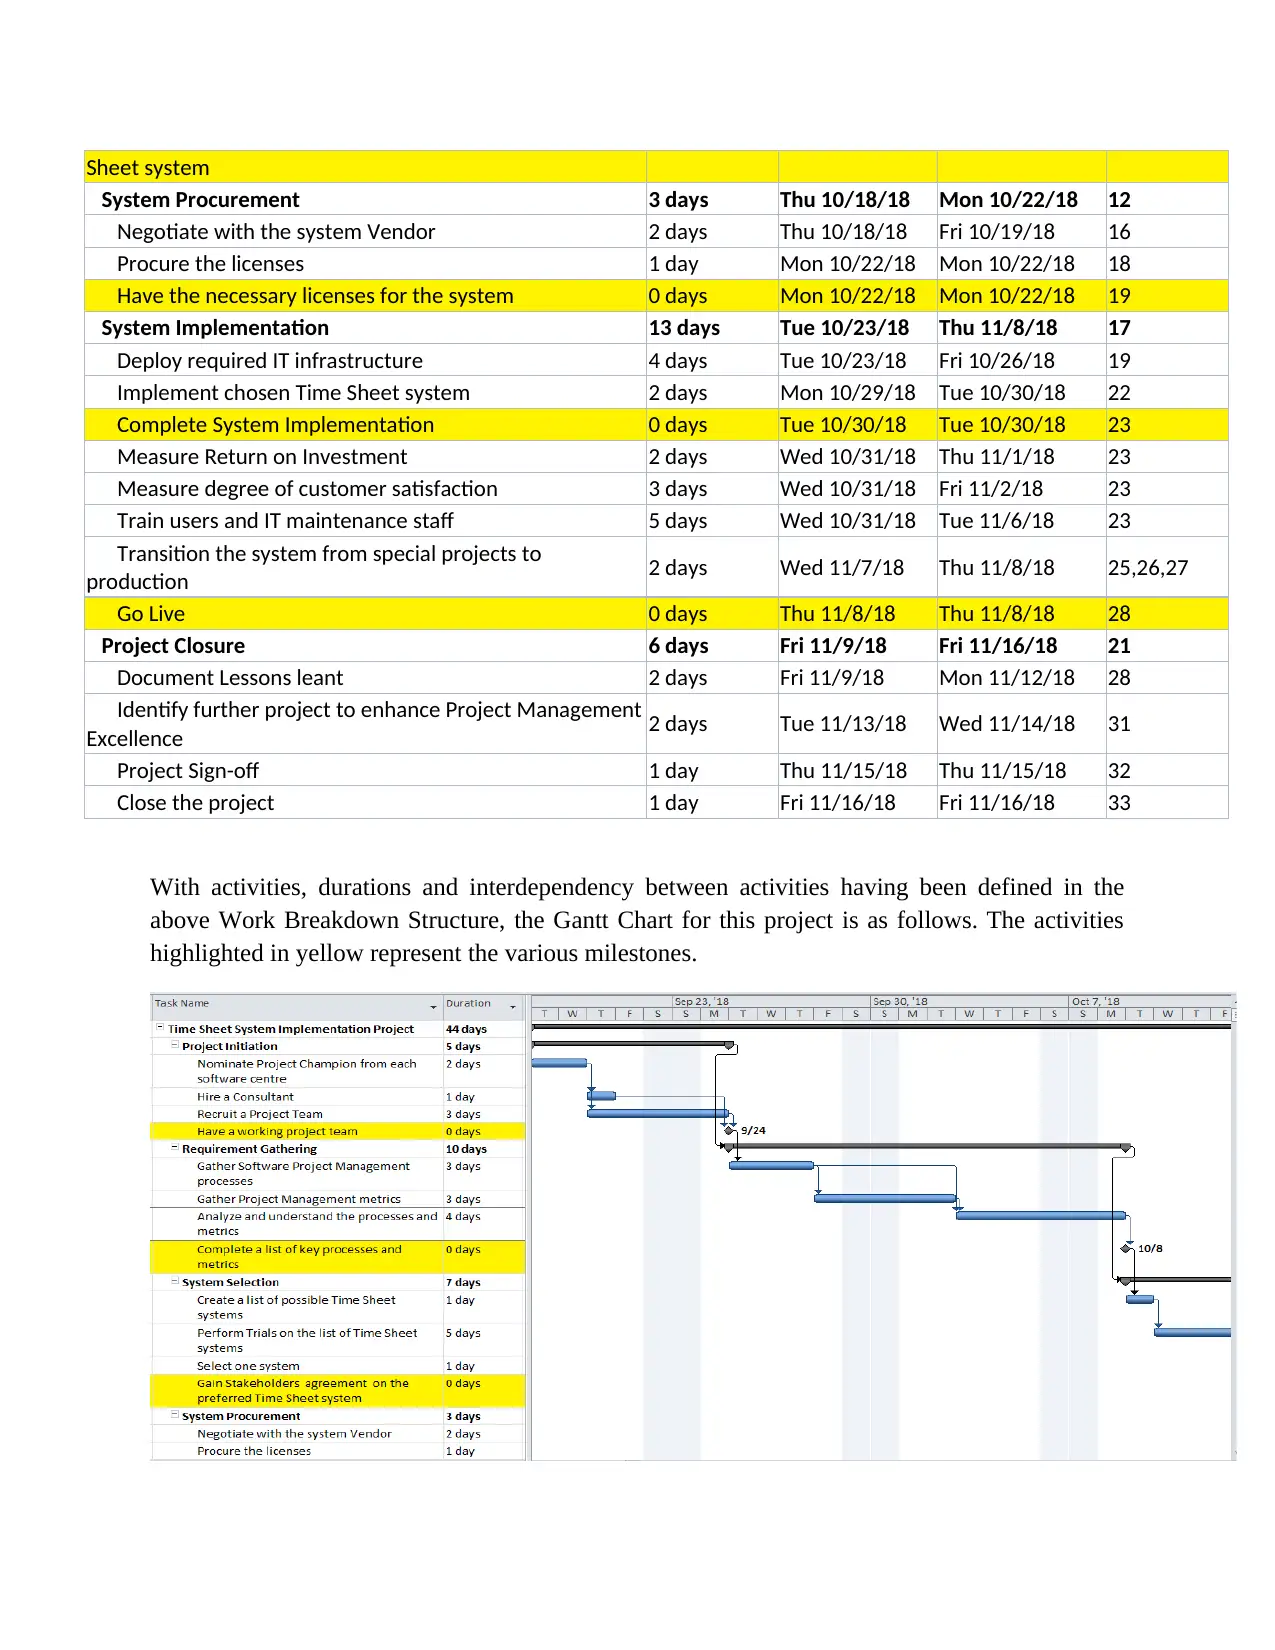
With activities, durations and interdependency between activities having been defined in the
above Work Breakdown Structure, the Gantt Chart for this project is as follows. The activities
highlighted in yellow represent the various milestones.
System Procurement 3 days Thu 10/18/18 Mon 10/22/18 12
Negotiate with the system Vendor 2 days Thu 10/18/18 Fri 10/19/18 16
Procure the licenses 1 day Mon 10/22/18 Mon 10/22/18 18
Have the necessary licenses for the system 0 days Mon 10/22/18 Mon 10/22/18 19
System Implementation 13 days Tue 10/23/18 Thu 11/8/18 17
Deploy required IT infrastructure 4 days Tue 10/23/18 Fri 10/26/18 19
Implement chosen Time Sheet system 2 days Mon 10/29/18 Tue 10/30/18 22
Complete System Implementation 0 days Tue 10/30/18 Tue 10/30/18 23
Measure Return on Investment 2 days Wed 10/31/18 Thu 11/1/18 23
Measure degree of customer satisfaction 3 days Wed 10/31/18 Fri 11/2/18 23
Train users and IT maintenance staff 5 days Wed 10/31/18 Tue 11/6/18 23
Transition the system from special projects to
production 2 days Wed 11/7/18 Thu 11/8/18 25,26,27
Go Live 0 days Thu 11/8/18 Thu 11/8/18 28
Project Closure 6 days Fri 11/9/18 Fri 11/16/18 21
Document Lessons leant 2 days Fri 11/9/18 Mon 11/12/18 28
Identify further project to enhance Project Management
Excellence 2 days Tue 11/13/18 Wed 11/14/18 31
Project Sign-off 1 day Thu 11/15/18 Thu 11/15/18 32
Close the project 1 day Fri 11/16/18 Fri 11/16/18 33
With activities, durations and interdependency between activities having been defined in the
above Work Breakdown Structure, the Gantt Chart for this project is as follows. The activities
highlighted in yellow represent the various milestones.
Paraphrase This Document
Need a fresh take? Get an instant paraphrase of this document with our AI Paraphraser
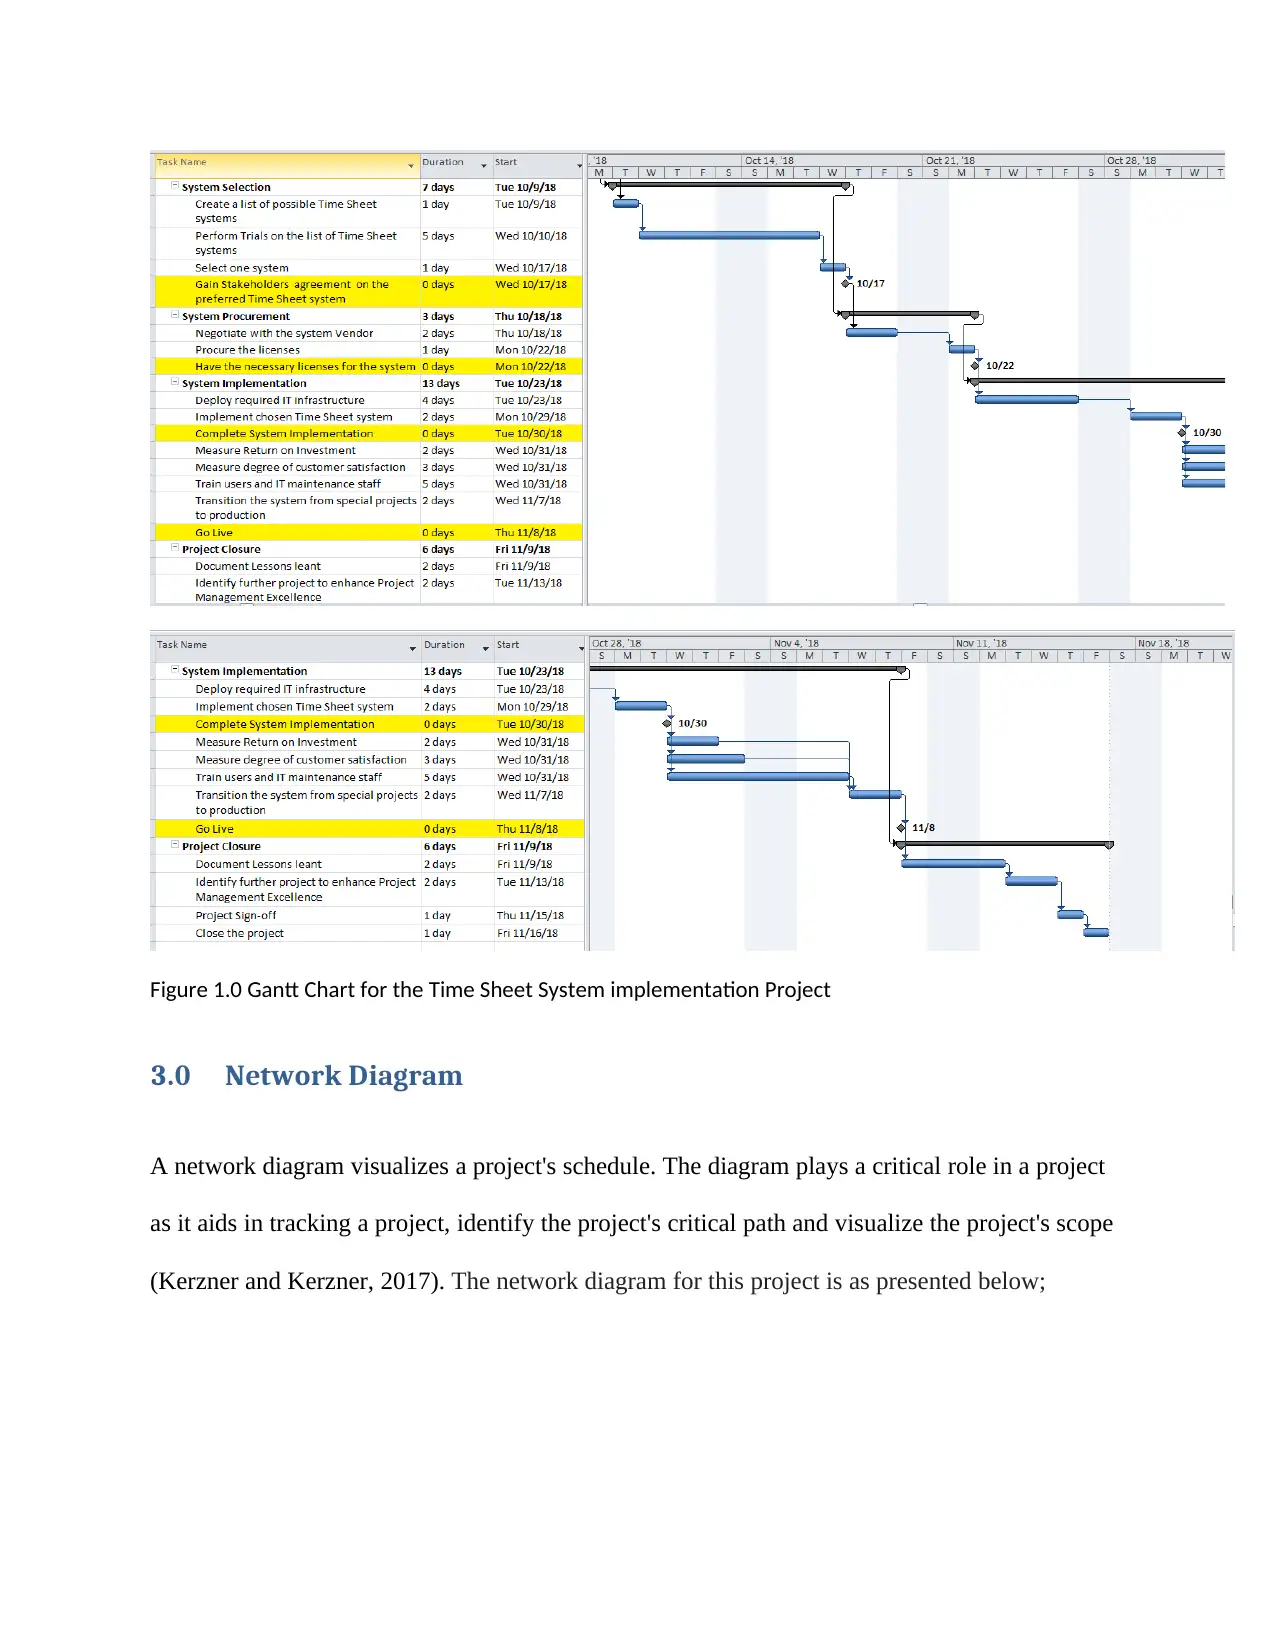
Figure 1.0 Gantt Chart for the Time Sheet System implementation Project
3.0 Network Diagram
A network diagram visualizes a project's schedule. The diagram plays a critical role in a project
as it aids in tracking a project, identify the project's critical path and visualize the project's scope
(Kerzner and Kerzner, 2017). The network diagram for this project is as presented below;
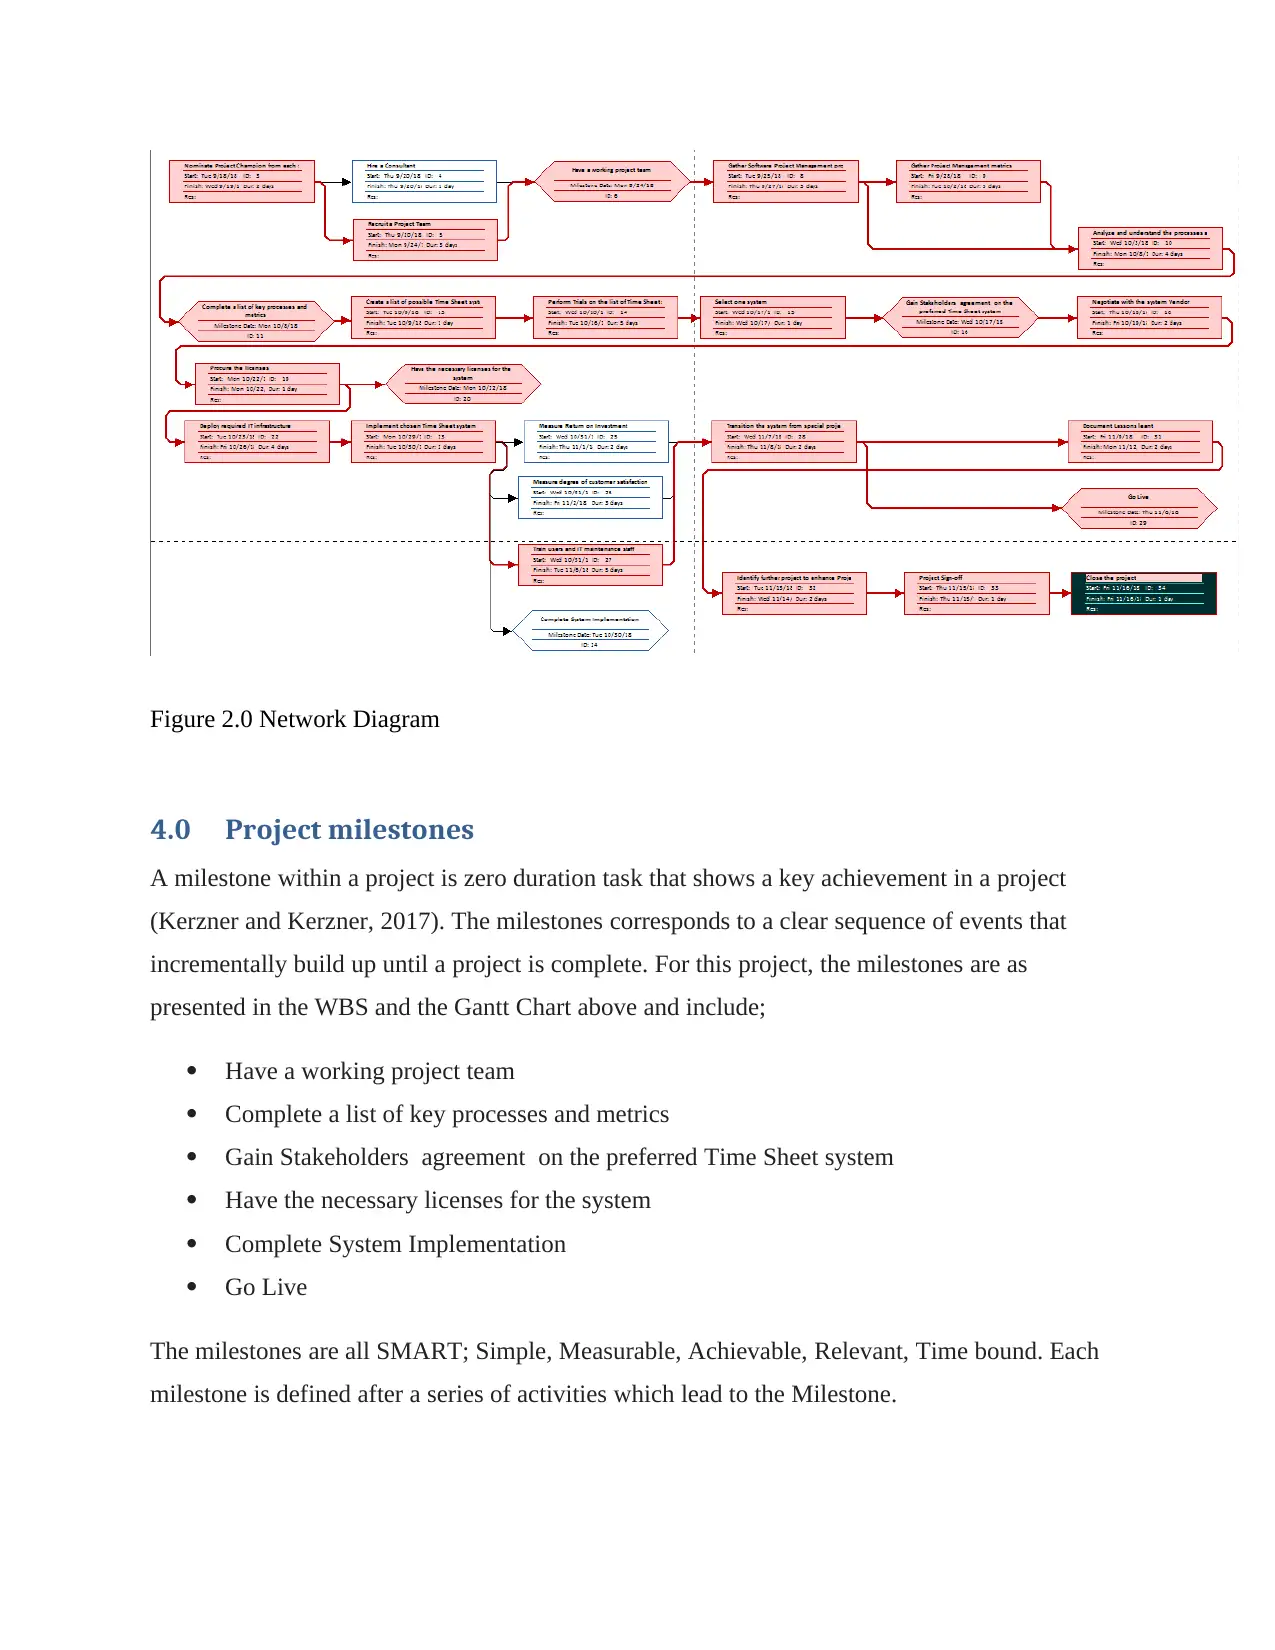
Figure 2.0 Network Diagram
4.0 Project milestones
A milestone within a project is zero duration task that shows a key achievement in a project
(Kerzner and Kerzner, 2017). The milestones corresponds to a clear sequence of events that
incrementally build up until a project is complete. For this project, the milestones are as
presented in the WBS and the Gantt Chart above and include;
Have a working project team
Complete a list of key processes and metrics
Gain Stakeholders agreement on the preferred Time Sheet system
Have the necessary licenses for the system
Complete System Implementation
Go Live
The milestones are all SMART; Simple, Measurable, Achievable, Relevant, Time bound. Each
milestone is defined after a series of activities which lead to the Milestone.
⊘ This is a preview!⊘
Do you want full access?
Subscribe today to unlock all pages.
Trusted by 1+ million students worldwide
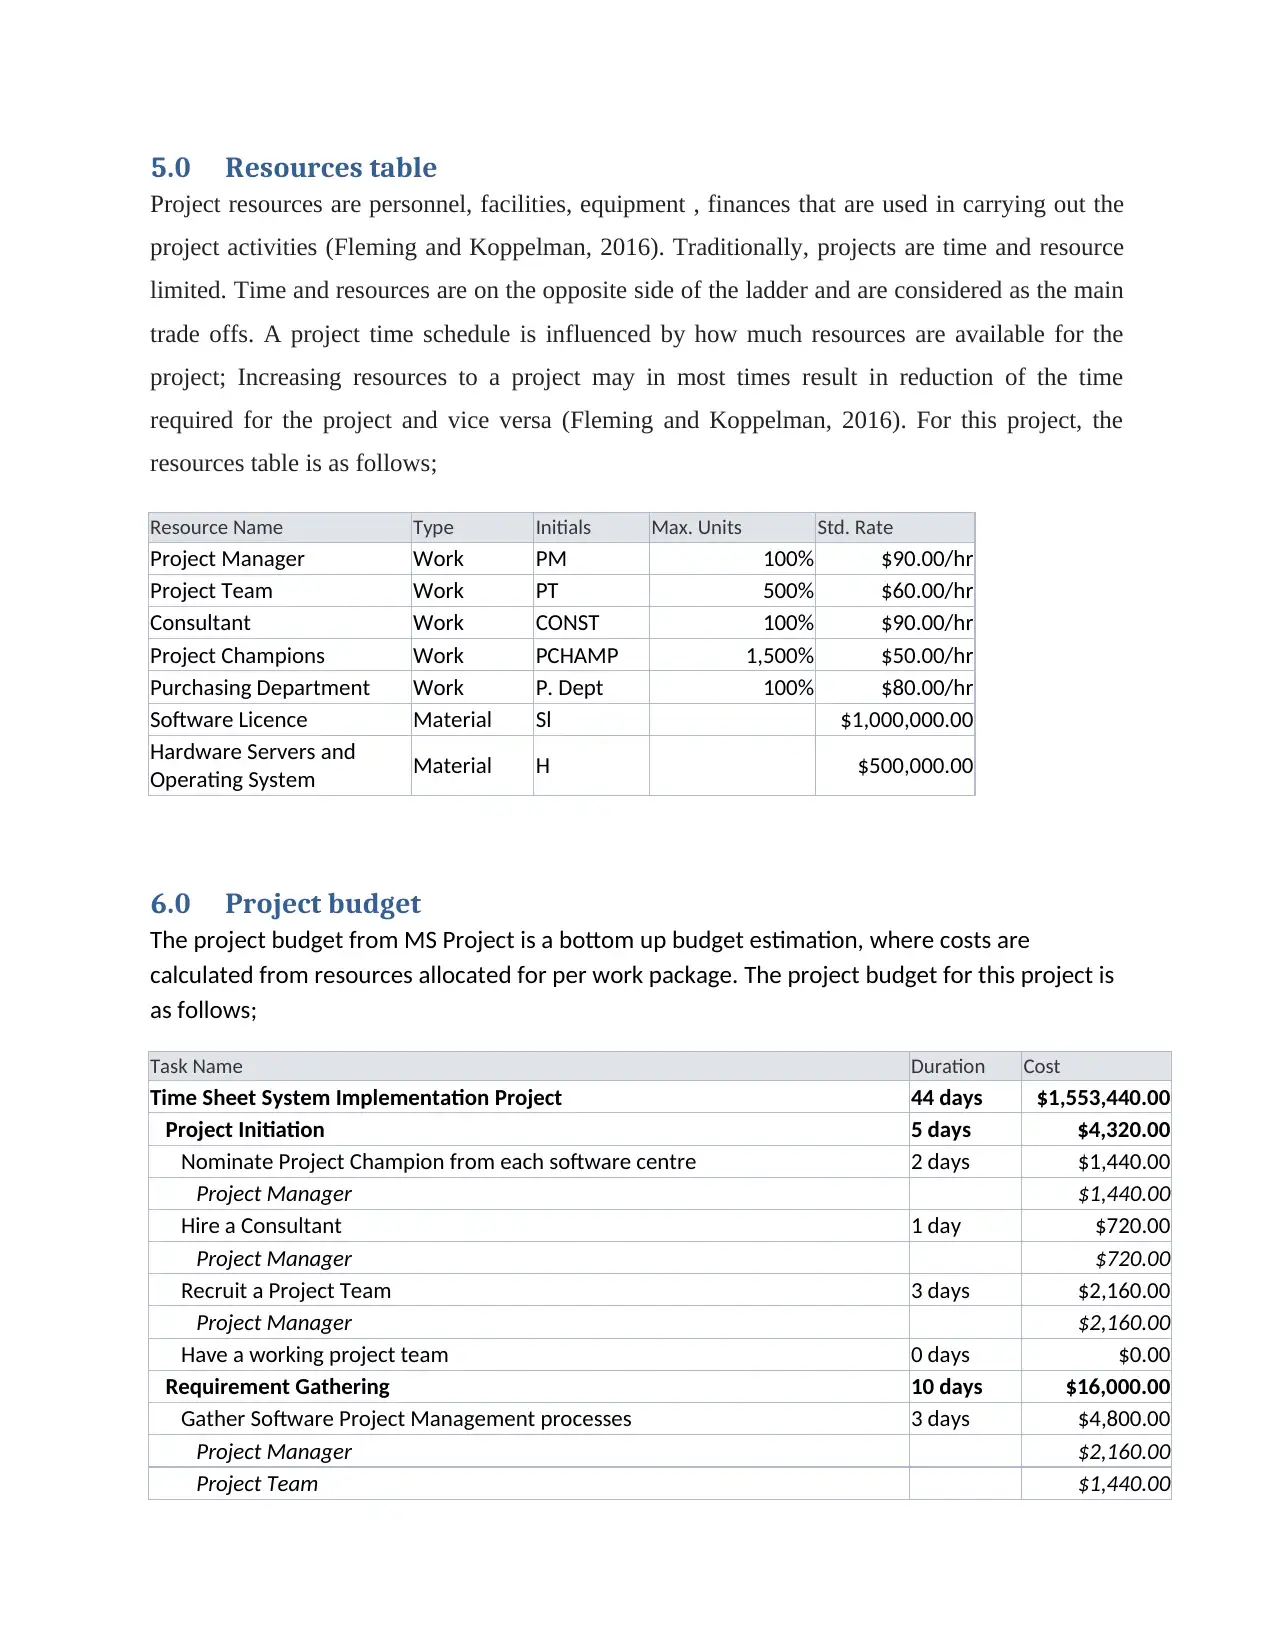
5.0 Resources table
Project resources are personnel, facilities, equipment , finances that are used in carrying out the
project activities (Fleming and Koppelman, 2016). Traditionally, projects are time and resource
limited. Time and resources are on the opposite side of the ladder and are considered as the main
trade offs. A project time schedule is influenced by how much resources are available for the
project; Increasing resources to a project may in most times result in reduction of the time
required for the project and vice versa (Fleming and Koppelman, 2016). For this project, the
resources table is as follows;
Resource Name Type Initials Max. Units Std. Rate
Project Manager Work PM 100% $90.00/hr
Project Team Work PT 500% $60.00/hr
Consultant Work CONST 100% $90.00/hr
Project Champions Work PCHAMP 1,500% $50.00/hr
Purchasing Department Work P. Dept 100% $80.00/hr
Software Licence Material Sl $1,000,000.00
Hardware Servers and
Operating System Material H $500,000.00
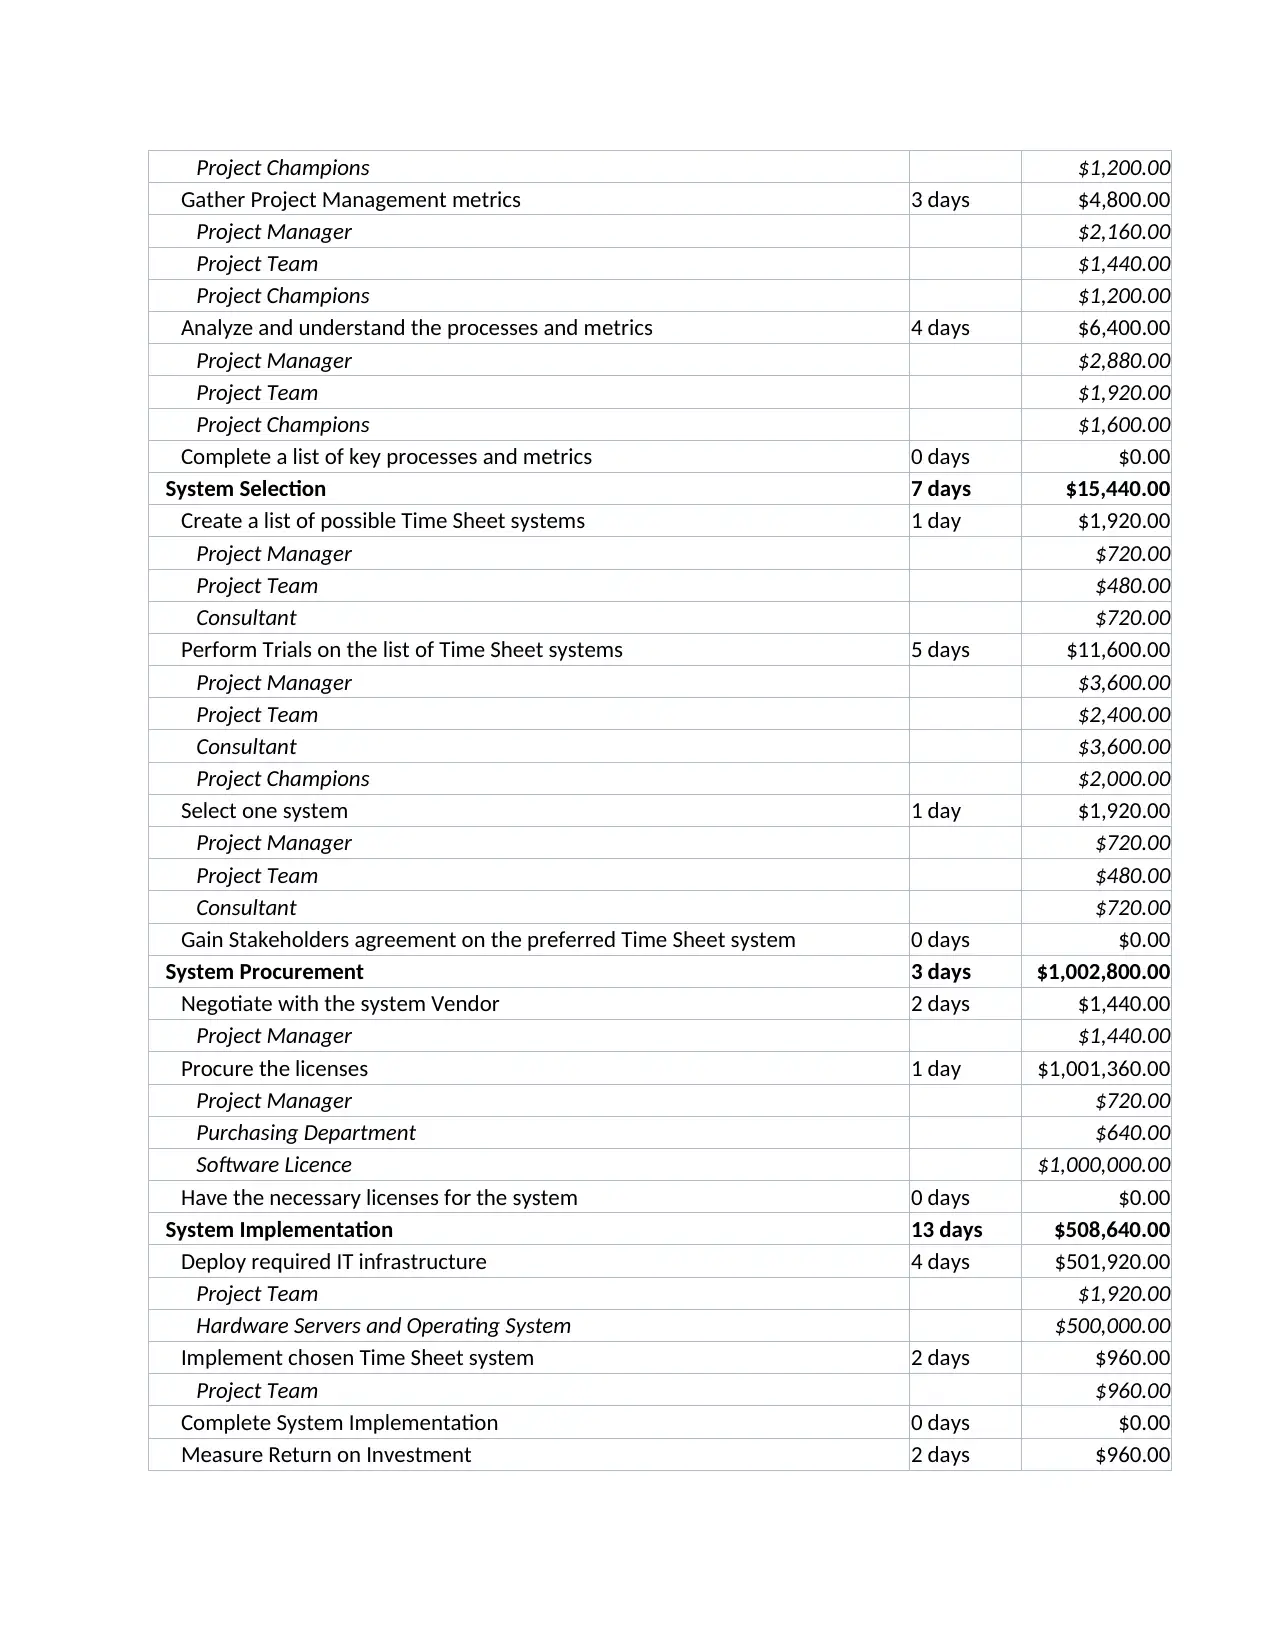
6.0 Project budget
The project budget from MS Project is a bottom up budget estimation, where costs are
calculated from resources allocated for per work package. The project budget for this project is
as follows;
Task Name Duration Cost
Time Sheet System Implementation Project 44 days $1,553,440.00
Project Initiation 5 days $4,320.00
Nominate Project Champion from each software centre 2 days $1,440.00
Project Manager $1,440.00
Hire a Consultant 1 day $720.00
Project Manager $720.00
Recruit a Project Team 3 days $2,160.00
Project Manager $2,160.00
Have a working project team 0 days $0.00
Requirement Gathering 10 days $16,000.00
Gather Software Project Management processes 3 days $4,800.00
Project Manager $2,160.00
Project Team $1,440.00
Project resources are personnel, facilities, equipment , finances that are used in carrying out the
project activities (Fleming and Koppelman, 2016). Traditionally, projects are time and resource
limited. Time and resources are on the opposite side of the ladder and are considered as the main
trade offs. A project time schedule is influenced by how much resources are available for the
project; Increasing resources to a project may in most times result in reduction of the time
required for the project and vice versa (Fleming and Koppelman, 2016). For this project, the
resources table is as follows;
Resource Name Type Initials Max. Units Std. Rate
Project Manager Work PM 100% $90.00/hr
Project Team Work PT 500% $60.00/hr
Consultant Work CONST 100% $90.00/hr
Project Champions Work PCHAMP 1,500% $50.00/hr
Purchasing Department Work P. Dept 100% $80.00/hr
Software Licence Material Sl $1,000,000.00
Hardware Servers and
Operating System Material H $500,000.00
6.0 Project budget
The project budget from MS Project is a bottom up budget estimation, where costs are
calculated from resources allocated for per work package. The project budget for this project is
as follows;
Task Name Duration Cost
Time Sheet System Implementation Project 44 days $1,553,440.00
Project Initiation 5 days $4,320.00
Nominate Project Champion from each software centre 2 days $1,440.00
Project Manager $1,440.00
Hire a Consultant 1 day $720.00
Project Manager $720.00
Recruit a Project Team 3 days $2,160.00
Project Manager $2,160.00
Have a working project team 0 days $0.00
Requirement Gathering 10 days $16,000.00
Gather Software Project Management processes 3 days $4,800.00
Project Manager $2,160.00
Project Team $1,440.00
Paraphrase This Document
Need a fresh take? Get an instant paraphrase of this document with our AI Paraphraser
Project Champions $1,200.00
Gather Project Management metrics 3 days $4,800.00
Project Manager $2,160.00
Project Team $1,440.00
Project Champions $1,200.00
Analyze and understand the processes and metrics 4 days $6,400.00
Project Manager $2,880.00
Project Team $1,920.00
Project Champions $1,600.00
Complete a list of key processes and metrics 0 days $0.00
System Selection 7 days $15,440.00
Create a list of possible Time Sheet systems 1 day $1,920.00
Project Manager $720.00
Project Team $480.00
Consultant $720.00
Perform Trials on the list of Time Sheet systems 5 days $11,600.00
Project Manager $3,600.00
Project Team $2,400.00
Consultant $3,600.00
Project Champions $2,000.00
Select one system 1 day $1,920.00
Project Manager $720.00
Project Team $480.00
Consultant $720.00
Gain Stakeholders agreement on the preferred Time Sheet system 0 days $0.00
System Procurement 3 days $1,002,800.00
Negotiate with the system Vendor 2 days $1,440.00
Project Manager $1,440.00
Procure the licenses 1 day $1,001,360.00
Project Manager $720.00
Purchasing Department $640.00
Software Licence $1,000,000.00
Have the necessary licenses for the system 0 days $0.00
System Implementation 13 days $508,640.00
Deploy required IT infrastructure 4 days $501,920.00
Project Team $1,920.00
Hardware Servers and Operating System $500,000.00
Implement chosen Time Sheet system 2 days $960.00
Project Team $960.00
Complete System Implementation 0 days $0.00
Measure Return on Investment 2 days $960.00
Project Team $960.00
Measure degree of customer satisfaction 3 days $1,440.00
Project Team $1,440.00
Train users and IT maintenance staff 5 days $2,400.00
Project Team $2,400.00
Transition the system from special projects to production 2 days $960.00
Project Team $960.00
Go Live 0 days $0.00
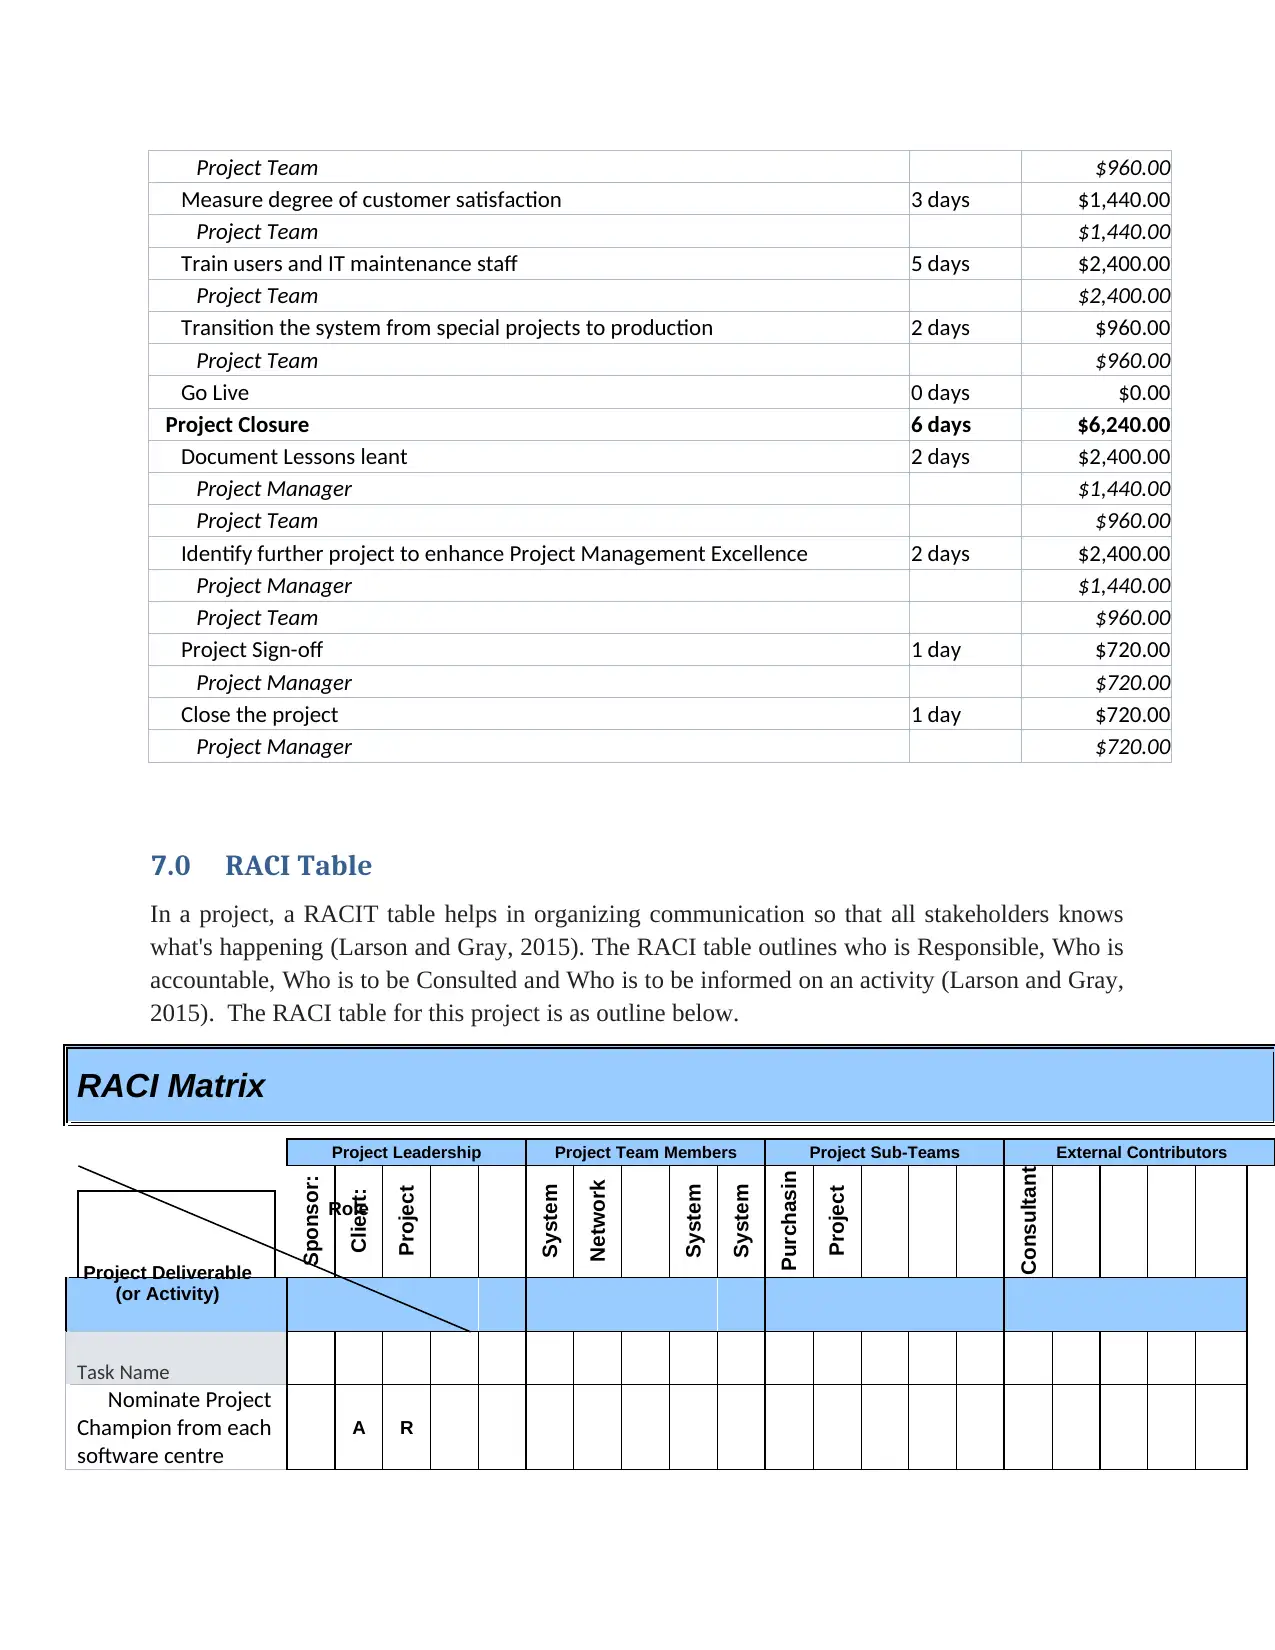
Project Closure 6 days $6,240.00
Document Lessons leant 2 days $2,400.00
Project Manager $1,440.00
Project Team $960.00
Identify further project to enhance Project Management Excellence 2 days $2,400.00
Project Manager $1,440.00
Project Team $960.00
Project Sign-off 1 day $720.00
Project Manager $720.00
Close the project 1 day $720.00
Project Manager $720.00
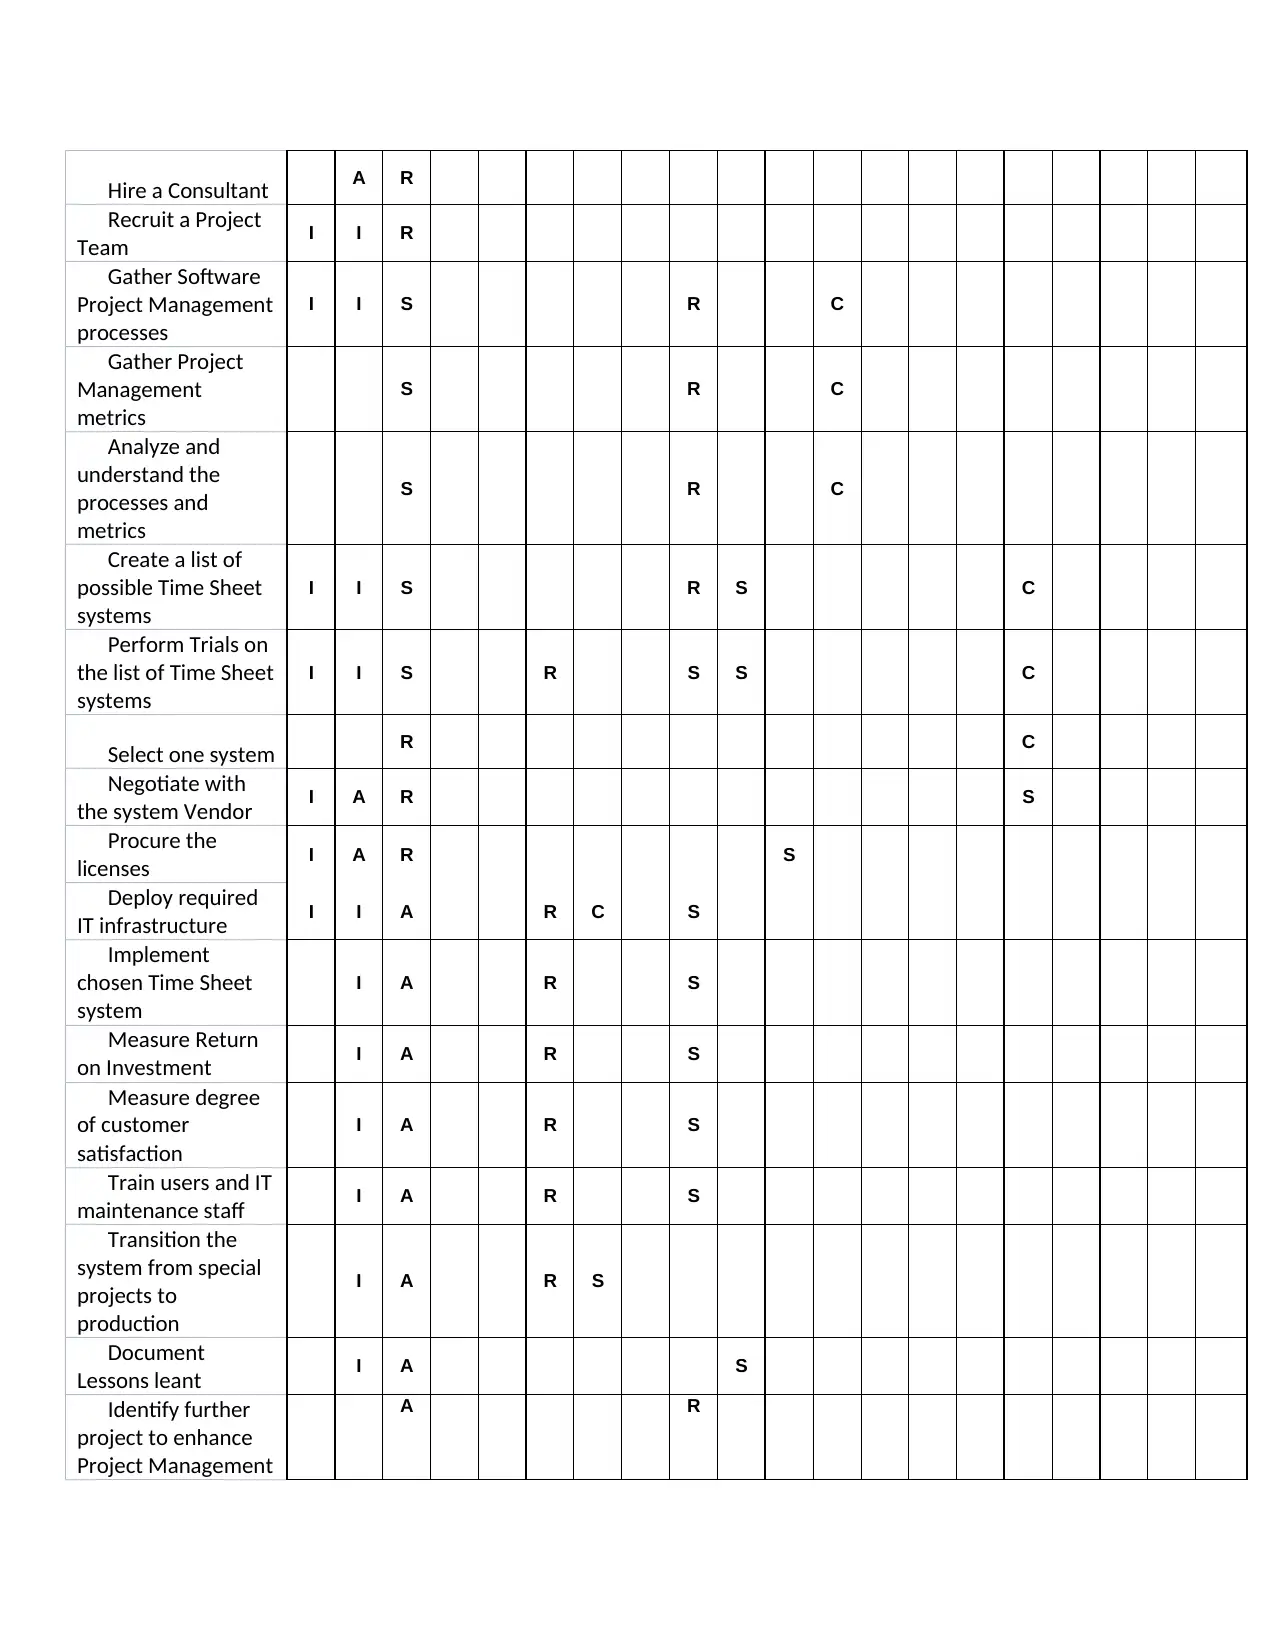
7.0 RACI Table
In a project, a RACIT table helps in organizing communication so that all stakeholders knows
what's happening (Larson and Gray, 2015). The RACI table outlines who is Responsible, Who is
accountable, Who is to be Consulted and Who is to be informed on an activity (Larson and Gray,
2015). The RACI table for this project is as outline below.
RACI Matrix
Project Leadership Project Team Members Project Sub-Teams External Contributors
Sponsor:
Anurag
Client:
John
Project
Manager
System
Admin
Network
Admin
System
Analyst
System
Tester
Purchasin
g Dept
Project
Champion
Consultant
Task Name
Nominate Project
Champion from each
software centre
A R
Role
Project Deliverable
(or Activity)
Measure degree of customer satisfaction 3 days $1,440.00
Project Team $1,440.00
Train users and IT maintenance staff 5 days $2,400.00
Project Team $2,400.00
Transition the system from special projects to production 2 days $960.00
Project Team $960.00
Go Live 0 days $0.00
Project Closure 6 days $6,240.00
Document Lessons leant 2 days $2,400.00
Project Manager $1,440.00
Project Team $960.00
Identify further project to enhance Project Management Excellence 2 days $2,400.00
Project Manager $1,440.00
Project Team $960.00
Project Sign-off 1 day $720.00
Project Manager $720.00
Close the project 1 day $720.00
Project Manager $720.00
7.0 RACI Table
In a project, a RACIT table helps in organizing communication so that all stakeholders knows
what's happening (Larson and Gray, 2015). The RACI table outlines who is Responsible, Who is
accountable, Who is to be Consulted and Who is to be informed on an activity (Larson and Gray,
2015). The RACI table for this project is as outline below.
RACI Matrix
Project Leadership Project Team Members Project Sub-Teams External Contributors
Sponsor:
Anurag
Client:
John
Project
Manager
System
Admin
Network
Admin
System
Analyst
System
Tester
Purchasin
g Dept
Project
Champion
Consultant
Task Name
Nominate Project
Champion from each
software centre
A R
Role
Project Deliverable
(or Activity)
⊘ This is a preview!⊘
Do you want full access?
Subscribe today to unlock all pages.
Trusted by 1+ million students worldwide
Hire a Consultant A R
Recruit a Project
Team I I R
Gather Software
Project Management
processes
I I S R C
Gather Project
Management
metrics
S R C
Analyze and
understand the
processes and
metrics
S R C
Create a list of
possible Time Sheet
systems
I I S R S C
Perform Trials on
the list of Time Sheet
systems
I I S R S S C
Select one system R C
Negotiate with
the system Vendor I A R S
Procure the
licenses I A R S
Deploy required
IT infrastructure I I A R C S
Implement
chosen Time Sheet
system
I A R S
Measure Return
on Investment I A R S
Measure degree
of customer
satisfaction
I A R S
Train users and IT
maintenance staff I A R S
Transition the
system from special
projects to
production
I A R S
Document
Lessons leant I A S
Identify further
project to enhance
Project Management
A R
Paraphrase This Document
Need a fresh take? Get an instant paraphrase of this document with our AI Paraphraser
Excellence
Project Sign-off A C R
Close the project A C R
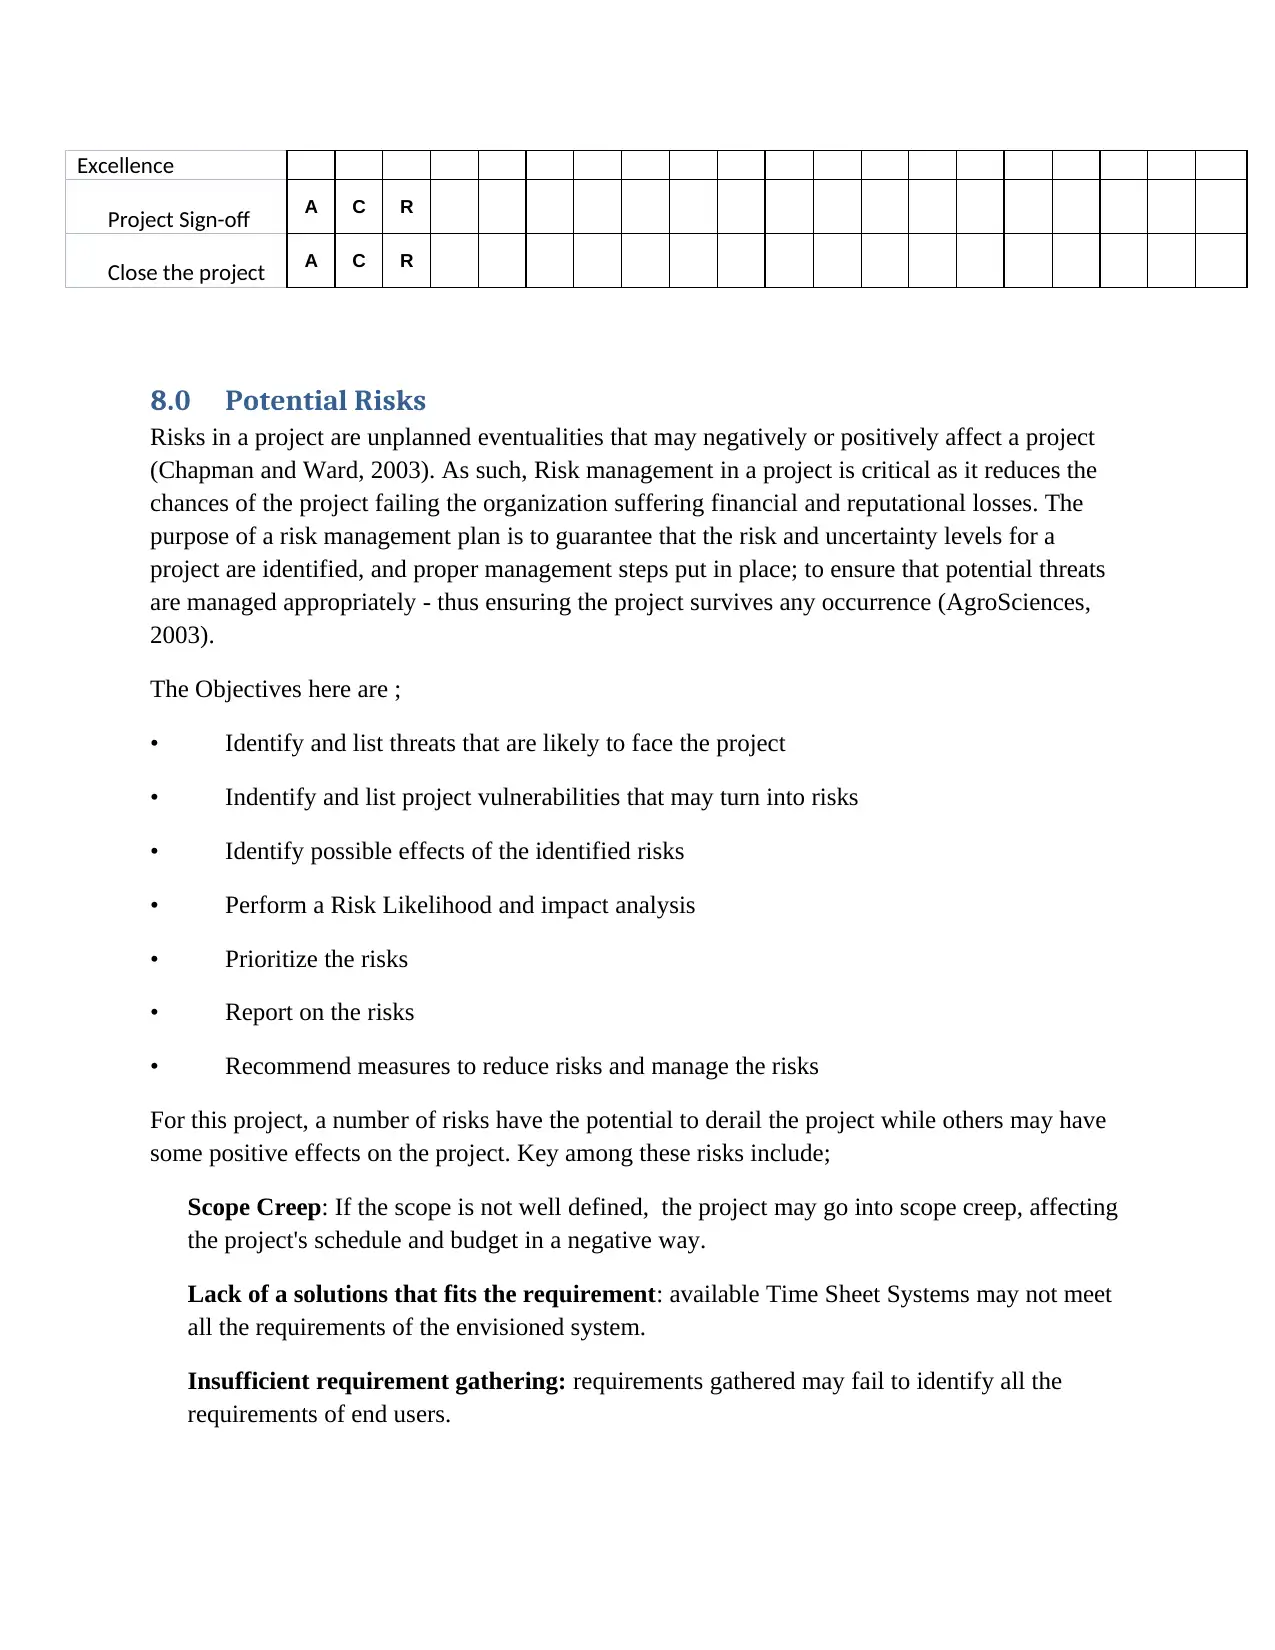
8.0 Potential Risks
Risks in a project are unplanned eventualities that may negatively or positively affect a project
(Chapman and Ward, 2003). As such, Risk management in a project is critical as it reduces the
chances of the project failing the organization suffering financial and reputational losses. The
purpose of a risk management plan is to guarantee that the risk and uncertainty levels for a
project are identified, and proper management steps put in place; to ensure that potential threats
are managed appropriately - thus ensuring the project survives any occurrence (AgroSciences,
2003).
The Objectives here are ;
• Identify and list threats that are likely to face the project
• Indentify and list project vulnerabilities that may turn into risks
• Identify possible effects of the identified risks
• Perform a Risk Likelihood and impact analysis
• Prioritize the risks
• Report on the risks
• Recommend measures to reduce risks and manage the risks
For this project, a number of risks have the potential to derail the project while others may have
some positive effects on the project. Key among these risks include;
Scope Creep: If the scope is not well defined, the project may go into scope creep, affecting
the project's schedule and budget in a negative way.
Lack of a solutions that fits the requirement: available Time Sheet Systems may not meet
all the requirements of the envisioned system.
Insufficient requirement gathering: requirements gathered may fail to identify all the
requirements of end users.
Project Sign-off A C R
Close the project A C R
8.0 Potential Risks
Risks in a project are unplanned eventualities that may negatively or positively affect a project
(Chapman and Ward, 2003). As such, Risk management in a project is critical as it reduces the
chances of the project failing the organization suffering financial and reputational losses. The
purpose of a risk management plan is to guarantee that the risk and uncertainty levels for a
project are identified, and proper management steps put in place; to ensure that potential threats
are managed appropriately - thus ensuring the project survives any occurrence (AgroSciences,
2003).
The Objectives here are ;
• Identify and list threats that are likely to face the project
• Indentify and list project vulnerabilities that may turn into risks
• Identify possible effects of the identified risks
• Perform a Risk Likelihood and impact analysis
• Prioritize the risks
• Report on the risks
• Recommend measures to reduce risks and manage the risks
For this project, a number of risks have the potential to derail the project while others may have
some positive effects on the project. Key among these risks include;
Scope Creep: If the scope is not well defined, the project may go into scope creep, affecting
the project's schedule and budget in a negative way.
Lack of a solutions that fits the requirement: available Time Sheet Systems may not meet
all the requirements of the envisioned system.
Insufficient requirement gathering: requirements gathered may fail to identify all the
requirements of end users.
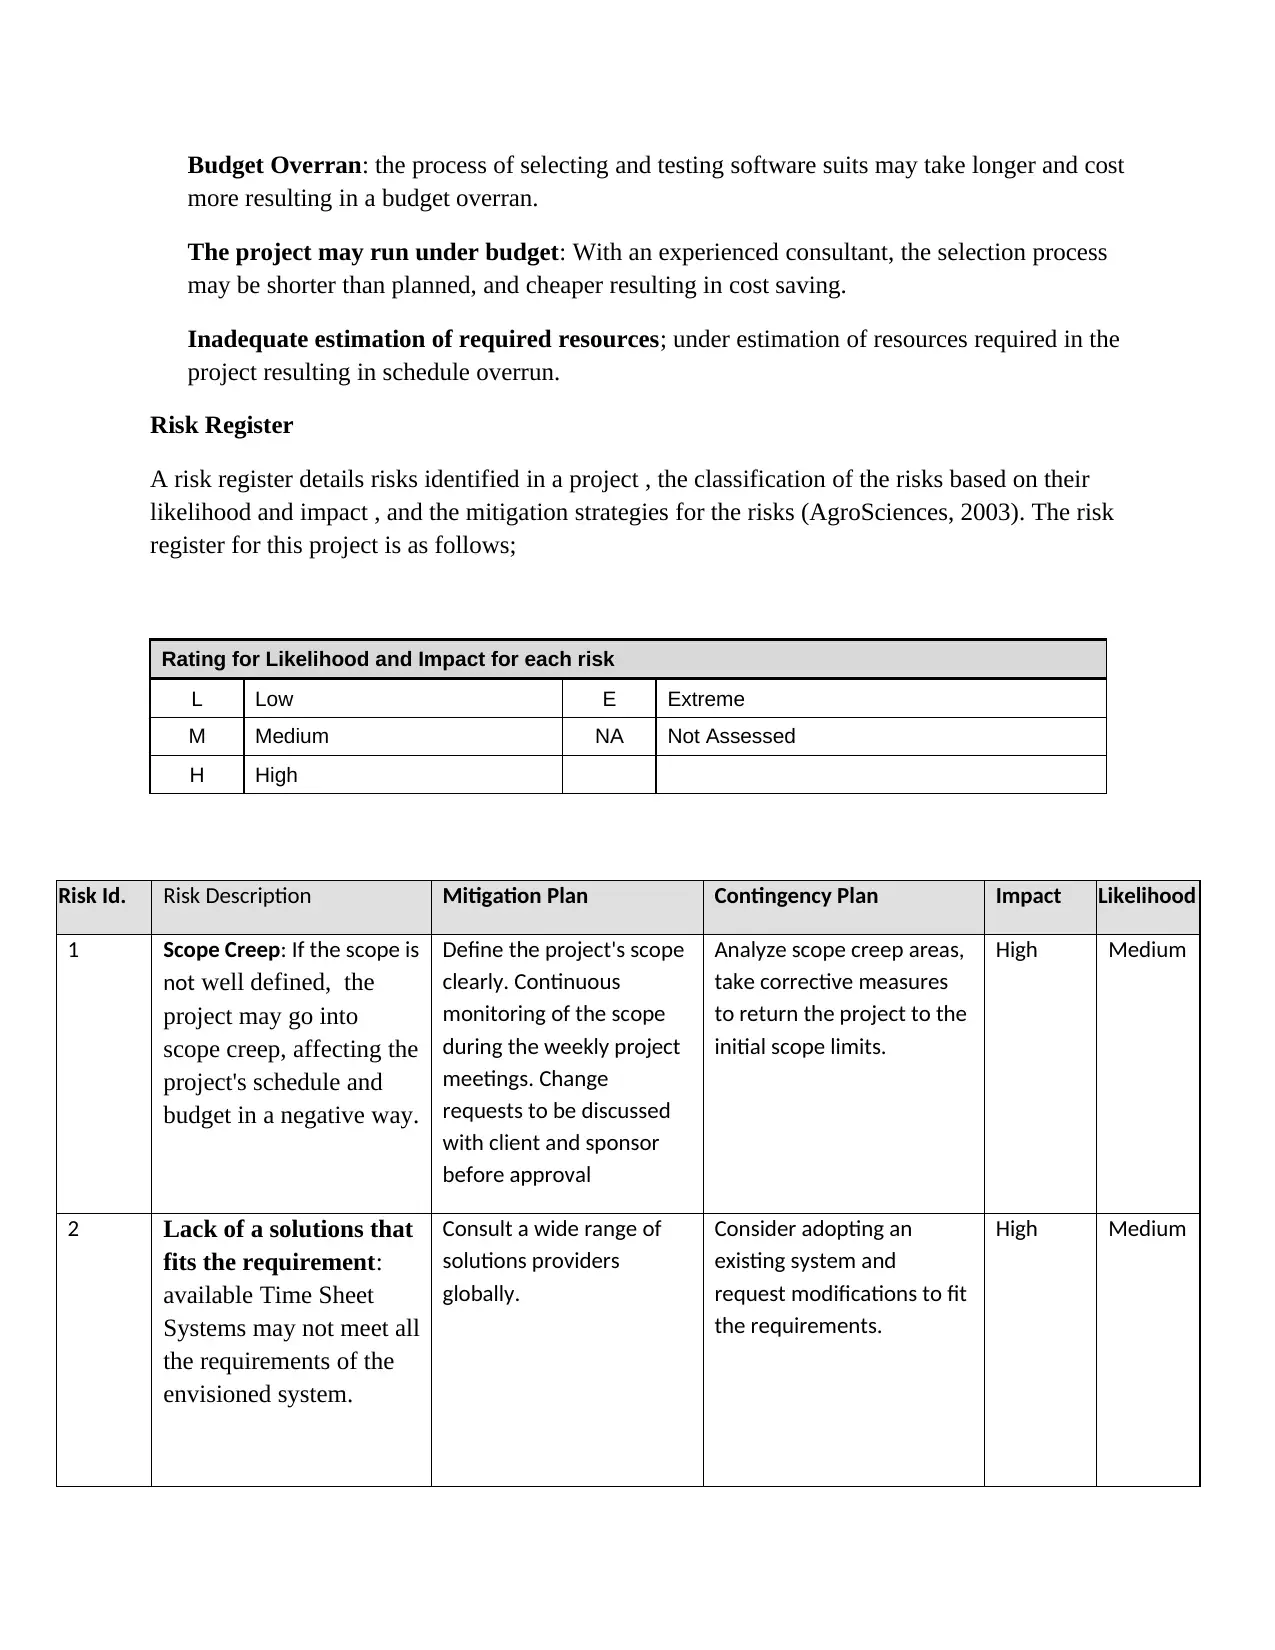
Budget Overran: the process of selecting and testing software suits may take longer and cost
more resulting in a budget overran.
The project may run under budget: With an experienced consultant, the selection process
may be shorter than planned, and cheaper resulting in cost saving.
Inadequate estimation of required resources; under estimation of resources required in the
project resulting in schedule overrun.
Risk Register
A risk register details risks identified in a project , the classification of the risks based on their
likelihood and impact , and the mitigation strategies for the risks (AgroSciences, 2003). The risk
register for this project is as follows;
Rating for Likelihood and Impact for each risk
L Low E Extreme
M Medium NA Not Assessed
H High
Risk Id. Risk Description Mitigation Plan Contingency Plan Impact Likelihood
1 Scope Creep: If the scope is
not well defined, the
project may go into
scope creep, affecting the
project's schedule and
budget in a negative way.
Define the project's scope
clearly. Continuous
monitoring of the scope
during the weekly project
meetings. Change
requests to be discussed
with client and sponsor
before approval
Analyze scope creep areas,
take corrective measures
to return the project to the
initial scope limits.
High Medium
2 Lack of a solutions that
fits the requirement:
available Time Sheet
Systems may not meet all
the requirements of the
envisioned system.
Consult a wide range of
solutions providers
globally.
Consider adopting an
existing system and
request modifications to fit
the requirements.
High Medium
⊘ This is a preview!⊘
Do you want full access?
Subscribe today to unlock all pages.
Trusted by 1+ million students worldwide
1 out of 15
Related Documents


Your All-in-One AI-Powered Toolkit for Academic Success.
+13062052269
info@desklib.com
Available 24*7 on WhatsApp / Email
![[object Object]](/_next/static/media/star-bottom.7253800d.svg)
Unlock your academic potential
Copyright © 2020–2026 A2Z Services. All Rights Reserved. Developed and managed by ZUCOL.