ITEC871 Individual Assignment: Justification for IT Capital Projects

Verified

Added on  2022/09/22

|9
|2017
|25
Report
AI Summary
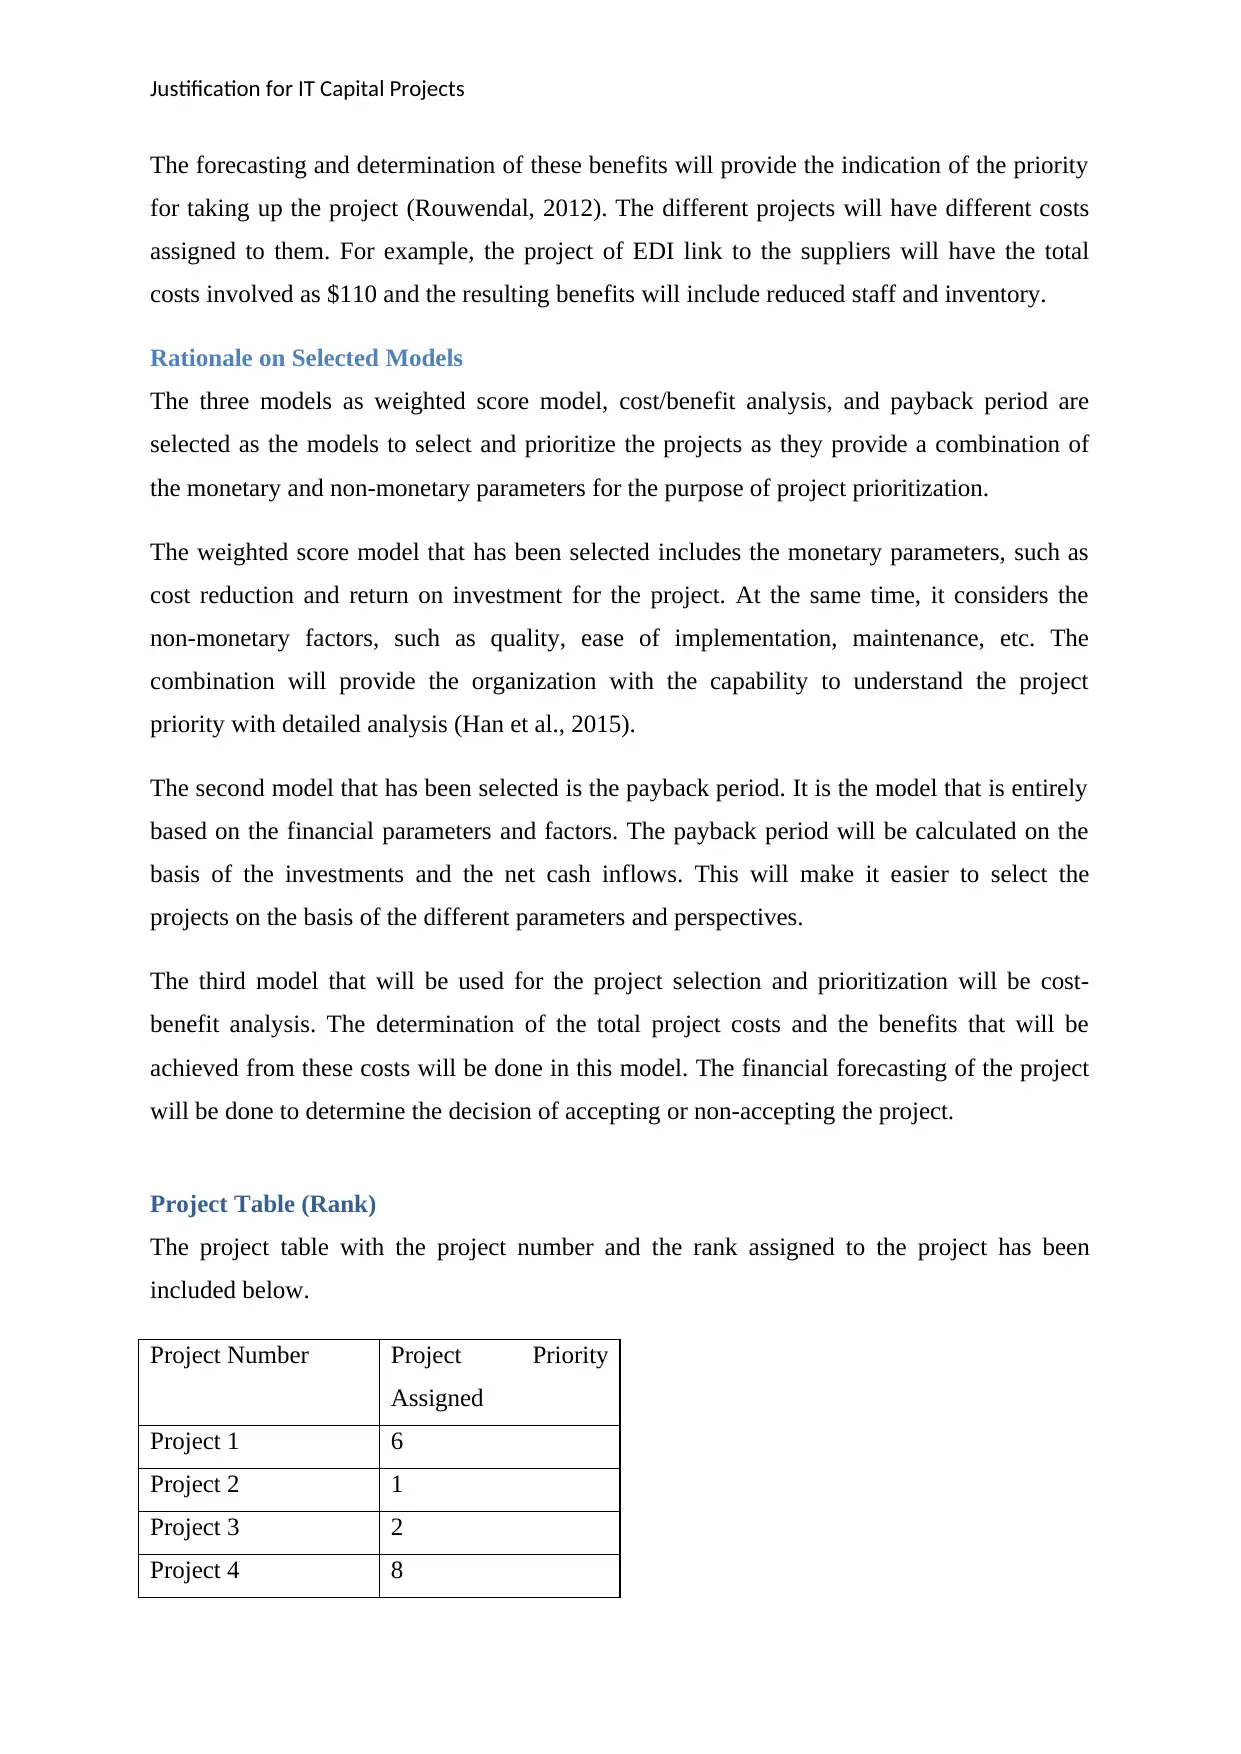
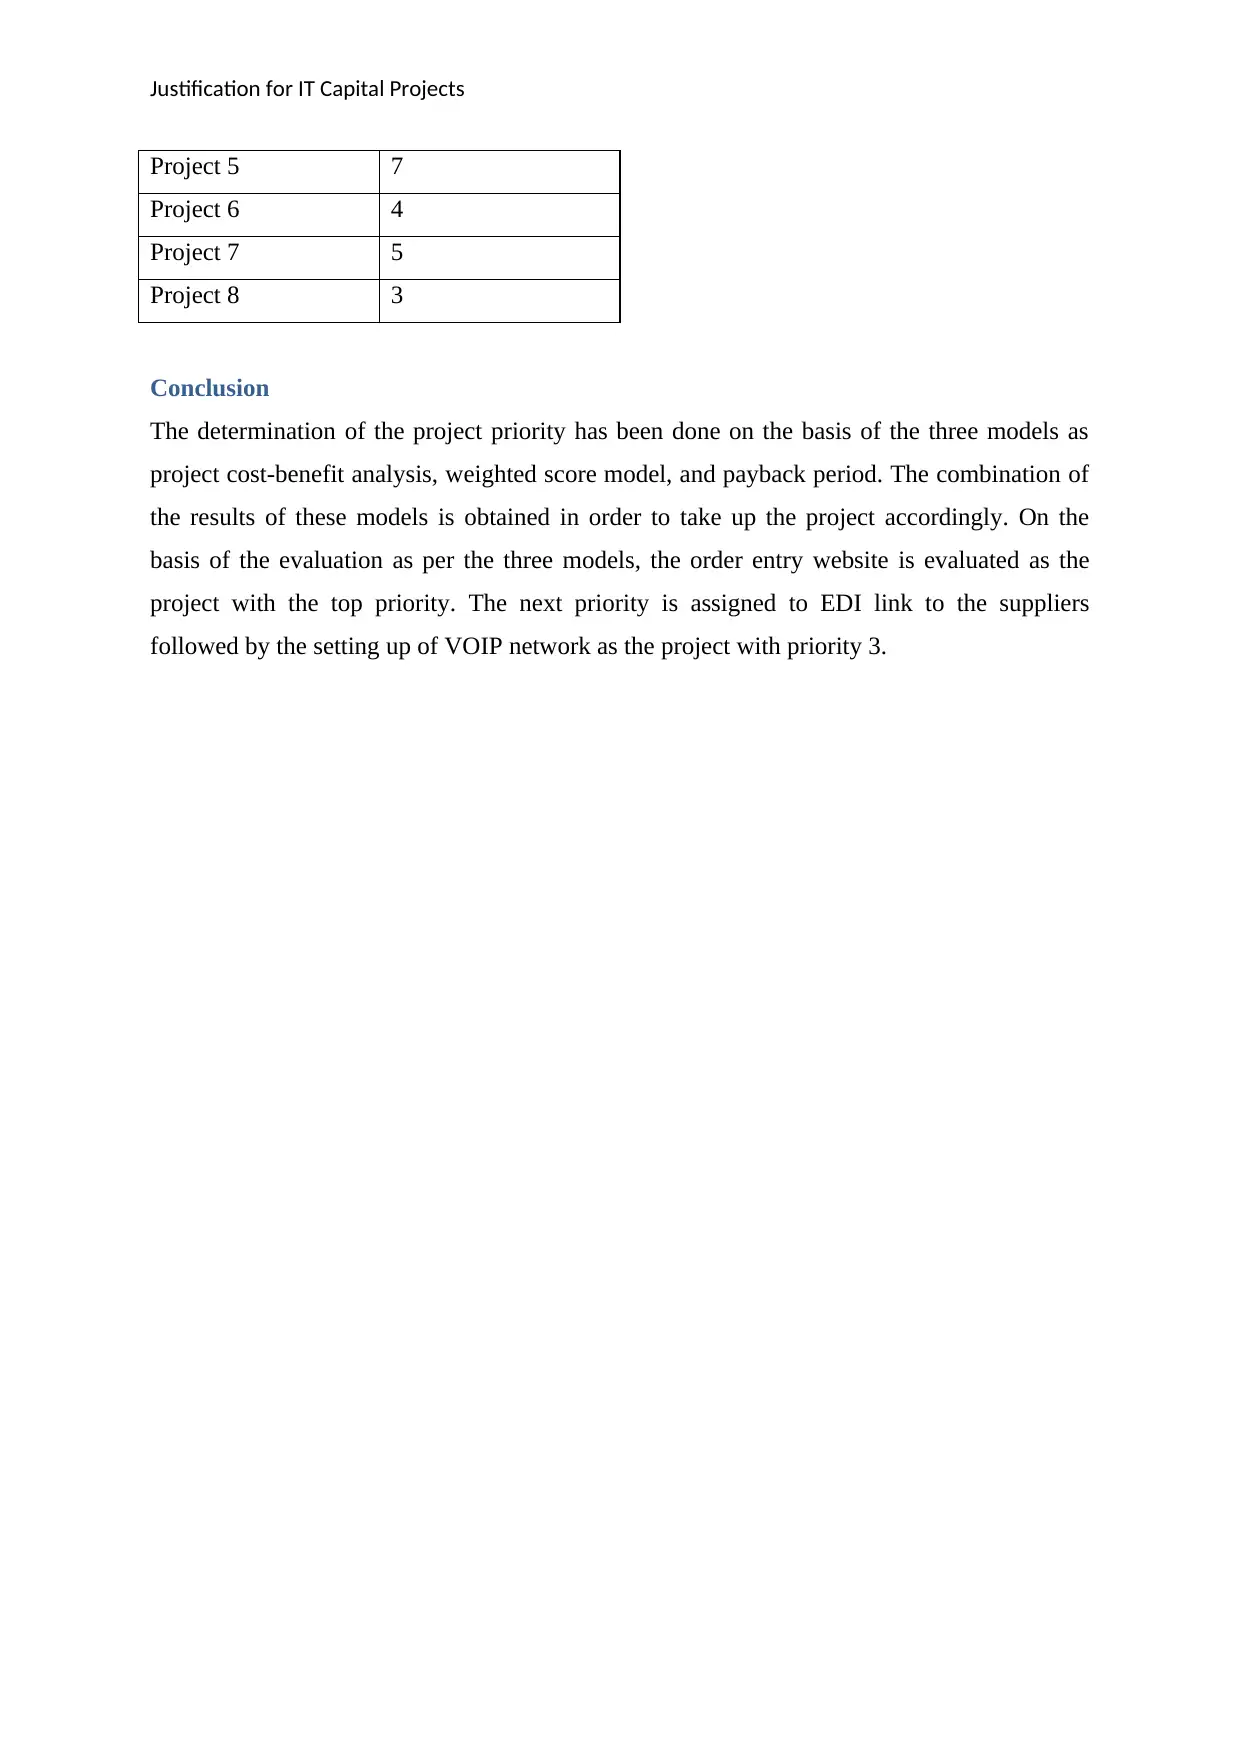
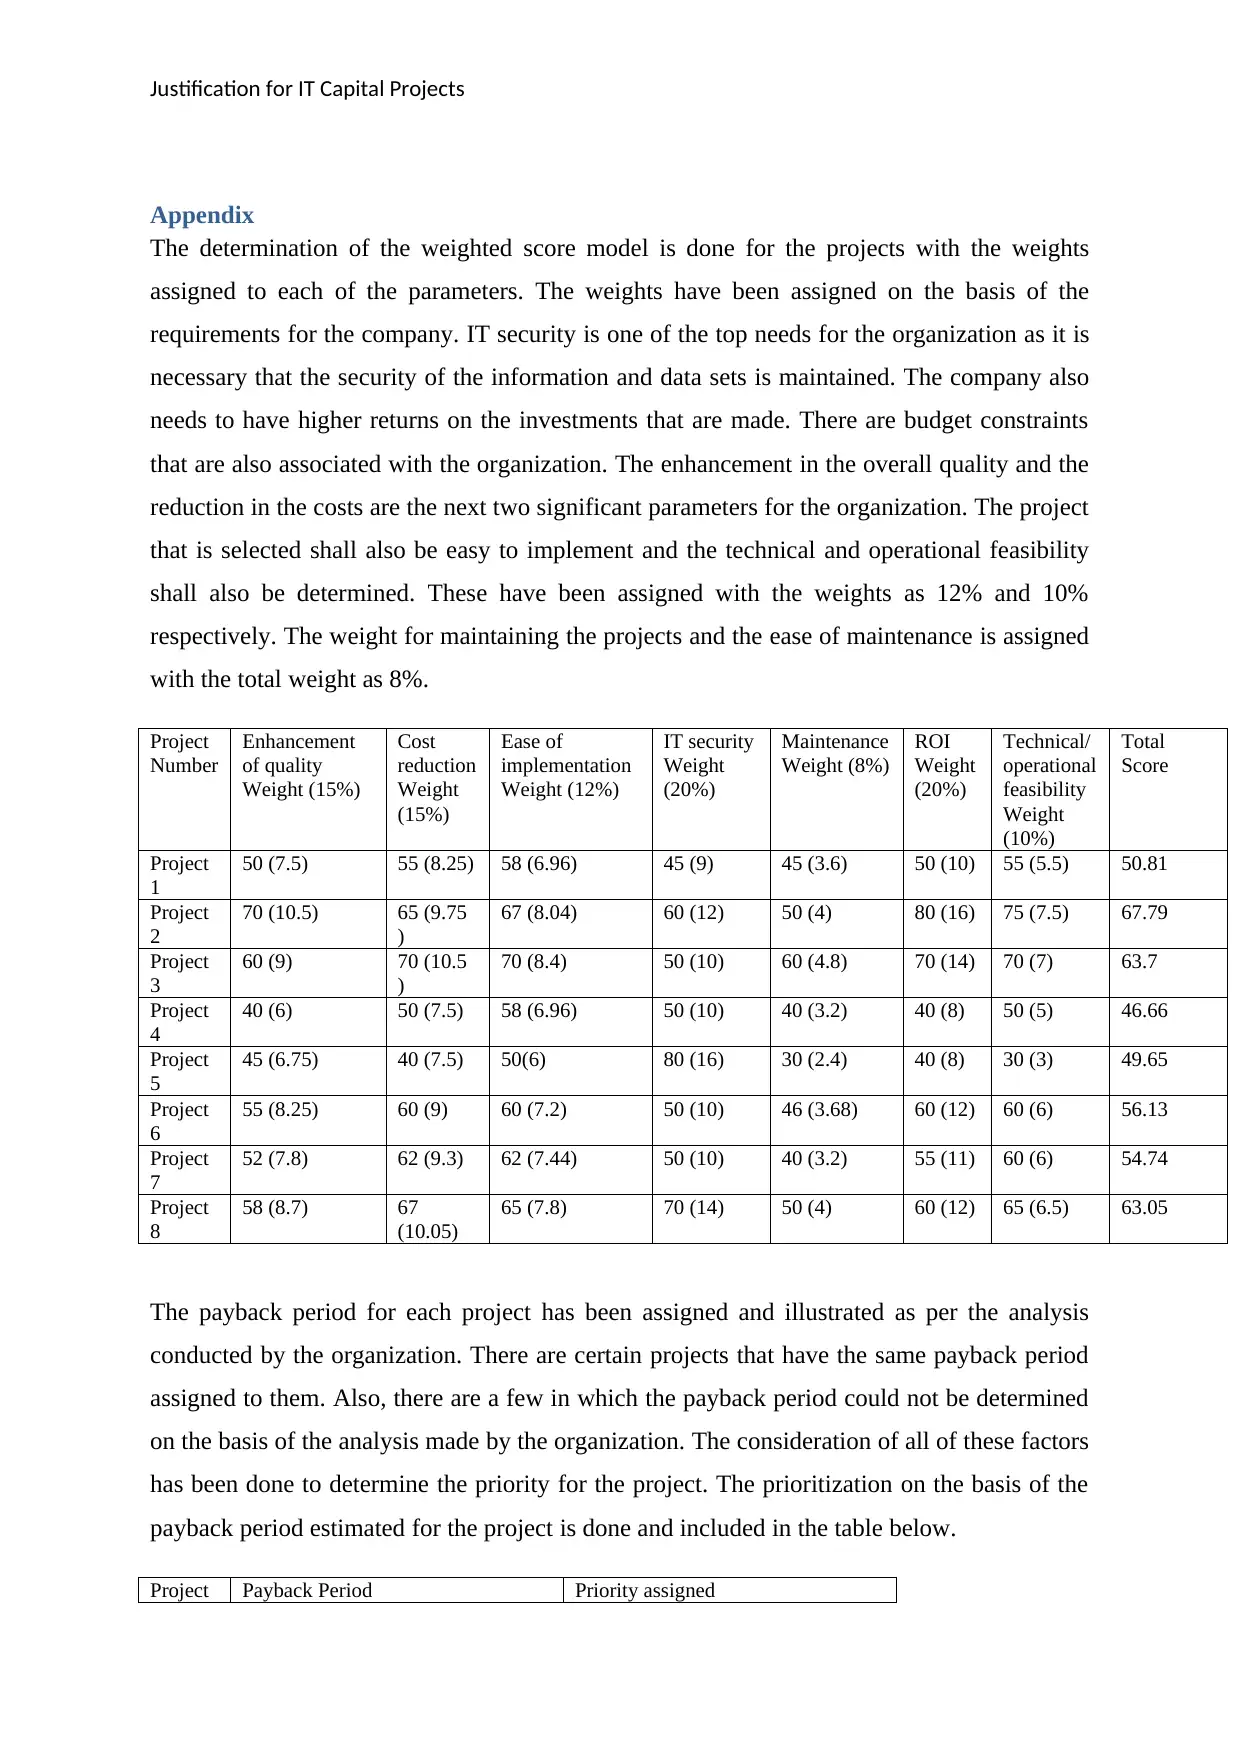
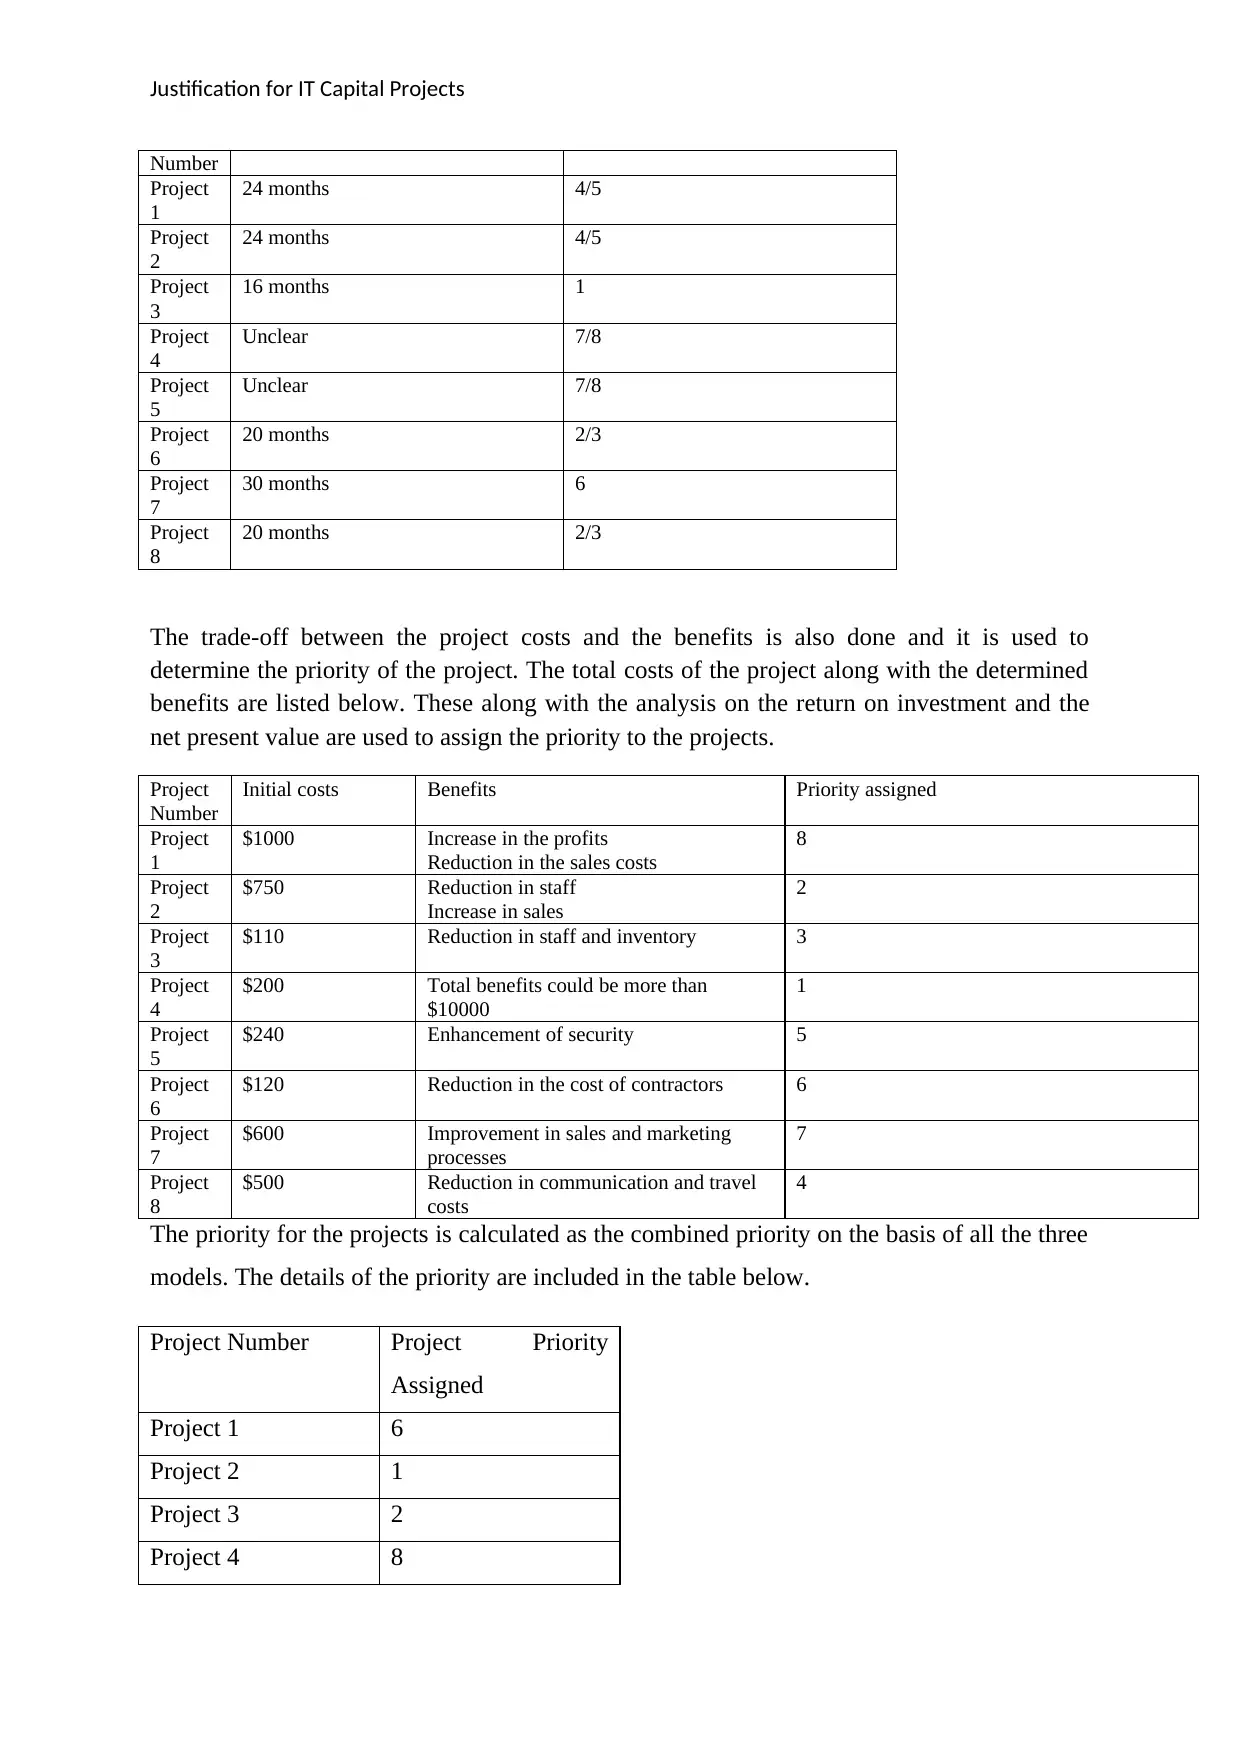
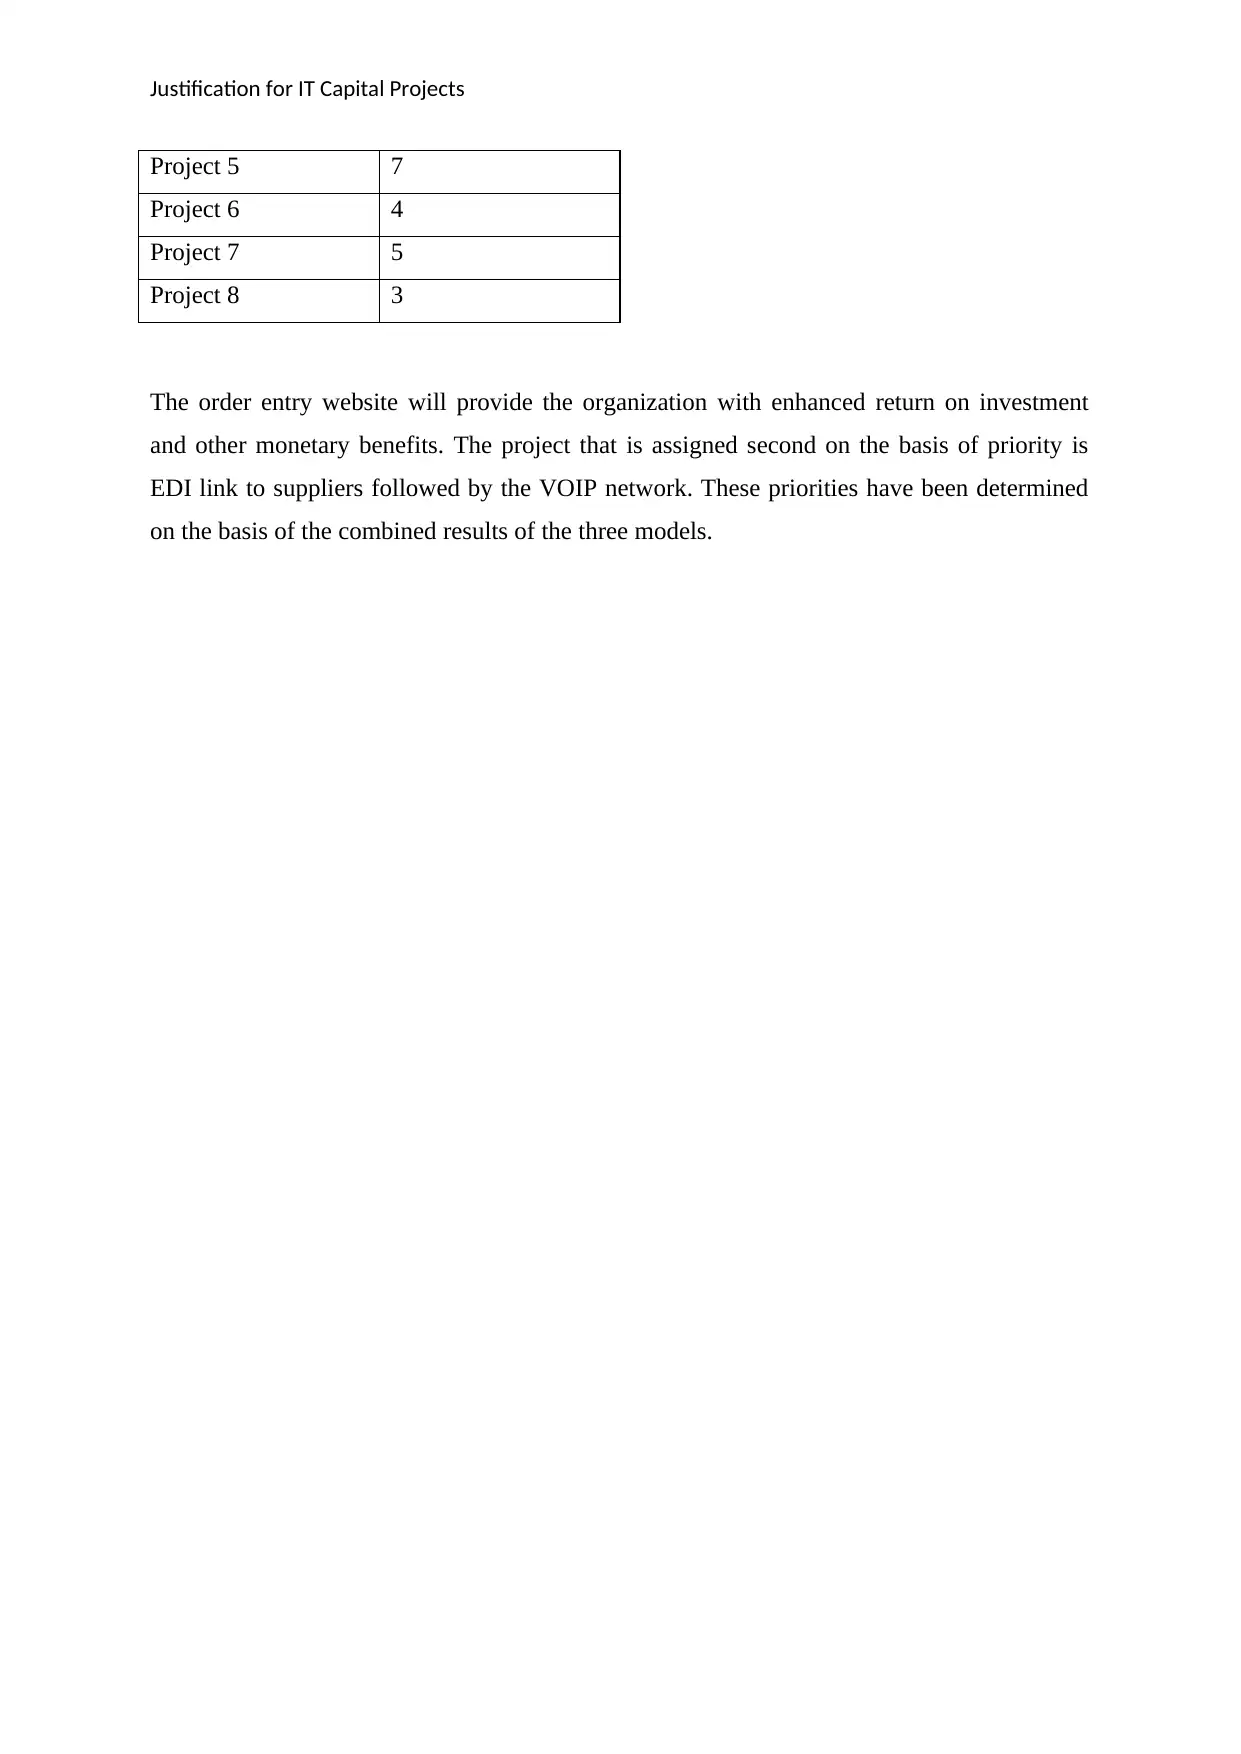
This report, prepared for a large manufacturing company, focuses on justifying IT capital projects using various ranking and evaluation models. The report begins by highlighting the importance of IT infrastructure for business growth and success. It then details the use of weighted score models, payback period analysis, and cost-benefit analysis to assess and prioritize IT projects. The weighted score model considers both monetary and non-monetary parameters such as quality, cost reduction, and IT security, assigning weights to each criterion. The payback period model determines the timeframe for investment return, while the cost-benefit analysis forecasts tangible and intangible benefits. The report provides a project table with assigned ranks and concludes that an order entry website has the highest priority, followed by EDI links to suppliers and a VOIP network. The appendix includes detailed weighted score calculations, payback periods, and cost-benefit analysis for each project, illustrating the rationale behind the prioritization.
Document Page
qwertyuiopasdfghjklzxcvbnmqw
ertyuiopasdfghjklzxcvbnmqwert
yuiopasdfghjklzxcvbnmqwertyui
opasdfghjklzxcvbnmqwertyuiop
asdfghjklzxcvbnmqwertyuiopasd
fghjklzxcvbnmqwertyuiopasdfgh
jklzxcvbnmqwertyuiopasdfghjkl
zxcvbnmqwertyuiopasdfghjklzxc
vbnmqwertyuiopasdfghjklzxcvb
nmqwertyuiopasdfghjklzxcvbnm
qwertyuiopasdfghjklzxcvbnmqw
ertyuiopasdfghjklzxcvbnmqwert
yuiopasdfghjklzxcvbnmqwertyui
opasdfghjklzxcvbnmqwertyuiop
asdfghjklzxcvbnmqwertyuiopasd
fghjklzxcvbnmqwertyuiopasdfgh
jklzxcvbnmrtyuiopasdfghjklzxcv
Information Systems Design & Management
Justification for IT Capital Projects
8/20/2019
tabler-icon-diamond-filled.svg

Paraphrase This Document

Need a fresh take? Get an instant paraphrase of this document with our AI Paraphraser
Document Page
Justification for IT Capital Projects
Table of Contents
Introduction...........................................................................................................................................2
Model(s) for Ranking and Evaluating Projects......................................................................................2
Weighted Score.................................................................................................................................2
Payback Period..................................................................................................................................2
Cost-Benefit Analysis........................................................................................................................2
Rationale on Selected Models............................................................................................................3
Project Table (Rank)..............................................................................................................................3
Conclusion.............................................................................................................................................4
References.............................................................................................................................................5
Appendix...............................................................................................................................................6
Document Page
Justification for IT Capital Projects
Introduction
The report is prepared for a large manufacturing company. The success and growth of the
business organizations is marked by the IT infrastructure implemented in the organization. It
is necessary for the company to expand its IT infrastructure in a cost-effective manner. The
report comprises of the use of some of the models for ranking and evaluating the projects.
The project table with the rank/priority is also included.
Model(s) for Ranking and Evaluating Projects
Weighted Score
The weighted score model is used to prioritize the projects in a business environment on the
basis of a set of criteria. The criterion that is used in these models is a mix of monetary and
non-monetary parameters.
The different set of parameters that will be used to assign the score for the projects will
include enhancement of quality, cost reduction, ease of implementation, IT security,
maintenance, return on investment, and technical/operational feasibility. There will be
weights assigned to each of these parameters on the basis of the utility to the organization
such that the total weight is 100% (Coombes, Basu, Guha & Schork, 2015). The score will be
assigned on a scale of 100 and it will be multiplied with the weight assigned to the parameter.
The total score for the project will be determined by adding the scores obtained. The project
with highest score will be assigned priority 1 and likewise (Jian, Dai & Dai, 2016).
Payback Period
There will be specific costs that will be involved with each of the project that has been
identified. The total estimated cost for the project will be divided by the annual net cash
inflows to determine the payback period of the project. It will be the timeframe in which the
return for the investment made will be obtained (Jahnke & Simons, 2012). The company will
want the payback period to be low for the projects and therefore, the projects with lower
payback period will be provided with the higher priority over the others.
Cost-Benefit Analysis
There will be certain costs associated with the project and the tangible and intangible benefits
will be obtained as an outcome.
Document Page
Justification for IT Capital Projects
The forecasting and determination of these benefits will provide the indication of the priority
for taking up the project (Rouwendal, 2012). The different projects will have different costs
assigned to them. For example, the project of EDI link to the suppliers will have the total
costs involved as $110 and the resulting benefits will include reduced staff and inventory.
Rationale on Selected Models
The three models as weighted score model, cost/benefit analysis, and payback period are
selected as the models to select and prioritize the projects as they provide a combination of
the monetary and non-monetary parameters for the purpose of project prioritization.
The weighted score model that has been selected includes the monetary parameters, such as
cost reduction and return on investment for the project. At the same time, it considers the
non-monetary factors, such as quality, ease of implementation, maintenance, etc. The
combination will provide the organization with the capability to understand the project
priority with detailed analysis (Han et al., 2015).
The second model that has been selected is the payback period. It is the model that is entirely
based on the financial parameters and factors. The payback period will be calculated on the
basis of the investments and the net cash inflows. This will make it easier to select the
projects on the basis of the different parameters and perspectives.
The third model that will be used for the project selection and prioritization will be cost-
benefit analysis. The determination of the total project costs and the benefits that will be
achieved from these costs will be done in this model. The financial forecasting of the project
will be done to determine the decision of accepting or non-accepting the project.
Project Table (Rank)
The project table with the project number and the rank assigned to the project has been
included below.
Project Number Project Priority
Assigned
Project 1 6
Project 2 1
Project 3 2
Project 4 8
tabler-icon-diamond-filled.svg

Paraphrase This Document

Need a fresh take? Get an instant paraphrase of this document with our AI Paraphraser
Document Page
Justification for IT Capital Projects
Project 5 7
Project 6 4
Project 7 5
Project 8 3
Conclusion
The determination of the project priority has been done on the basis of the three models as
project cost-benefit analysis, weighted score model, and payback period. The combination of
the results of these models is obtained in order to take up the project accordingly. On the
basis of the evaluation as per the three models, the order entry website is evaluated as the
project with the top priority. The next priority is assigned to EDI link to the suppliers
followed by the setting up of VOIP network as the project with priority 3.
Document Page
Justification for IT Capital Projects
References
Coombes, B., Basu, S., Guha, S., & Schork, N. (2015). Weighted Score Tests Implementing
Model-Averaging Schemes in Detection of Rare Variants in Case-Control Studies.
PLOS ONE, 10(10), e0139355. doi: 10.1371/journal.pone.0139355
Han, S., Rosenberg, P., Ghosh, A., Landi, M., Caporaso, N., & Chatterjee, N. (2015). An
exposure-weighted score test for genetic associations integrating environmental risk
factors. Biometrics, 71(3), 596-605. doi: 10.1111/biom.12328
Jahnke, H., & Simons, D. (2012). A Rational for the Payback Criterion: An Application of
Almost Stochastic Dominance to Capital Budgeting. SSRN Electronic Journal. doi:
10.2139/ssrn.1299584
Jian, X., Dai, B., & Dai, H. (2016). The weighted-score logistic model and Monte Carlo
simulation study. Acta Psychologica Sinica, 48(12), 1625. doi:
10.3724/sp.j.1041.2016.01625
Rouwendal, J. (2012). Indirect Effects in Cost-Benefit Analysis. Journal Of Benefit-Cost
Analysis, 3(1), 1-27. doi: 10.1515/2152-2812.1046
Document Page
Justification for IT Capital Projects
Appendix
The determination of the weighted score model is done for the projects with the weights
assigned to each of the parameters. The weights have been assigned on the basis of the
requirements for the company. IT security is one of the top needs for the organization as it is
necessary that the security of the information and data sets is maintained. The company also
needs to have higher returns on the investments that are made. There are budget constraints
that are also associated with the organization. The enhancement in the overall quality and the
reduction in the costs are the next two significant parameters for the organization. The project
that is selected shall also be easy to implement and the technical and operational feasibility
shall also be determined. These have been assigned with the weights as 12% and 10%
respectively. The weight for maintaining the projects and the ease of maintenance is assigned
with the total weight as 8%.
Project
Number
Enhancement
of quality
Weight (15%)
Cost
reduction
Weight
(15%)
Ease of
implementation
Weight (12%)
IT security
Weight
(20%)
Maintenance
Weight (8%)
ROI
Weight
(20%)
Technical/
operational
feasibility
Weight
(10%)
Total
Score
Project
1
50 (7.5) 55 (8.25) 58 (6.96) 45 (9) 45 (3.6) 50 (10) 55 (5.5) 50.81
Project
2
70 (10.5) 65 (9.75
)
67 (8.04) 60 (12) 50 (4) 80 (16) 75 (7.5) 67.79
Project
3
60 (9) 70 (10.5
)
70 (8.4) 50 (10) 60 (4.8) 70 (14) 70 (7) 63.7
Project
4
40 (6) 50 (7.5) 58 (6.96) 50 (10) 40 (3.2) 40 (8) 50 (5) 46.66
Project
5
45 (6.75) 40 (7.5) 50(6) 80 (16) 30 (2.4) 40 (8) 30 (3) 49.65
Project
6
55 (8.25) 60 (9) 60 (7.2) 50 (10) 46 (3.68) 60 (12) 60 (6) 56.13
Project
7
52 (7.8) 62 (9.3) 62 (7.44) 50 (10) 40 (3.2) 55 (11) 60 (6) 54.74
Project
8
58 (8.7) 67
(10.05)
65 (7.8) 70 (14) 50 (4) 60 (12) 65 (6.5) 63.05
The payback period for each project has been assigned and illustrated as per the analysis
conducted by the organization. There are certain projects that have the same payback period
assigned to them. Also, there are a few in which the payback period could not be determined
on the basis of the analysis made by the organization. The consideration of all of these factors
has been done to determine the priority for the project. The prioritization on the basis of the
payback period estimated for the project is done and included in the table below.
Project Payback Period Priority assigned
tabler-icon-diamond-filled.svg

Paraphrase This Document

Need a fresh take? Get an instant paraphrase of this document with our AI Paraphraser
Document Page
Justification for IT Capital Projects
Number
Project
1
24 months 4/5
Project
2
24 months 4/5
Project
3
16 months 1
Project
4
Unclear 7/8
Project
5
Unclear 7/8
Project
6
20 months 2/3
Project
7
30 months 6
Project
8
20 months 2/3
The trade-off between the project costs and the benefits is also done and it is used to
determine the priority of the project. The total costs of the project along with the determined
benefits are listed below. These along with the analysis on the return on investment and the
net present value are used to assign the priority to the projects.
Project
Number
Initial costs Benefits Priority assigned
Project
1
$1000 Increase in the profits
Reduction in the sales costs
8
Project
2
$750 Reduction in staff
Increase in sales
2
Project
3
$110 Reduction in staff and inventory 3
Project
4
$200 Total benefits could be more than
$10000
1
Project
5
$240 Enhancement of security 5
Project
6
$120 Reduction in the cost of contractors 6
Project
7
$600 Improvement in sales and marketing
processes
7
Project
8
$500 Reduction in communication and travel
costs
4
The priority for the projects is calculated as the combined priority on the basis of all the three
models. The details of the priority are included in the table below.
Project Number Project Priority
Assigned
Project 1 6
Project 2 1
Project 3 2
Project 4 8
Document Page
Justification for IT Capital Projects
Project 5 7
Project 6 4
Project 7 5
Project 8 3
The order entry website will provide the organization with enhanced return on investment
and other monetary benefits. The project that is assigned second on the basis of priority is
EDI link to suppliers followed by the VOIP network. These priorities have been determined
on the basis of the combined results of the three models.
chevron_up_icon
1 out of 9
circle_padding
hide_on_mobile
zoom_out_icon
[object Object]