ITEC871: Justification of IT Capital Projects Report Analysis

Verified

Added on  2022/09/21

|15
|1405
|20
Report
AI Summary
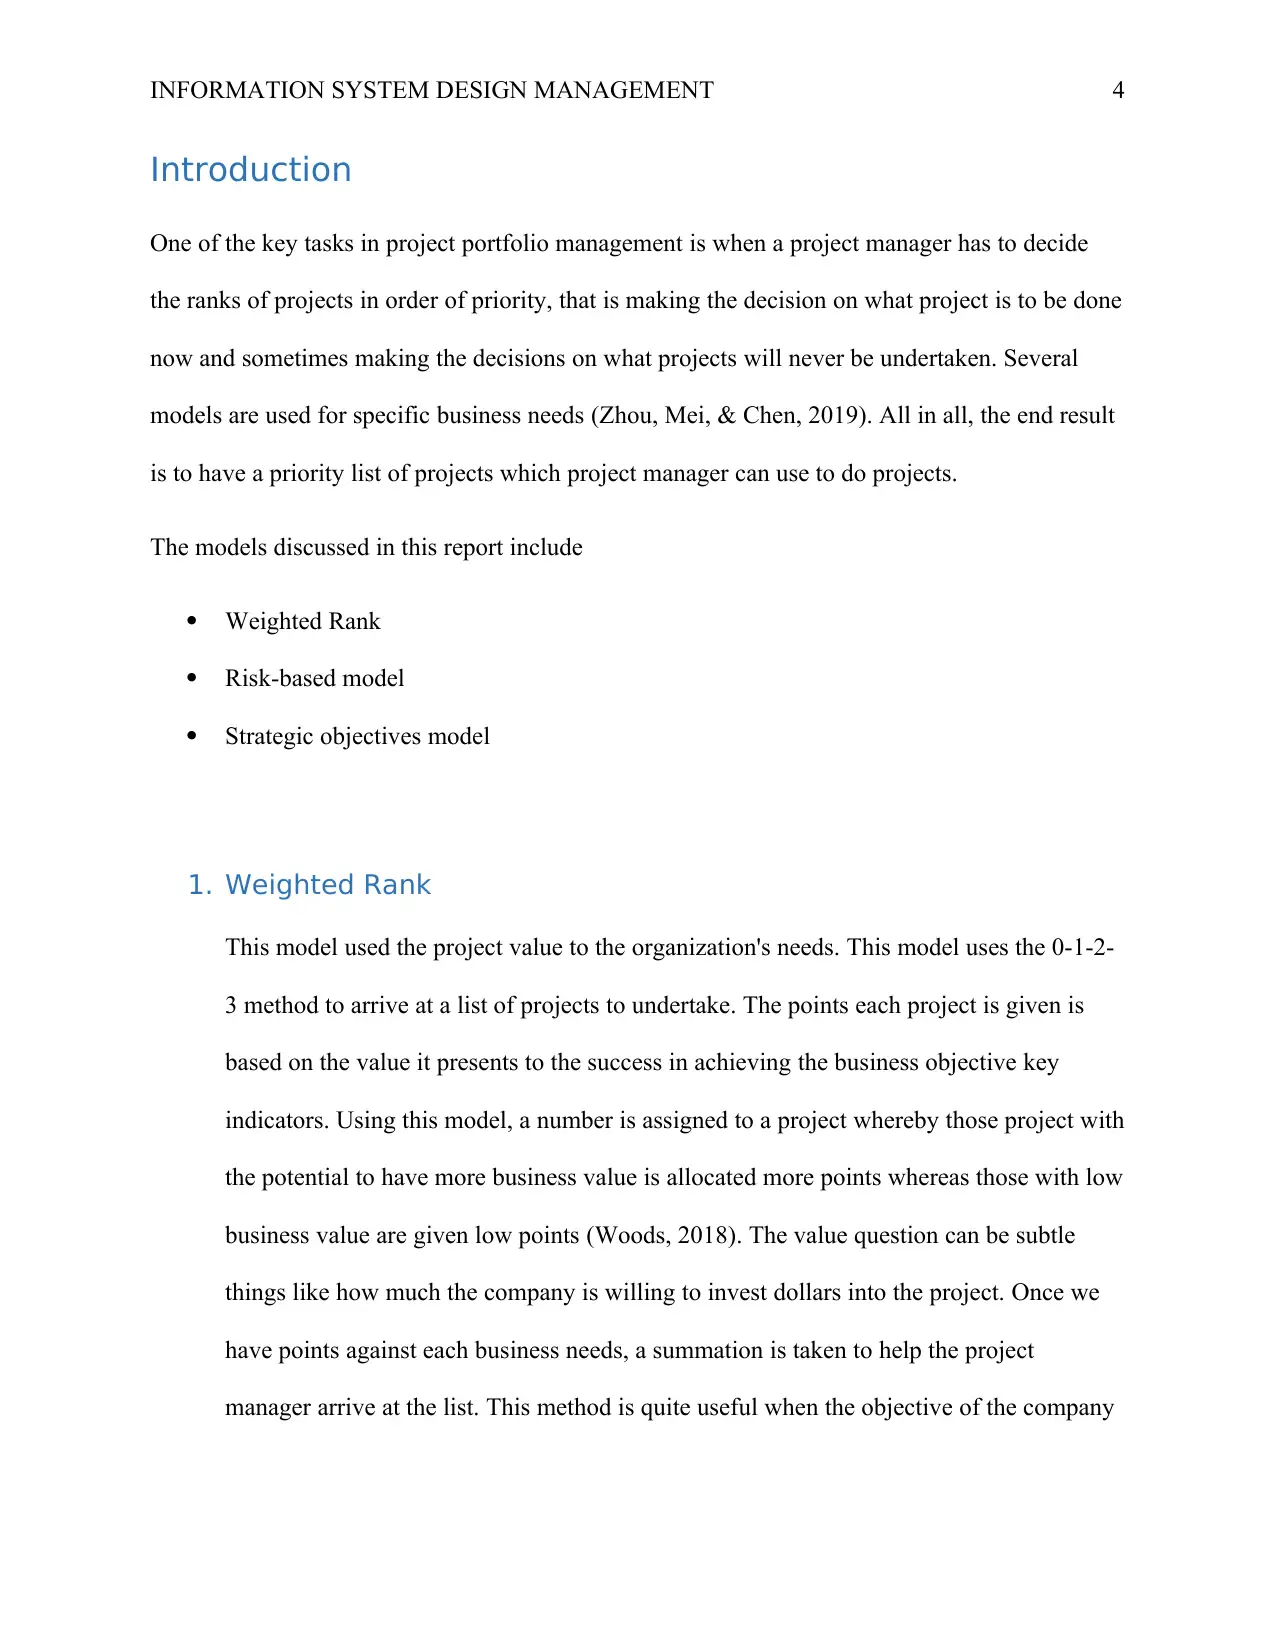
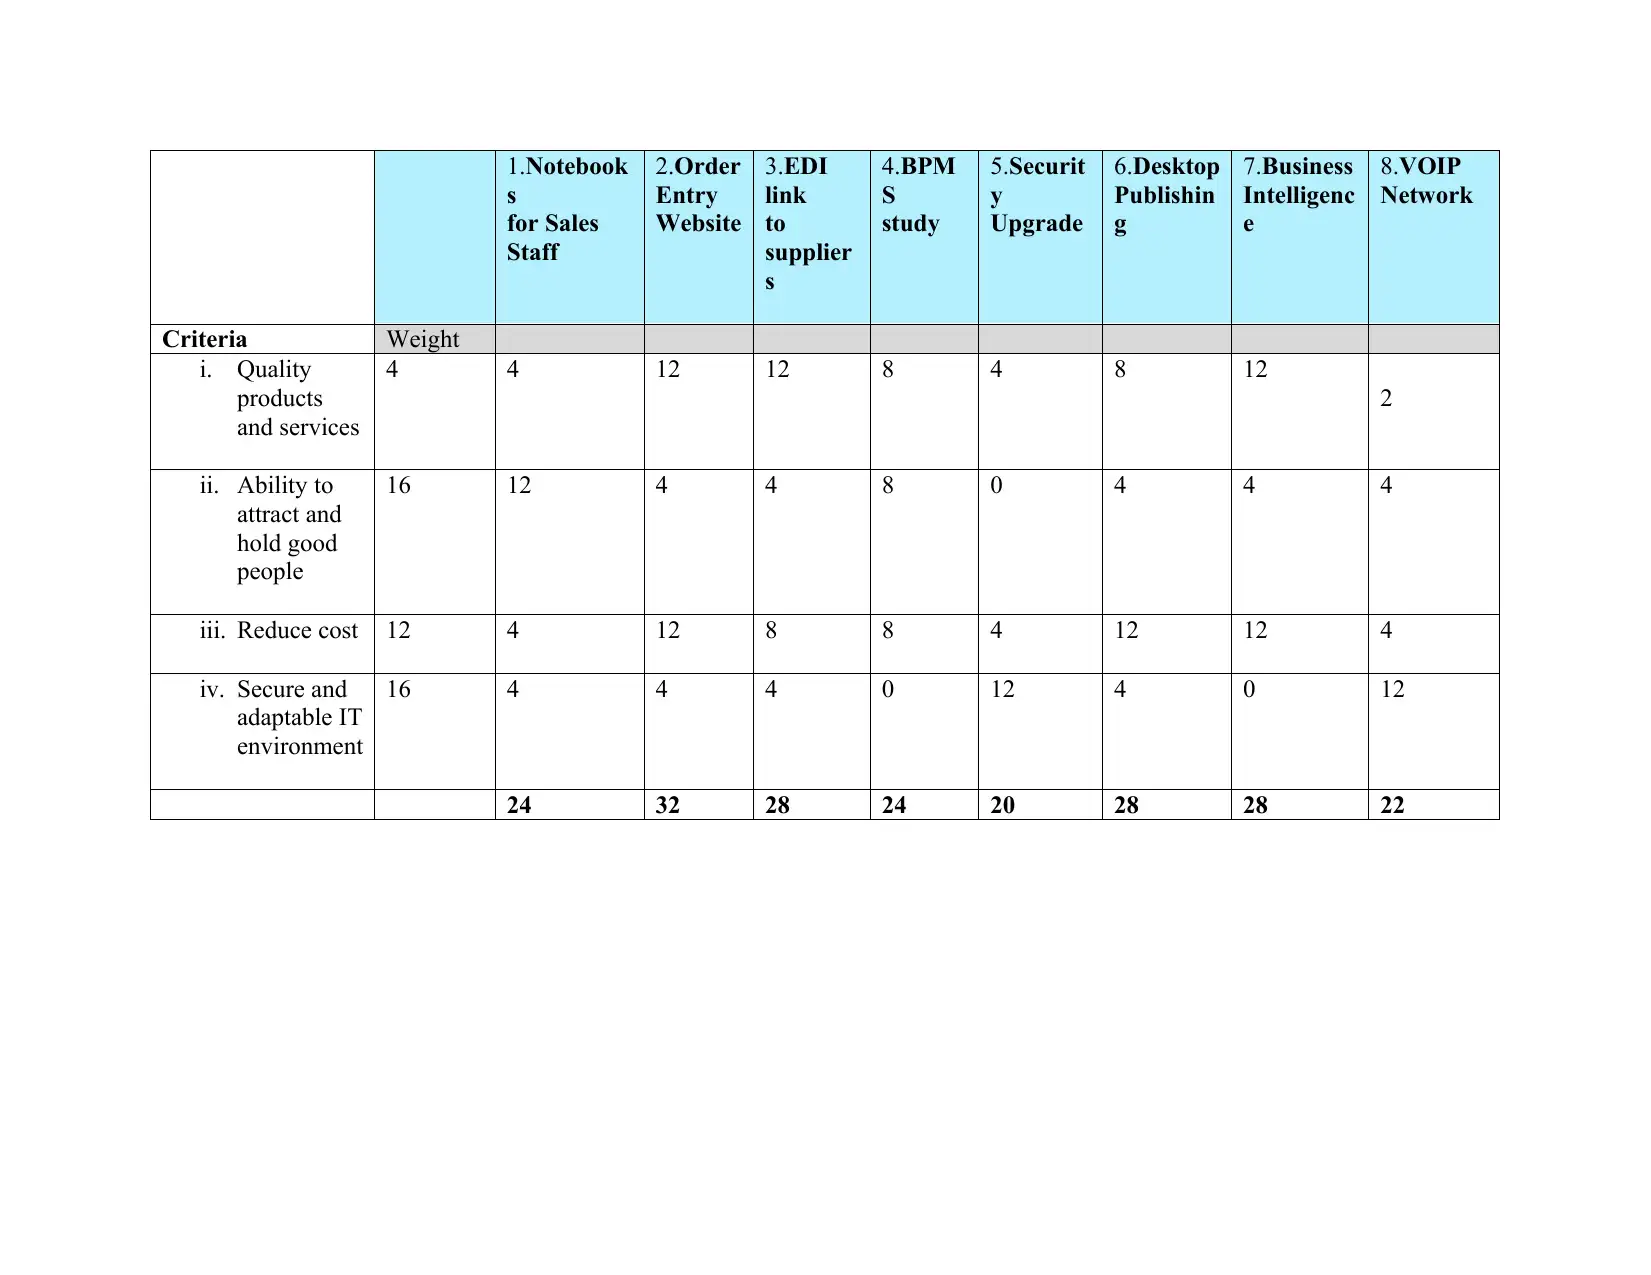
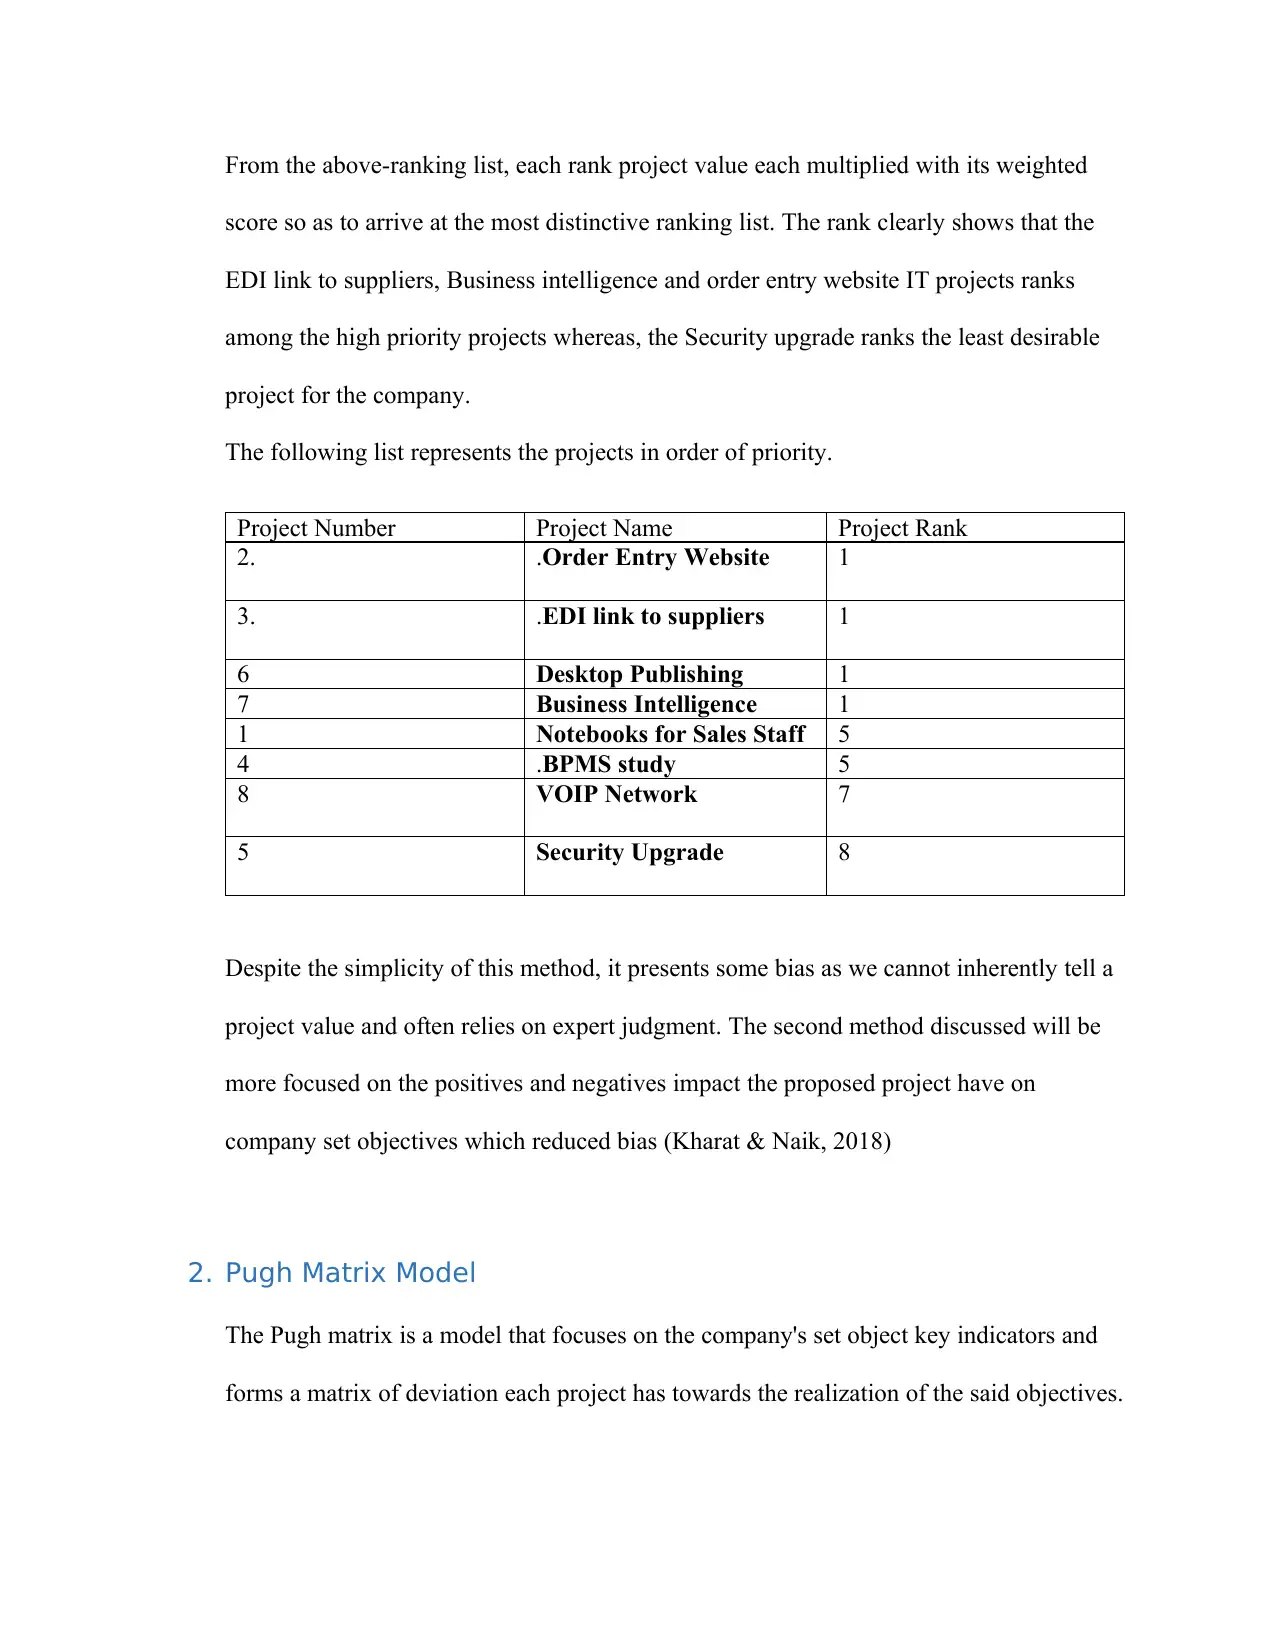
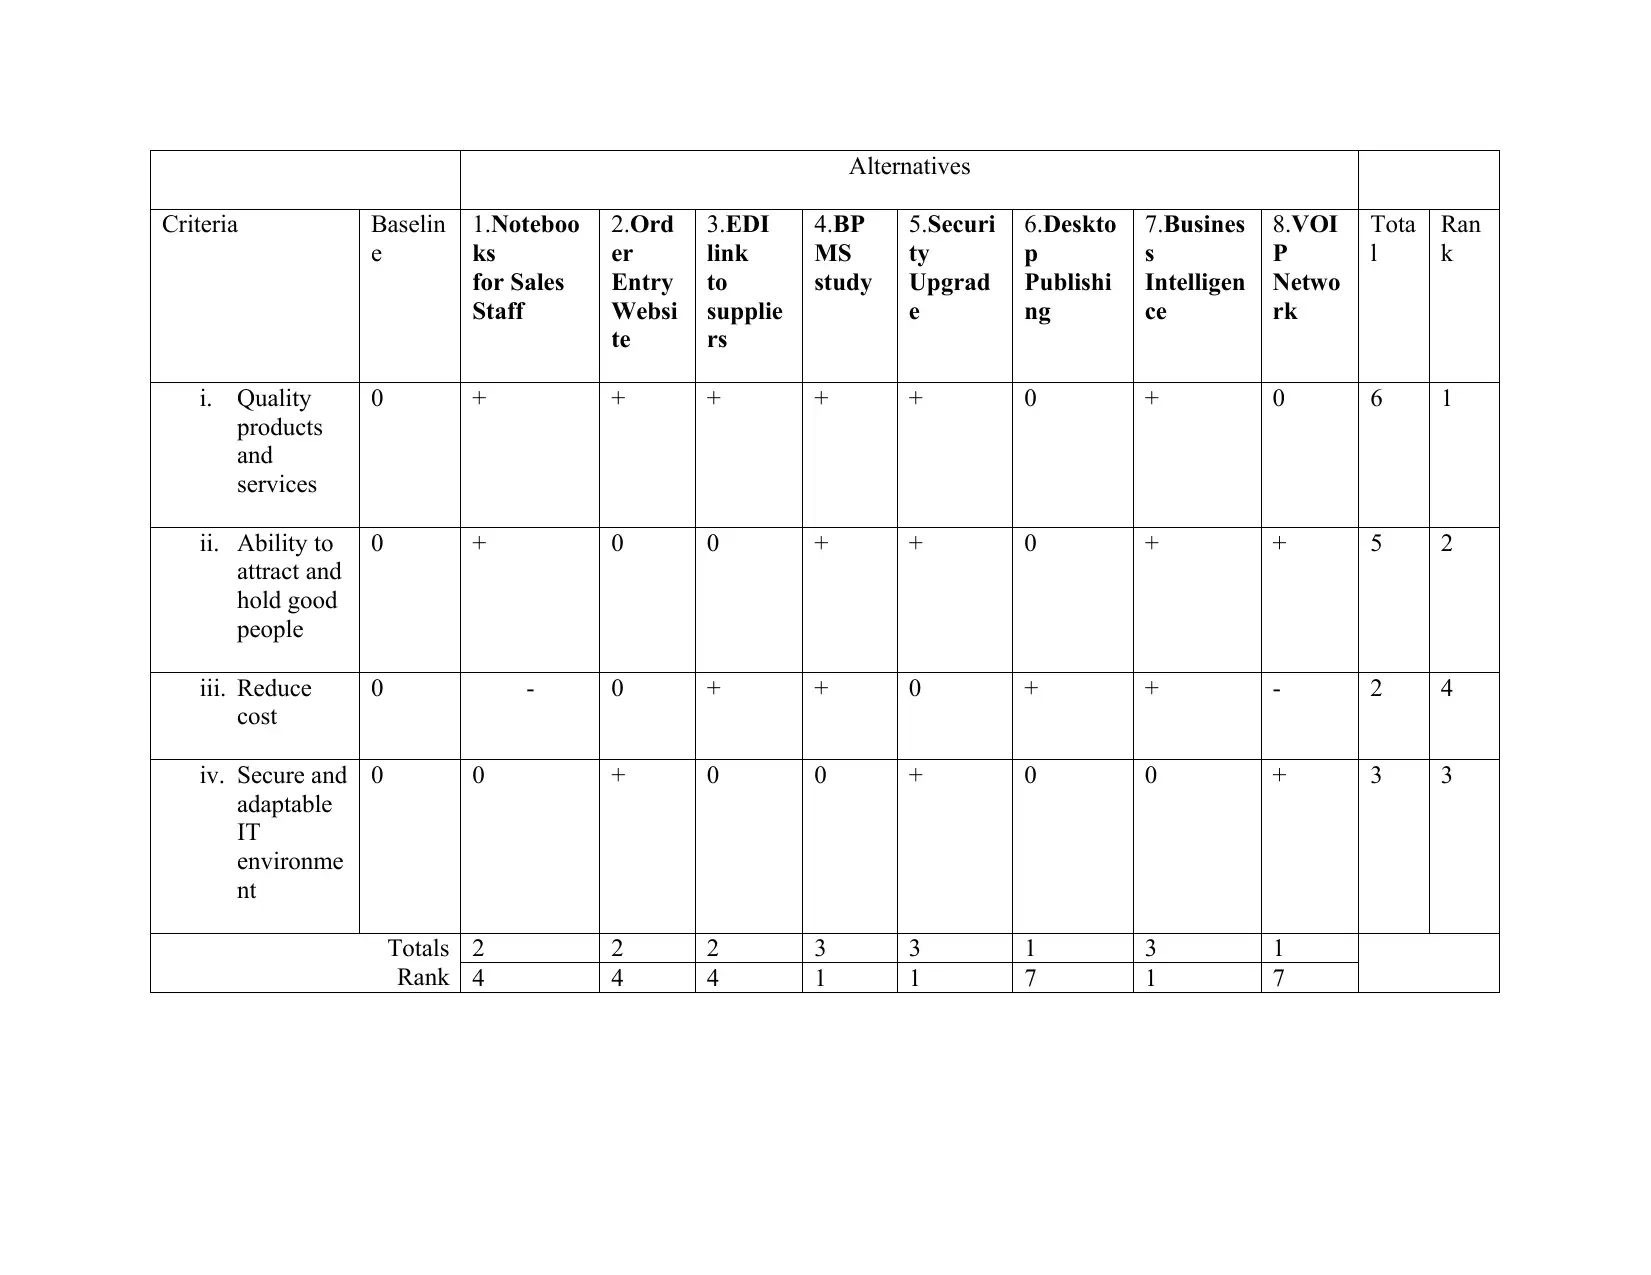
This report, prepared for an ITEC871 assignment, presents an analysis of IT capital projects using the weighted rank and Pugh matrix models for a manufacturing company. The report begins with an executive summary and table of contents, followed by an introduction that highlights the importance of project prioritization in project portfolio management. The weighted rank model is discussed, including its methodology and application to a specific set of projects, along with a detailed ranking list. The Pugh matrix model is then examined, focusing on its use in evaluating projects against key performance indicators. A comparison of the two models is provided, emphasizing their different approaches and suitability for various business contexts. The report concludes with recommendations for the company, emphasizing strategic alignment and the use of technology to achieve business objectives. References to relevant academic literature are also included.
Document Page
Running head: INFORMATION SYSTEM DESIGN MANAGEMENT 1
INFORMATION SYSTEM DESIGN MANAGEMENT
[Author Name(s), First M. Last, Omit Titles and Degrees]
[Institutional Affiliation(s)]
Author Note
[Include any grant/funding information and a complete correspondence address.]
tabler-icon-diamond-filled.svg

Secure Best Marks with AI Grader

Need help grading? Try our AI Grader for instant feedback on your assignments.
Document Page
INFORMATION SYSTEM DESIGN MANAGEMENT 2
Executive Summary
This report was compiled to help the company make informed decision in which projects to
undertake. Based on the two models, the following recommendation have been suggested
1) Put more resources toward the projects that have a statergic alignment to the company
objectives such as the Order entering website
2) Leverage on technology have an EDI link with suppliers so as to attract and retain them
Document Page
INFORMATION SYSTEM DESIGN MANAGEMENT 3
Table of Contents
Executive Summary.........................................................................................................................2
Introduction......................................................................................................................................3
1. Weighted Rank.....................................................................................................................3
2. Pugh Matrix Model...............................................................................................................6
Models Comparison.....................................................................................................................9
Conclusion.....................................................................................................................................10
References......................................................................................................................................10
Document Page
INFORMATION SYSTEM DESIGN MANAGEMENT 4
Introduction
One of the key tasks in project portfolio management is when a project manager has to decide
the ranks of projects in order of priority, that is making the decision on what project is to be done
now and sometimes making the decisions on what projects will never be undertaken. Several
models are used for specific business needs (Zhou, Mei, & Chen, 2019). All in all, the end result
is to have a priority list of projects which project manager can use to do projects.
The models discussed in this report include
Weighted Rank
Risk-based model
Strategic objectives model
1. Weighted Rank
This model used the project value to the organization's needs. This model uses the 0-1-2-
3 method to arrive at a list of projects to undertake. The points each project is given is
based on the value it presents to the success in achieving the business objective key
indicators. Using this model, a number is assigned to a project whereby those project with
the potential to have more business value is allocated more points whereas those with low
business value are given low points (Woods, 2018). The value question can be subtle
things like how much the company is willing to invest dollars into the project. Once we
have points against each business needs, a summation is taken to help the project
manager arrive at the list. This method is quite useful when the objective of the company
tabler-icon-diamond-filled.svg

Secure Best Marks with AI Grader

Need help grading? Try our AI Grader for instant feedback on your assignments.
Document Page
INFORMATION SYSTEM DESIGN MANAGEMENT 5
is set early hence the project manager can align its projects according to the business
needs (Sawik, 2017)
Document Page
1.Notebook
s
for Sales
Staff
2.Order
Entry
Website
3.EDI
link
to
supplier
s
4.BPM
S
study
5.Securit
y
Upgrade
6.Desktop
Publishin
g
7.Business
Intelligenc
e
8.VOIP
Network
Criteria Weight
i. Quality
products
and services
4 4 12 12 8 4 8 12
2
ii. Ability to
attract and
hold good
people
16 12 4 4 8 0 4 4 4
iii. Reduce cost 12 4 12 8 8 4 12 12 4
iv. Secure and
adaptable IT
environment
16 4 4 4 0 12 4 0 12
24 32 28 24 20 28 28 22
Document Page
tabler-icon-diamond-filled.svg

Paraphrase This Document

Need a fresh take? Get an instant paraphrase of this document with our AI Paraphraser
Document Page
From the above-ranking list, each rank project value each multiplied with its weighted
score so as to arrive at the most distinctive ranking list. The rank clearly shows that the
EDI link to suppliers, Business intelligence and order entry website IT projects ranks
among the high priority projects whereas, the Security upgrade ranks the least desirable
project for the company.
The following list represents the projects in order of priority.
Project Number Project Name Project Rank
2. .Order Entry Website 1
3. .EDI link to suppliers 1
6 Desktop Publishing 1
7 Business Intelligence 1
1 Notebooks for Sales Staff 5
4 .BPMS study 5
8 VOIP Network 7
5 Security Upgrade 8
Despite the simplicity of this method, it presents some bias as we cannot inherently tell a
project value and often relies on expert judgment. The second method discussed will be
more focused on the positives and negatives impact the proposed project have on
company set objectives which reduced bias (Kharat & Naik, 2018)
2. Pugh Matrix Model
The Pugh matrix is a model that focuses on the company's set object key indicators and
forms a matrix of deviation each project has towards the realization of the said objectives.
Document Page
In this example, the projects will be scrutinized against the following objective key
indicators
Able to provide quality products
Able to attract and retain good people
Able to reduce cost
Able to ensure secure and adaptable IT environments
Based on the above matrix, a Pugh model is developed by adding a plus for those projects that
have a positive impact on given criteria and having a negative those projects that have a negative
impact. Zero is used for those project that doesn’t have any impact on the given criteria.
This model is suitable for the given scenario since the company has set its baselines from which
projects should fit into.
The figure below shows the Pugh matrix for the scenario.
Document Page
tabler-icon-diamond-filled.svg

Secure Best Marks with AI Grader

Need help grading? Try our AI Grader for instant feedback on your assignments.
Document Page
Alternatives
Criteria Baselin
e
1.Noteboo
ks
for Sales
Staff
2.Ord
er
Entry
Websi
te
3.EDI
link
to
supplie
rs
4.BP
MS
study
5.Securi
ty
Upgrad
e
6.Deskto
p
Publishi
ng
7.Busines
s
Intelligen
ce
8.VOI
P
Netwo
rk
Tota
l
Ran
k
i. Quality
products
and
services
0 + + + + + 0 + 0 6 1
ii. Ability to
attract and
hold good
people
0 + 0 0 + + 0 + + 5 2
iii. Reduce
cost
0 - 0 + + 0 + + - 2 4
iv. Secure and
adaptable
IT
environme
nt
0 0 + 0 0 + 0 0 + 3 3
Totals
Rank
2 2 2 3 3 1 3 1
4 4 4 1 1 7 1 7
Document Page
Document Page
The above Pugh matrix yields the following list of projects in order of priority
Project Number Project Name Rank
4 4.BPMS study 1
5 5.Security Upgrade 1
7 7.Business Intelligence 1
1 1.Notebooks for Sales
Staff
4
2 2.Order
Entry
Website
4
3 3.EDI link
to
suppliers
4
6 6.Desktop
Publishing
7
8 8.VOIP
Network
7
Models Comparison
From the above model description, the two models differ in their approach. While the rank deals
with individual project value relative to each other, the Pugh matrix does the project ranking by
scoring each project against the company objective key indicators. It is therefore vital for the
company to define clear objectives so as to help the project manager (Dahlquist, Farago, &
Tédongap, 2017)
tabler-icon-diamond-filled.svg

Paraphrase This Document

Need a fresh take? Get an instant paraphrase of this document with our AI Paraphraser
Document Page
Conclusion
In conclusion the two models discussed have their pros and cons and each have its unique niche
to operate and yield results to the company
Document Page
References
Baker, H. K., & Filbeck, G. (2013). Portfolio Theory and Management. New York: Oxford
University Press.
Dahlquist, M., Farago, A., & Tédongap, R. (2017). Asymmetries and Portfolio Choice. Review
of Financial Studies, 30(2), 667–702. https://doi.org/10.1093/rfs/hhw091
Jugend, D., Figueiredo, J., & Pinheiro, M. A. P. (2017). Environmental Sustainability and
Product Portfolio Management in Biodiversity Firms: A Comparative Analysis between
Portugal and Brazil. Contemporary Economics, 11(4), 431–441.
Kharat, V. J., & Naik, B. K. R. (2018). Best Practices in Project Portfolio Management for
DYNAMIC DECISION MAKING. Journal of Modern Project Management, 88–95.
Reilly, F. K., & Brown, K. C. (2015). Analysis of investments and management of portfolios.
Cengage Learning. (Bulle Library 332.6).
Sawik, T. (2017). A portfolio approach to supply chain disruption management. International
Journal of Production Research, 55(7), 1970–1991.
https://doi.org/10.1080/00207543.2016.1249432
Woods, J. E. (2018). J. M. Keynes’ influence on institutional portfolio management. Journal of
Post Keynesian Economics, 41(1), 56–82.
https://doi.org/10.1080/01603477.2017.1423232
Zhou, J., Mei, L., & Chen, J. (2019). Leveraging University Competitiveness: Evidence from
Alliance Portfolio Practices at Zhejiang University. Emerging Markets Finance & Trade,
55(4), 827–842. https://doi.org/10.1080/1540496X.2018.1504290
chevron_up_icon
1 out of 15
circle_padding
hide_on_mobile
zoom_out_icon
[object Object]