Comprehensive Financial Analysis: IT Industry, Investment and Risk
VerifiedAdded on 2023/06/17
|15
|4312
|142
Report
AI Summary
This report provides a financial evaluation of the IT industry, examining its position within the business cycle and the impact of COVID-19 and global financial crises. It discusses the Arbitrage Pricing Theory and Fama-French three-factor model, evaluating their advantages and disadvantages. Porter’s Five Forces are applied to analyze industry trends and forecast future movements. The report computes call and put option prices, assesses portfolio performance using Sharpe ratio, Treynor measure, Jensen’s alpha, and the information ratio, and recommends maintaining a 70% debt and 30% equity investment ratio for optimal returns. It also advises using forward contracts and SWAP options to minimize foreign exposure risk. Desklib offers a variety of solved assignments for students.

CAPSTONE
Paraphrase This Document
Need a fresh take? Get an instant paraphrase of this document with our AI Paraphraser
EXECUTIVE SUMMARY
The report has discussed the two theories i.e. Arbitrage Pricing Theory and Fama-French
three factor model along with their advantage and disadvantage. Along with that, the report also
evaluates IT industry and its prevalent trends by implementing Porter’s 5 Forces. This helps in
forecasting the industry movements and practices for next 3 years. On the basis of research
conducted, it was identified that the IT industry can overcome loss in its sales after the Covid and
global financial crises. Further, the call and put option prices have been calculated along with
their limitations. After that, the report computes the four ratios i.e., Sharpe ratio, Treynor
measure, Jensen’s alpha and the information ratio. Lastly, the analysis helped in identifying that
IT industry should maintain debt equity investment ratio at 70% and 30% respectively so that
better returns can be garnered. Also, report recommended that forward contracts and SWAP
options should be preferred to minimise risk in foreign exposure.
Table of Contents
EXECUTIVE SUMMARY.............................................................................................................2
INTRODUCTION...........................................................................................................................4
QUESTION 1..................................................................................................................................4
QUESTION 2..................................................................................................................................6
Question: 3.......................................................................................................................................8
Computation of call and option prices.........................................................................................8
Question 4......................................................................................................................................11
CONCLUSION..............................................................................................................................12
RECOMMENDATION.................................................................................................................12
REFERENCES................................................................................................................................1
⊘ This is a preview!⊘
Do you want full access?
Subscribe today to unlock all pages.
Trusted by 1+ million students worldwide
INTRODUCTION
The present report is based on financial evaluation of various components of the
economy such as industry, stock market and derivative market. In this report, major emphasis
will be given on Information technology or IT industry by evaluating the position of the industry
within the business cycle through various economic indicators. The various factors that has affect
the performance of IT industry during the pandemic 19 will be critically analysed in this report to
highlight how the industry get affected due to the onset of COVID – 19 and what would be the
outlook of this industry in the next three years. Before this, it will be explained that why
academics and practitioners generally use or avoid the arbitrage pricing theory and Fama-French
three-factor model in an attempt to predict the asset prices. Further, the report will include the
valuation of call and put option by applying Black-Scholes model along with the explanation of
uses and limitations of call and put options and the results derived from this model. At last, in
this report, the portfolio of WealthPlus will be evaluated through various measures such as
Sharpe ratio, Traynor ratio, Jensen's alpha and information ratio to indicate whether the portfolio
is outperforming or underperforming than the market. The usefulness and reliability of all these
measures will also be included in this report. The report will be ended by recommending the best
asset class, where to allocate resources and what strategy should the investor or fund manager
should adopt by considering the global financial crisis within the Australian economy.
QUESTION 1
Arbitrage Pricing Theory Model
This is a pricing models with the help of which the returns on the assets can be determine using
the linear relationship between the assets expected return and a number of macroeconomics
variable (Lane and Milesi-Ferretti, 2018). The variables must capture the systematic risk. It is
best for analysing the portfolio for the purpose of investing and identifying securities which is
temporarily mispriced. The formula of Arbitrage Pricing Theory is
E(R)i=E(R)z+(E(I)−E(R)z) ×βn
Where E(R)I = Expected return on the assets
E(R)z = Risk-free rate of return
E(I) = Risk premium attached with i
βn = Sensitivity of the assets price to macroeconomic factor n
Paraphrase This Document
Need a fresh take? Get an instant paraphrase of this document with our AI Paraphraser
Why academics and practitioner use this theory?
They use this theory because of its various benefits which are as follows:
The restriction related to information required to predict the returns of the assets in APT
theory is fewer as compared to any other pricing model.
It helps the investors to know about the specific stock’s direction with the help of
multiple risk factor examinations. The various sources of risk are included in the dataset
which make this theory best from others (Harijanto Rahmawaty and Entang, 2021).
It does not offer specific factors rather than this theory look out the four factors such as
change in inflation, industrial production, shift in risk premium and interest rates.
The presence of unanticipated change helps the investors to identify the assets that have
strongest potential for growth or failure.
Why academics and practitioner do not use this theory?
They do not use APT theory because of its disadvantage which includes the following:
It generates large amount of data which require lot of time for sorting and sometime
result of unfamiliar data create loss to the investors. This makes the tool useless.
Because of the non-clear perception of the sources and level of risks, the accurate and
reasonable estimates are not identifying (Bodie, Kane & Marcus, 2020).
The APT theory does not provide guarantee of results thus is not used by the investors in
wide range. It is because some risks are not real risk.
Fama-French (FF) Three Factor Model
This is also an assets pricing model which is developed in the year 1992. This is the expansion of
capital assets pricing model (CAPM) which consist of three factors such as size of firms, book-
to-market value and excess return on the market factor (Spears, 2020). Because of this addition,
the model has given the outperforming tendency and the formula of which is
Rit−Rft=αit+β1(RMt−Rft) +β2SMBt+β3HMLt+ϵit.
Where Rit = total return of a stock or portfolio
Rft = risk free rate of return
RMt=total market portfolio returns at time t
Rit−Rft=expected excess return
RMt−Rft=excess return on the market portfolio (index)
SMBt=size premium (small minus big)
HMLt=value premium (high minus low)
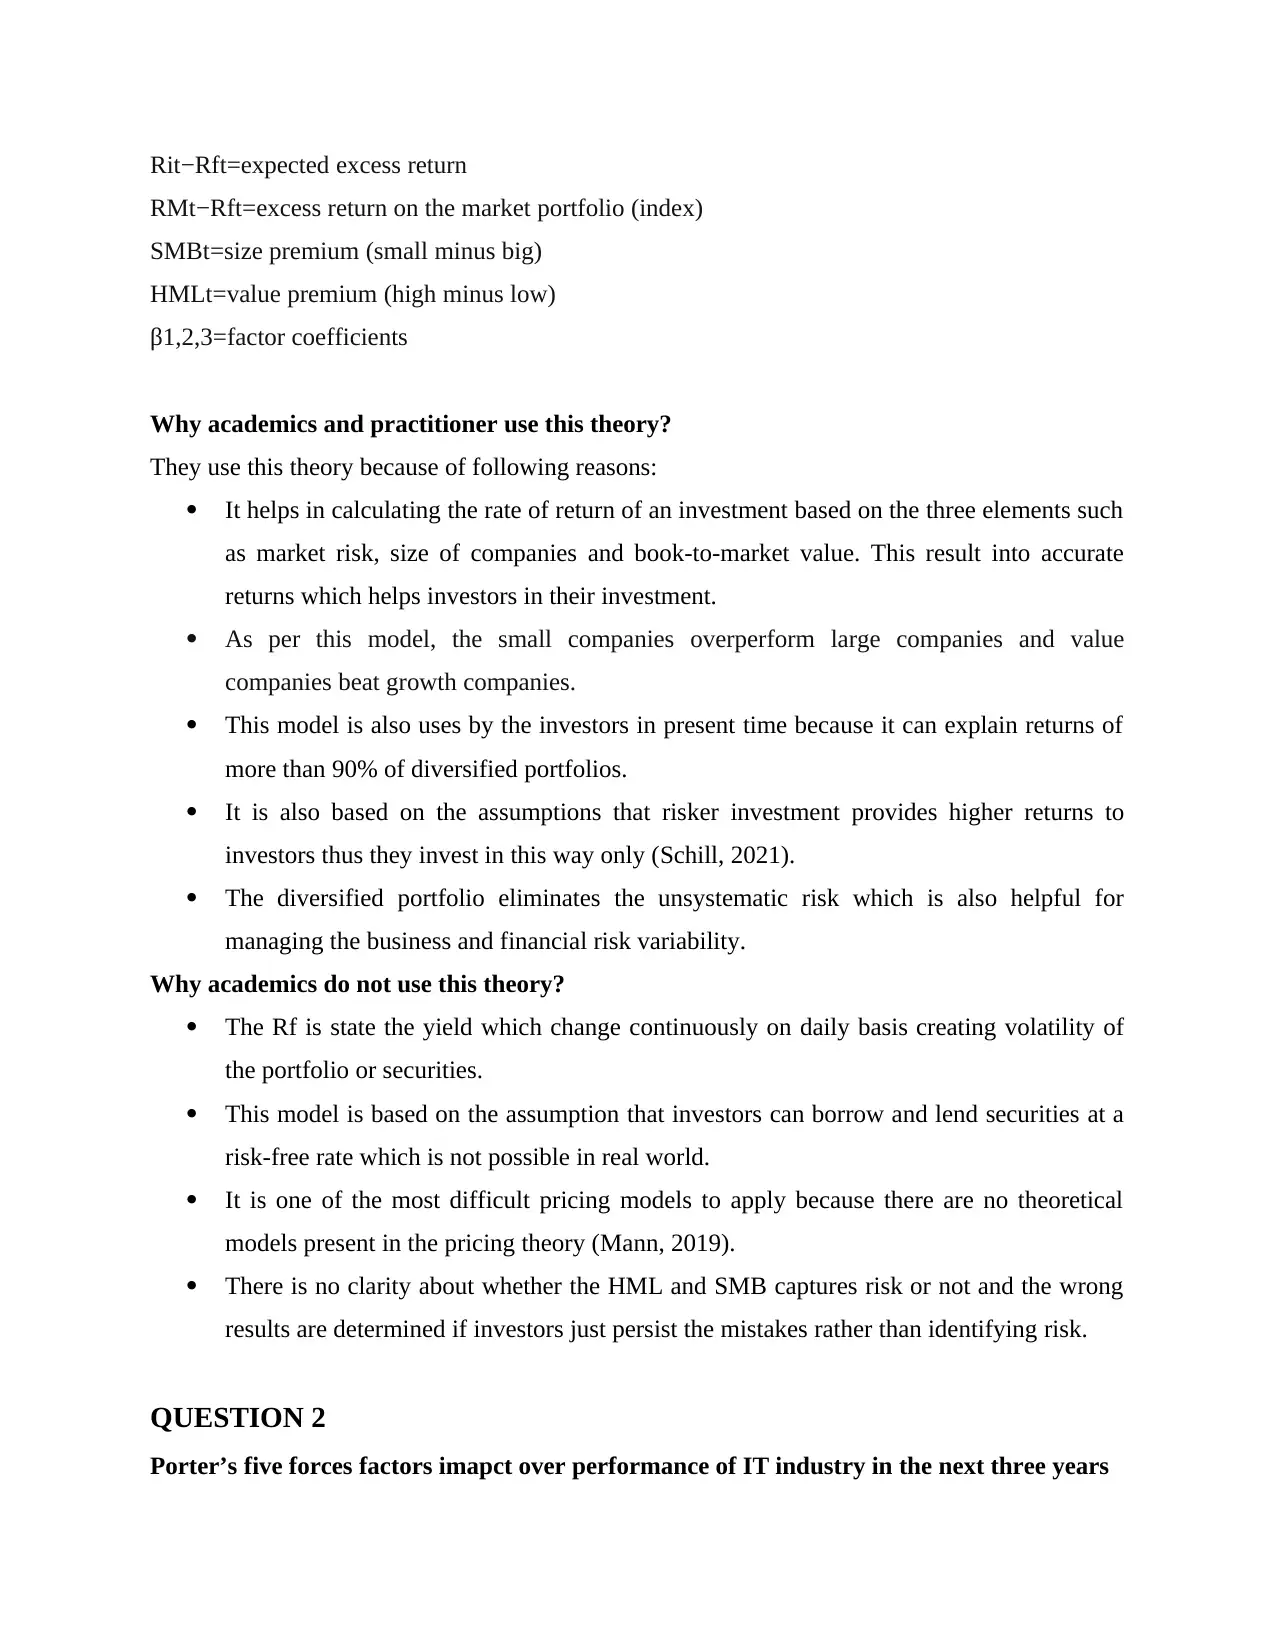
β1,2,3=factor coefficients
Why academics and practitioner use this theory?
They use this theory because of following reasons:
It helps in calculating the rate of return of an investment based on the three elements such
as market risk, size of companies and book-to-market value. This result into accurate
returns which helps investors in their investment.
As per this model, the small companies overperform large companies and value
companies beat growth companies.
This model is also uses by the investors in present time because it can explain returns of
more than 90% of diversified portfolios.
It is also based on the assumptions that risker investment provides higher returns to
investors thus they invest in this way only (Schill, 2021).
The diversified portfolio eliminates the unsystematic risk which is also helpful for
managing the business and financial risk variability.
Why academics do not use this theory?
The Rf is state the yield which change continuously on daily basis creating volatility of
the portfolio or securities.
This model is based on the assumption that investors can borrow and lend securities at a
risk-free rate which is not possible in real world.
It is one of the most difficult pricing models to apply because there are no theoretical
models present in the pricing theory (Mann, 2019).
There is no clarity about whether the HML and SMB captures risk or not and the wrong
results are determined if investors just persist the mistakes rather than identifying risk.
QUESTION 2
Porter’s five forces factors imapct over performance of IT industry in the next three years
RMt−Rft=excess return on the market portfolio (index)
SMBt=size premium (small minus big)
HMLt=value premium (high minus low)
β1,2,3=factor coefficients
Why academics and practitioner use this theory?
They use this theory because of following reasons:
It helps in calculating the rate of return of an investment based on the three elements such
as market risk, size of companies and book-to-market value. This result into accurate
returns which helps investors in their investment.
As per this model, the small companies overperform large companies and value
companies beat growth companies.
This model is also uses by the investors in present time because it can explain returns of
more than 90% of diversified portfolios.
It is also based on the assumptions that risker investment provides higher returns to
investors thus they invest in this way only (Schill, 2021).
The diversified portfolio eliminates the unsystematic risk which is also helpful for
managing the business and financial risk variability.
Why academics do not use this theory?
The Rf is state the yield which change continuously on daily basis creating volatility of
the portfolio or securities.
This model is based on the assumption that investors can borrow and lend securities at a
risk-free rate which is not possible in real world.
It is one of the most difficult pricing models to apply because there are no theoretical
models present in the pricing theory (Mann, 2019).
There is no clarity about whether the HML and SMB captures risk or not and the wrong
results are determined if investors just persist the mistakes rather than identifying risk.
QUESTION 2
Porter’s five forces factors imapct over performance of IT industry in the next three years
⊘ This is a preview!⊘
Do you want full access?
Subscribe today to unlock all pages.
Trusted by 1+ million students worldwide
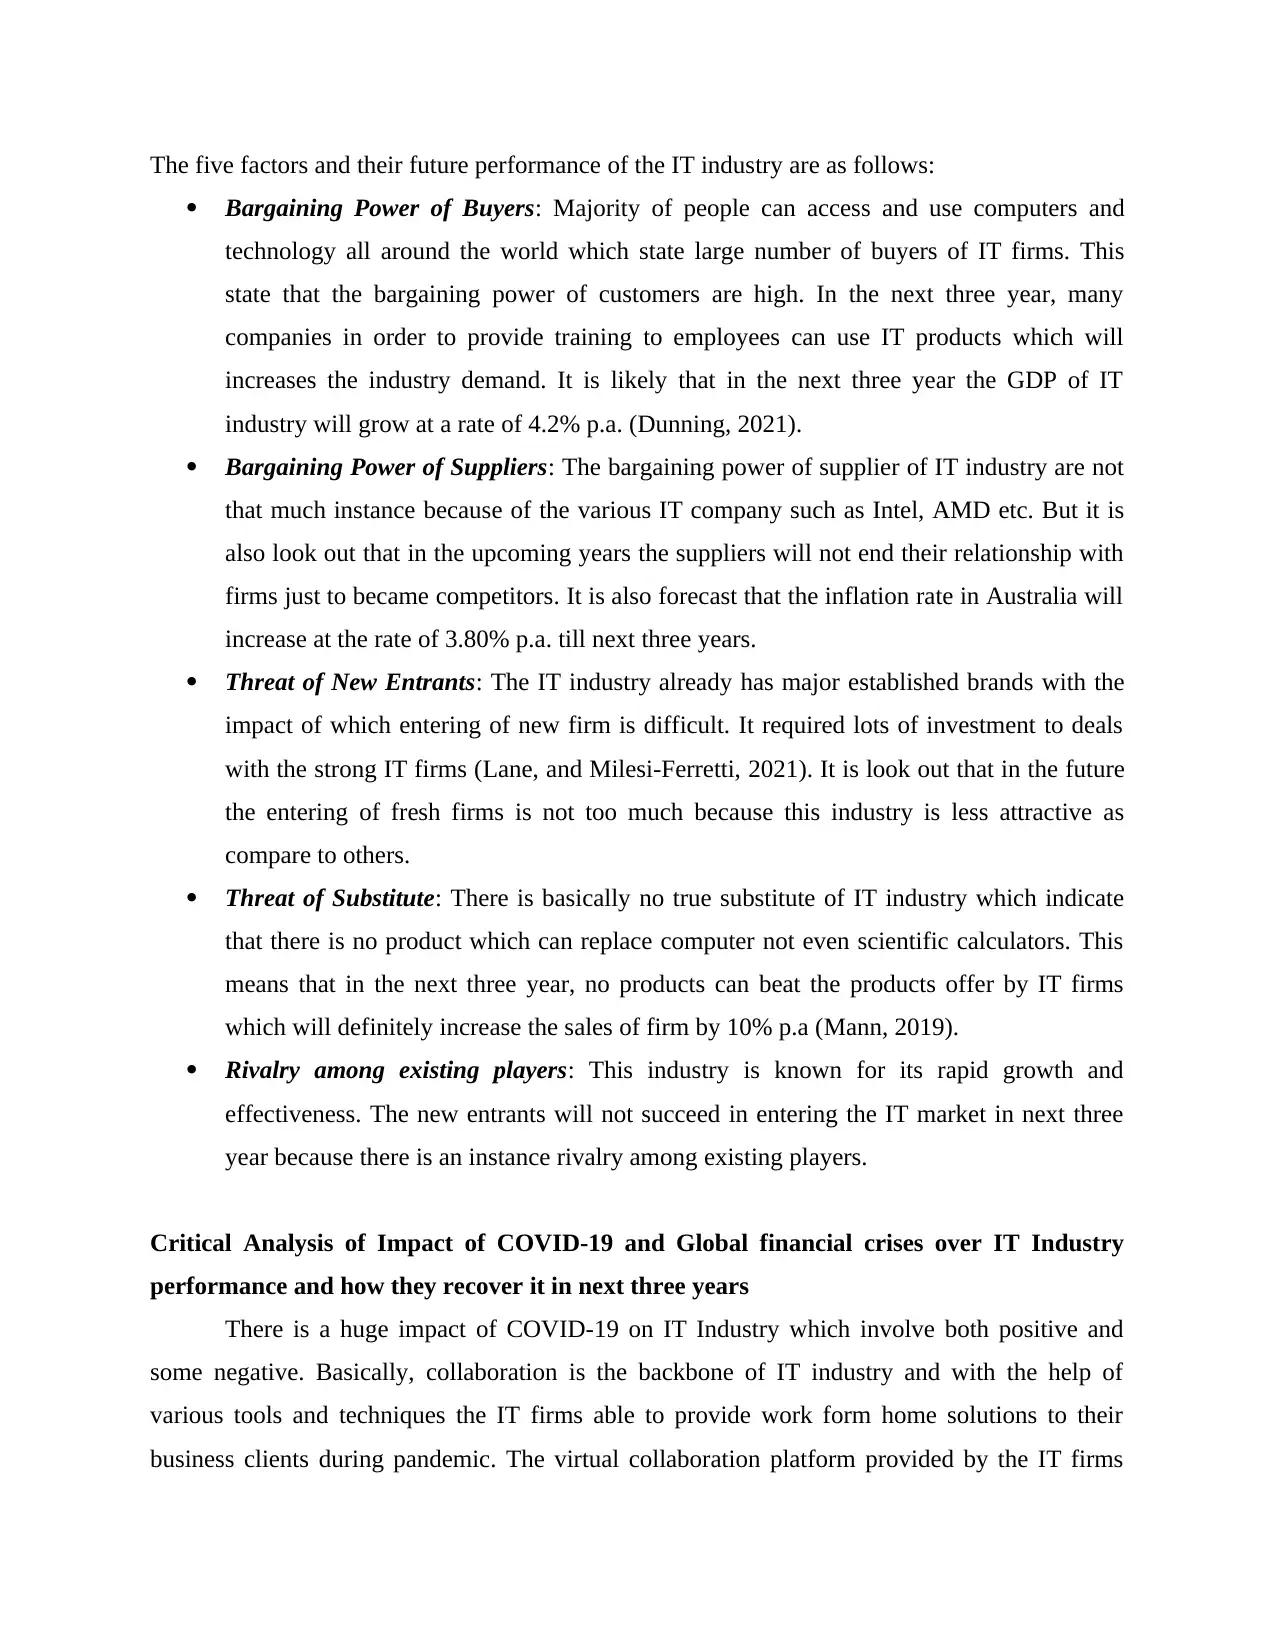
The five factors and their future performance of the IT industry are as follows:
Bargaining Power of Buyers: Majority of people can access and use computers and
technology all around the world which state large number of buyers of IT firms. This
state that the bargaining power of customers are high. In the next three year, many
companies in order to provide training to employees can use IT products which will
increases the industry demand. It is likely that in the next three year the GDP of IT
industry will grow at a rate of 4.2% p.a. (Dunning, 2021).
Bargaining Power of Suppliers: The bargaining power of supplier of IT industry are not
that much instance because of the various IT company such as Intel, AMD etc. But it is
also look out that in the upcoming years the suppliers will not end their relationship with
firms just to became competitors. It is also forecast that the inflation rate in Australia will
increase at the rate of 3.80% p.a. till next three years.
Threat of New Entrants: The IT industry already has major established brands with the
impact of which entering of new firm is difficult. It required lots of investment to deals
with the strong IT firms (Lane, and Milesi-Ferretti, 2021). It is look out that in the future
the entering of fresh firms is not too much because this industry is less attractive as
compare to others.
Threat of Substitute: There is basically no true substitute of IT industry which indicate
that there is no product which can replace computer not even scientific calculators. This
means that in the next three year, no products can beat the products offer by IT firms
which will definitely increase the sales of firm by 10% p.a (Mann, 2019).
Rivalry among existing players: This industry is known for its rapid growth and
effectiveness. The new entrants will not succeed in entering the IT market in next three
year because there is an instance rivalry among existing players.
Critical Analysis of Impact of COVID-19 and Global financial crises over IT Industry
performance and how they recover it in next three years
There is a huge impact of COVID-19 on IT Industry which involve both positive and
some negative. Basically, collaboration is the backbone of IT industry and with the help of
various tools and techniques the IT firms able to provide work form home solutions to their
business clients during pandemic. The virtual collaboration platform provided by the IT firms
Paraphrase This Document
Need a fresh take? Get an instant paraphrase of this document with our AI Paraphraser
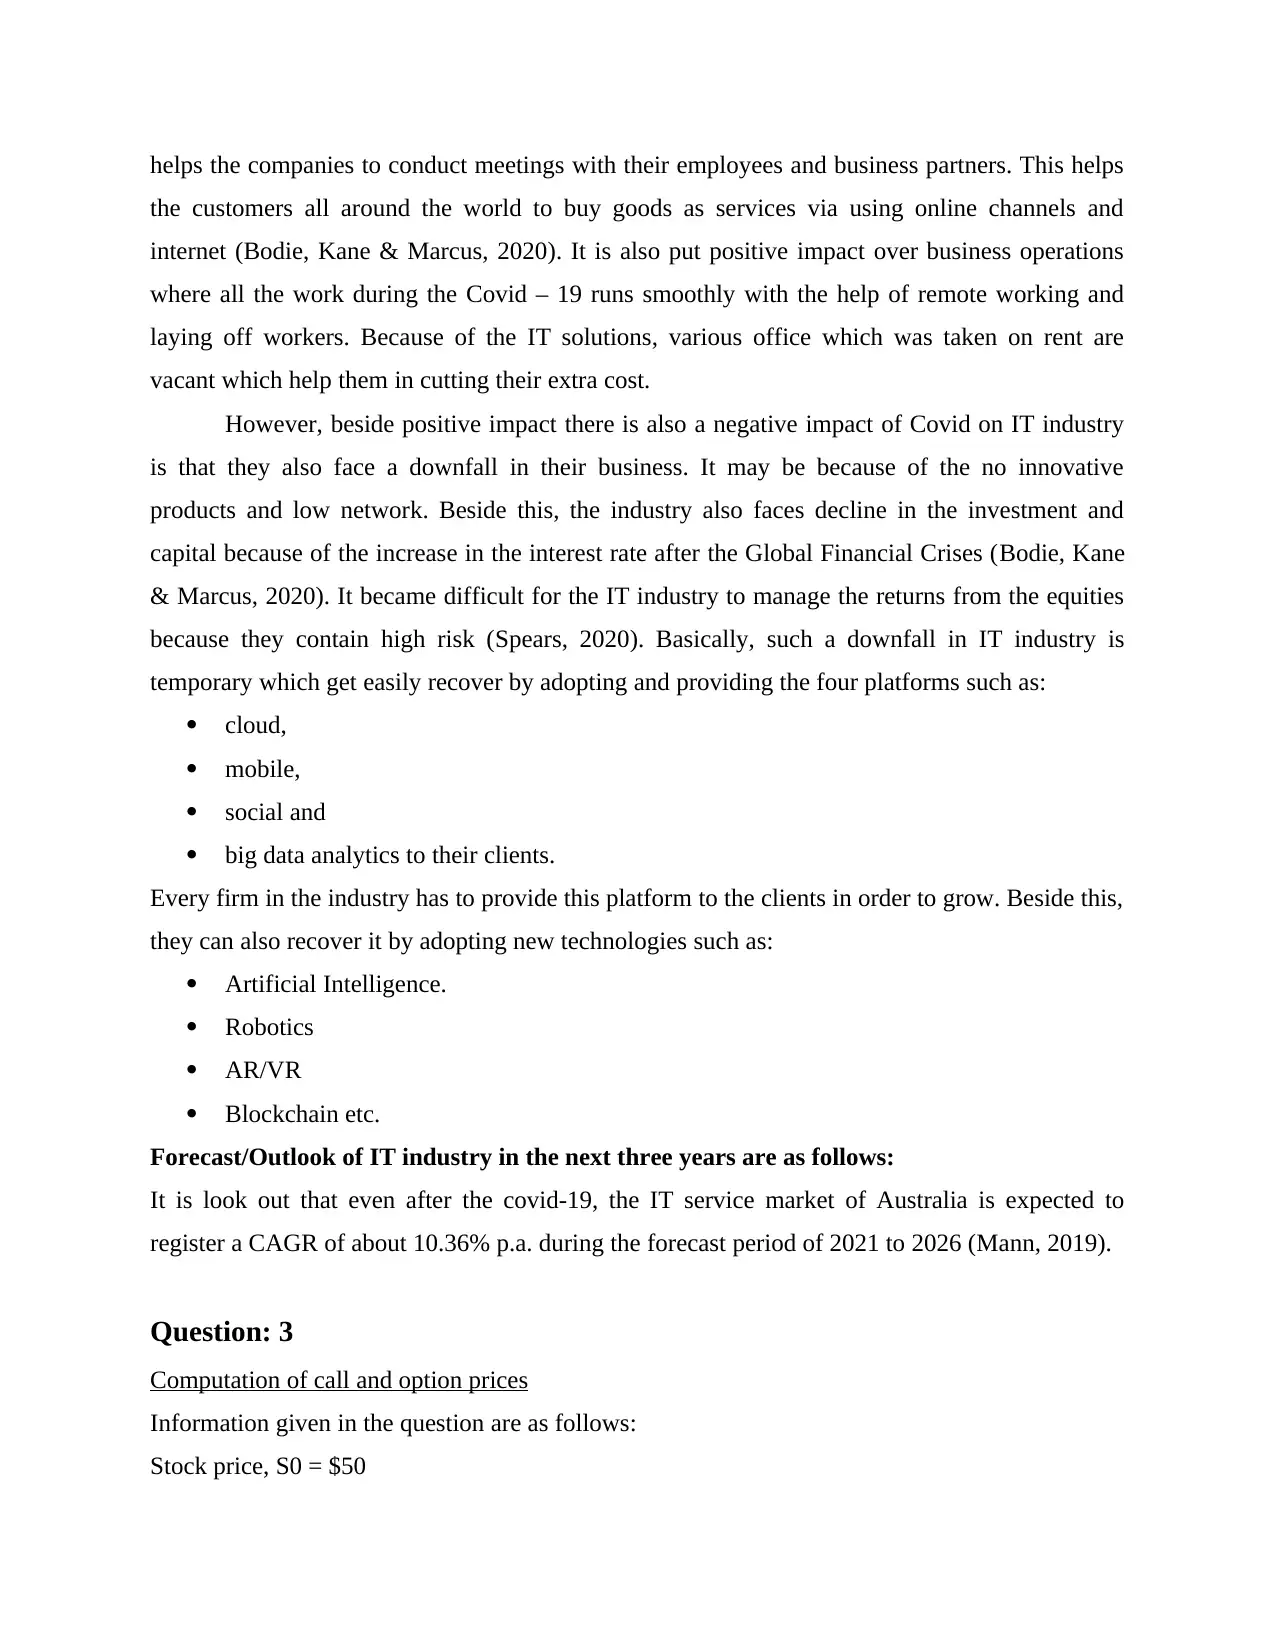
helps the companies to conduct meetings with their employees and business partners. This helps
the customers all around the world to buy goods as services via using online channels and
internet (Bodie, Kane & Marcus, 2020). It is also put positive impact over business operations
where all the work during the Covid – 19 runs smoothly with the help of remote working and
laying off workers. Because of the IT solutions, various office which was taken on rent are
vacant which help them in cutting their extra cost.
However, beside positive impact there is also a negative impact of Covid on IT industry
is that they also face a downfall in their business. It may be because of the no innovative
products and low network. Beside this, the industry also faces decline in the investment and
capital because of the increase in the interest rate after the Global Financial Crises (Bodie, Kane
& Marcus, 2020). It became difficult for the IT industry to manage the returns from the equities
because they contain high risk (Spears, 2020). Basically, such a downfall in IT industry is
temporary which get easily recover by adopting and providing the four platforms such as:
cloud,
mobile,
social and
big data analytics to their clients.
Every firm in the industry has to provide this platform to the clients in order to grow. Beside this,
they can also recover it by adopting new technologies such as:
Artificial Intelligence.
Robotics
AR/VR
Blockchain etc.
Forecast/Outlook of IT industry in the next three years are as follows:
It is look out that even after the covid-19, the IT service market of Australia is expected to
register a CAGR of about 10.36% p.a. during the forecast period of 2021 to 2026 (Mann, 2019).
Question: 3
Computation of call and option prices
Information given in the question are as follows:
Stock price, S0 = $50
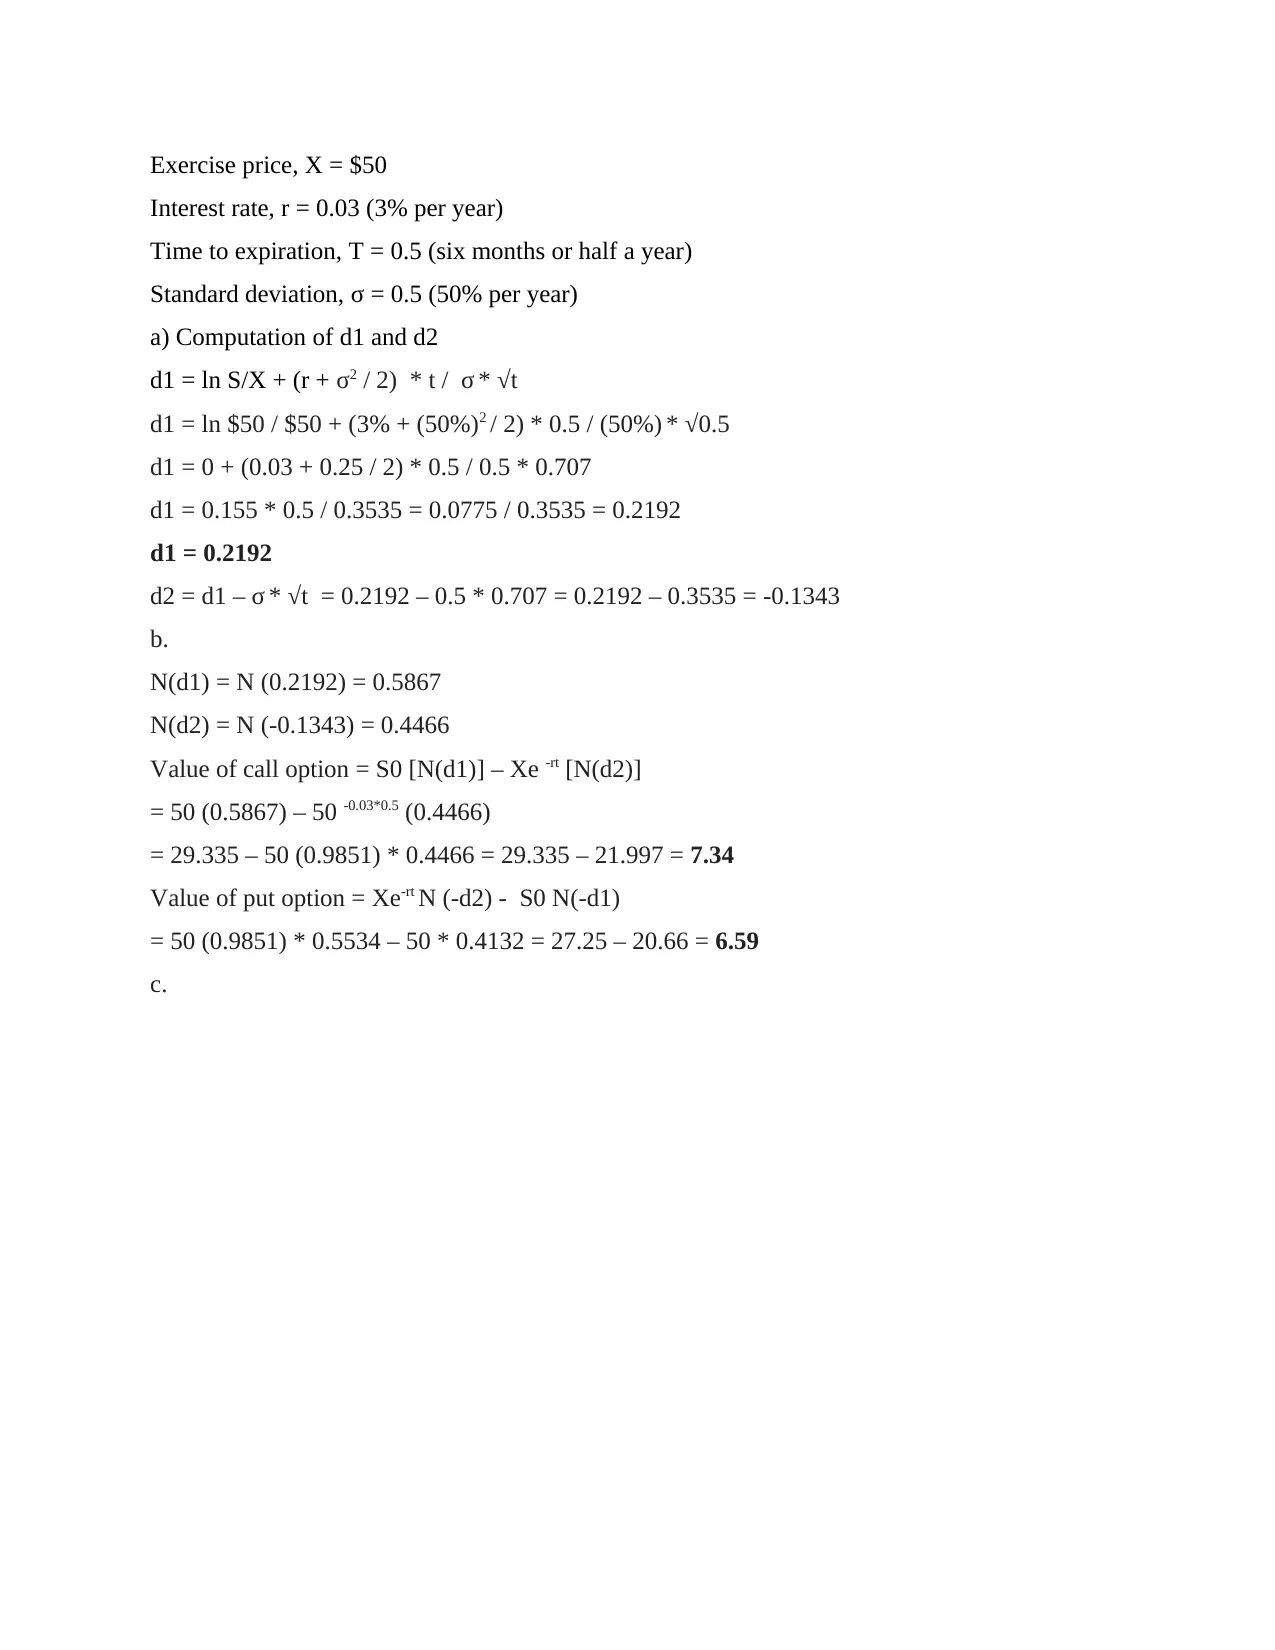
Exercise price, X = $50
Interest rate, r = 0.03 (3% per year)
Time to expiration, T = 0.5 (six months or half a year)
Standard deviation, σ = 0.5 (50% per year)
a) Computation of d1 and d2
d1 = ln S/X + (r + σ2 / 2) * t / σ * √t
d1 = ln $50 / $50 + (3% + (50%)2 / 2) * 0.5 / (50%) * √0.5
d1 = 0 + (0.03 + 0.25 / 2) * 0.5 / 0.5 * 0.707
d1 = 0.155 * 0.5 / 0.3535 = 0.0775 / 0.3535 = 0.2192
d1 = 0.2192
d2 = d1 – σ * √t = 0.2192 – 0.5 * 0.707 = 0.2192 – 0.3535 = -0.1343
b.
N(d1) = N (0.2192) = 0.5867
N(d2) = N (-0.1343) = 0.4466
Value of call option = S0 [N(d1)] – Xe -rt [N(d2)]
= 50 (0.5867) – 50 -0.03*0.5 (0.4466)
= 29.335 – 50 (0.9851) * 0.4466 = 29.335 – 21.997 = 7.34
Value of put option = Xe-rt N (-d2) - S0 N(-d1)
= 50 (0.9851) * 0.5534 – 50 * 0.4132 = 27.25 – 20.66 = 6.59
c.
⊘ This is a preview!⊘
Do you want full access?
Subscribe today to unlock all pages.
Trusted by 1+ million students worldwide
Uses of call and put options
The call option is used to gives its buyer the right but not an obligation to purchase the
underlying securities or an asset after the expiration of a specified time period at a
specified price (Gulen, Popescu and Sari, 2019).
The put option is used to provide its holder the right but not an obligation to sell the
underlying security or asset after the expiration of a specified time period at a specified
price.
Both options are used for the purpose of speculation and hedging.
Call option is used when the price of the stock is expected to rise in the market and the option
holder is planning to buy the stock at some future date.
Put option is being used when the price of the stock in the market is expected to go down and
the option holder is planning to sell the stock at some future date (Dar and Anuradha,
2018).
Both of these options are used to hedge the position against price volatility.
Limitations of call and put options
The premium paid on call option get 100% lost if the option is out of the money.
The options do not traded one on one with the underlying asset where if the price of
underlying gets changed by $1, the option price changed just by 0.7 cents.
If the price of the underlying asset moves in the opposite direction of what has been
expected by the trader, there must be a substantial losses for the option holder. When the liquidity of the options have poor liquidity, then the trader may face difficulty
in entering and exiting from and in the option market (Edeki, Ugbebor and Owoloko,
2017).
Uses and limitations of results obtained through Blackscholes Model
The results obtained through this model is useful as it has identified the value of call and
options by giving considerations risk and time factors.
The results are useful in determining whether the actual price is representing a better
value or not by comparing it with objective theoretical price (Dar and Anuradha, 2018).
The value of the call option increases with the increase in the stock price and value of the
put option increases with the decrease in stock prices in the market.
Paraphrase This Document
Need a fresh take? Get an instant paraphrase of this document with our AI Paraphraser
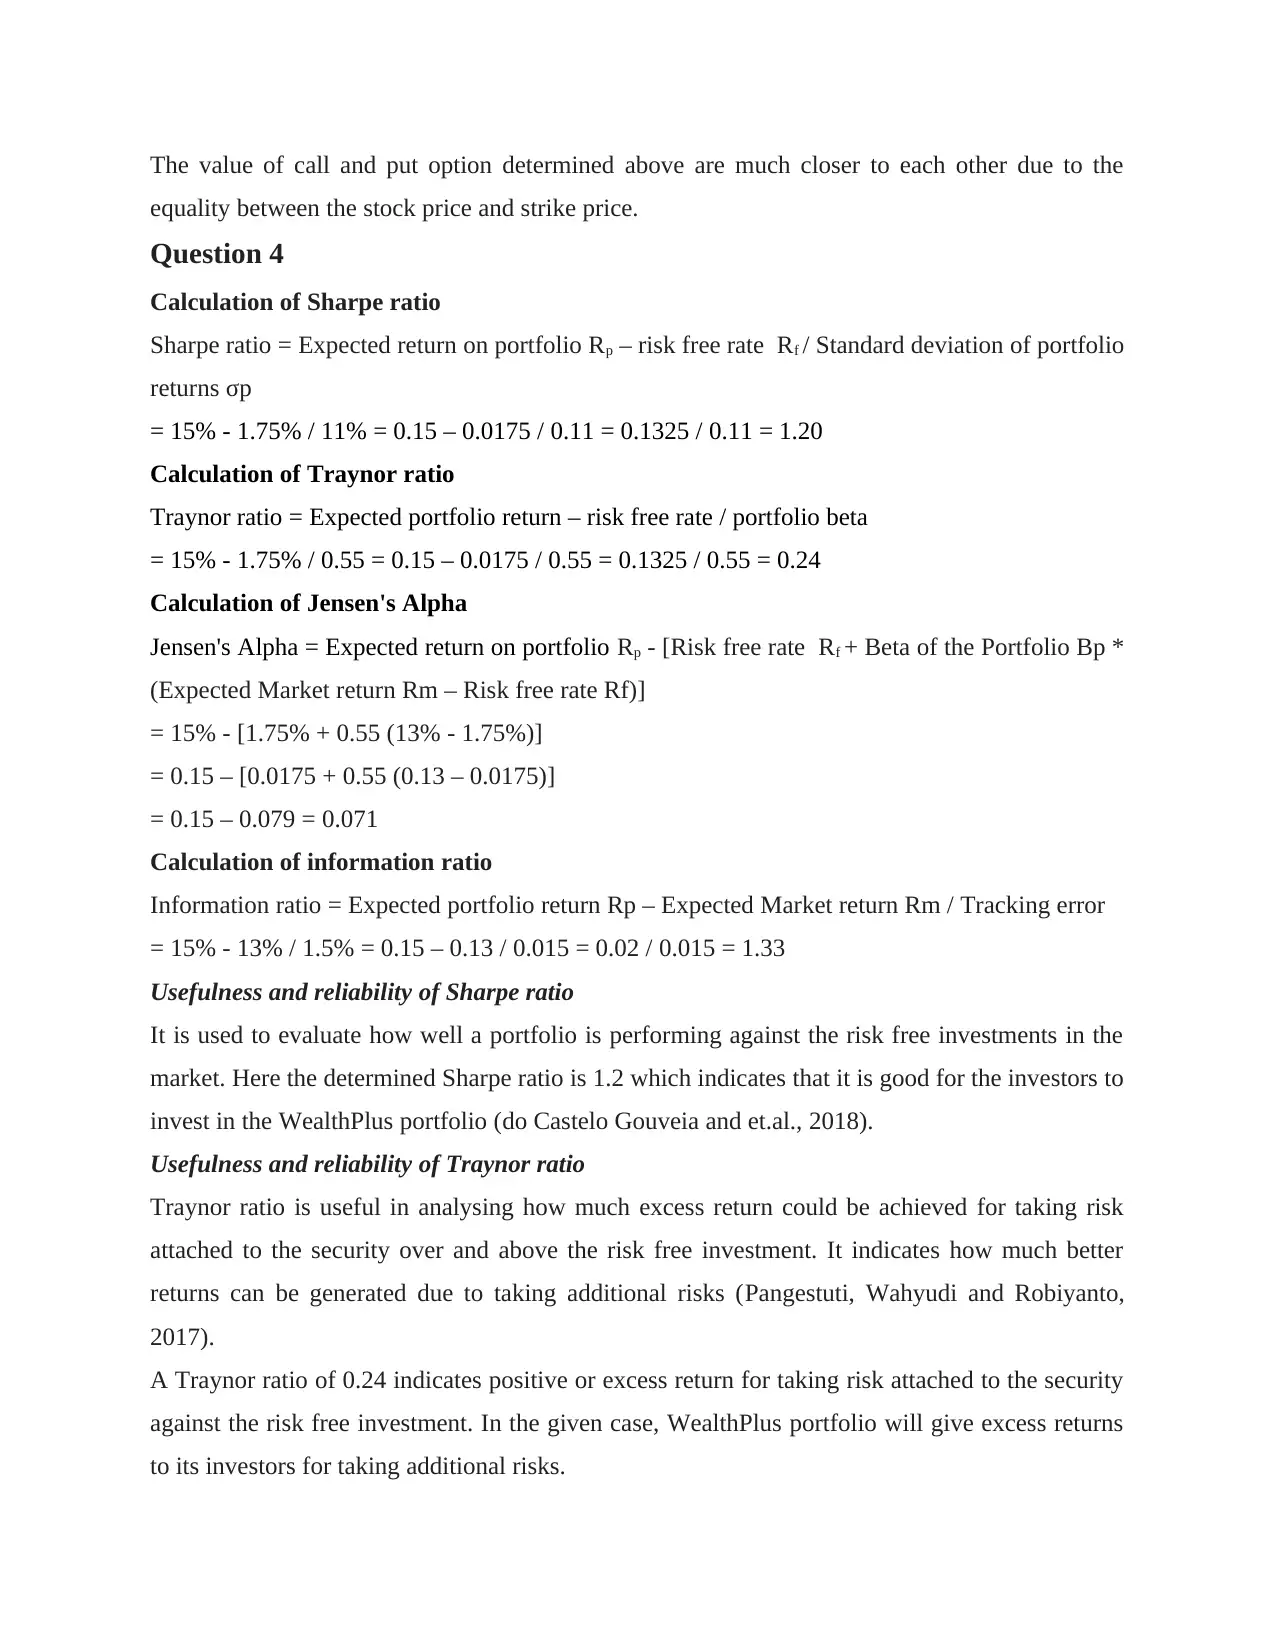
The value of call and put option determined above are much closer to each other due to the
equality between the stock price and strike price.
Question 4
Calculation of Sharpe ratio
Sharpe ratio = Expected return on portfolio Rp – risk free rate Rf / Standard deviation of portfolio
returns σp
= 15% - 1.75% / 11% = 0.15 – 0.0175 / 0.11 = 0.1325 / 0.11 = 1.20
Calculation of Traynor ratio
Traynor ratio = Expected portfolio return – risk free rate / portfolio beta
= 15% - 1.75% / 0.55 = 0.15 – 0.0175 / 0.55 = 0.1325 / 0.55 = 0.24
Calculation of Jensen's Alpha
Jensen's Alpha = Expected return on portfolio Rp - [Risk free rate Rf + Beta of the Portfolio Bp *
(Expected Market return Rm – Risk free rate Rf)]
= 15% - [1.75% + 0.55 (13% - 1.75%)]
= 0.15 – [0.0175 + 0.55 (0.13 – 0.0175)]
= 0.15 – 0.079 = 0.071
Calculation of information ratio
Information ratio = Expected portfolio return Rp – Expected Market return Rm / Tracking error
= 15% - 13% / 1.5% = 0.15 – 0.13 / 0.015 = 0.02 / 0.015 = 1.33
Usefulness and reliability of Sharpe ratio
It is used to evaluate how well a portfolio is performing against the risk free investments in the
market. Here the determined Sharpe ratio is 1.2 which indicates that it is good for the investors to
invest in the WealthPlus portfolio (do Castelo Gouveia and et.al., 2018).
Usefulness and reliability of Traynor ratio
Traynor ratio is useful in analysing how much excess return could be achieved for taking risk
attached to the security over and above the risk free investment. It indicates how much better
returns can be generated due to taking additional risks (Pangestuti, Wahyudi and Robiyanto,
2017).
A Traynor ratio of 0.24 indicates positive or excess return for taking risk attached to the security
against the risk free investment. In the given case, WealthPlus portfolio will give excess returns
to its investors for taking additional risks.
Usefulness and reliability of Jensen's alpha
Jensen's alpha allows for determining whether the portfolio is returning appropriate return for the
level of risk involved in the securities of the portfolio (Hsieh and et.al., 2020). The excess return
that the portfolio would generate is being represented through the positive value of derived
Jensen's alpha.
Here in the given case, the value of Jensen's alpha for the WealthPlus portfolio is positive that is,
0.071 which indicates that the portfolio has outperformed the market due to the stock picking
skills of the portfolio manager. Jensen's alpha indicates the fund manager's performance.
Usefulness and reliability of information ratio
Information ratio identified how many times and by how much a portfolio has traded better than
or in excess of its benchmark (Chrétien and Kammoun, 2017). The higher the information ratio,
the much better it is. A less than 0 ratios indicated underperformance or poor performance of the
portfolio in the market.
In the given case, the derived value of information ratio for WealthPlus portfolio is comes out as
1.33 which indicates better performance of the portfolio in the market in the past.
CONCLUSION
The report has concluded the reason why academics use and not use the Arbitrage Pricing
model and Fama-French three factor models. Further, the report has concluded the Porter’s five
forces effect on IT industry of Australia along with the impact of Covid and Global financial
crises over the IT industry performance. This has also included the ways to recover from this in
the next five years. The report has also concluded the calculation of call and put option along
with the four measure such as Sharpe ratio etc. Lastly, the report has also provided the
recommendations on the class and strategy of investment to IT industry.
RECOMMENDATION
The following recommendation is available to the IT industry which are as follows:
Because of the global financial crises, the IT industry faces difficulty in getting returns
from its investment in equities. Thus, it is recommendable to the firms of IT industry that
they have to invest more on the debt funds rather than equity funds. It is because debts
provide fixed returns despite of crises or covid. The debt funds contain low risk as
⊘ This is a preview!⊘
Do you want full access?
Subscribe today to unlock all pages.
Trusted by 1+ million students worldwide
1 out of 15
Related Documents


Your All-in-One AI-Powered Toolkit for Academic Success.
+13062052269
info@desklib.com
Available 24*7 on WhatsApp / Email
![[object Object]](/_next/static/media/star-bottom.7253800d.svg)
Unlock your academic potential
Copyright © 2020–2026 A2Z Services. All Rights Reserved. Developed and managed by ZUCOL.