International Trade Analysis: Italy and Sweden Report
VerifiedAdded on 2022/12/23
|13
|2194
|43
Project
AI Summary
This assignment analyzes international trade conditions in Italy and Sweden, acting as an economic consultant. The analysis begins with data analysis, examining the relationship between openness and the Gini coefficient, revealing a positive correlation indicating that increased openness is associated with increased inequality in both countries, particularly stronger in Sweden. The report then applies the Stolper-Samuelson theorem to explain how increased openness affects skilled and unskilled workers, aligning with the observed correlations. Technical analysis employs Ricardo's model to explore comparative advantages in shoe and calculator production, determining relative demand and supply curves, and identifying equilibrium prices and quantities under free trade. The conclusion highlights the mutual benefits of trade, with Italy gaining more from exporting calculators and skilled workers benefiting from higher wages, while unskilled workers may face wage declines.
Running head: INTERNATIONAL TRADE
International Trade
Name of the Student
Name of the University
Student ID
International Trade
Name of the Student
Name of the University
Student ID
Paraphrase This Document
Need a fresh take? Get an instant paraphrase of this document with our AI Paraphraser
1INTERNATIONAL TRADE
Table of Contents
Data Analysis...................................................................................................................................2
Step 1...........................................................................................................................................2
Step 2...........................................................................................................................................3
Step 3...........................................................................................................................................3
Technical Analysis...........................................................................................................................4
Step 4...........................................................................................................................................4
Reference list.................................................................................................................................11
2INTERNATIONAL TRADE
Data Analysis
Step 1
32.5 33 33.5 34 34.5 35 35.5 36
45%
47%
49%
51%
53%
55%
57%
59%
Italy
Gini Index
Openness
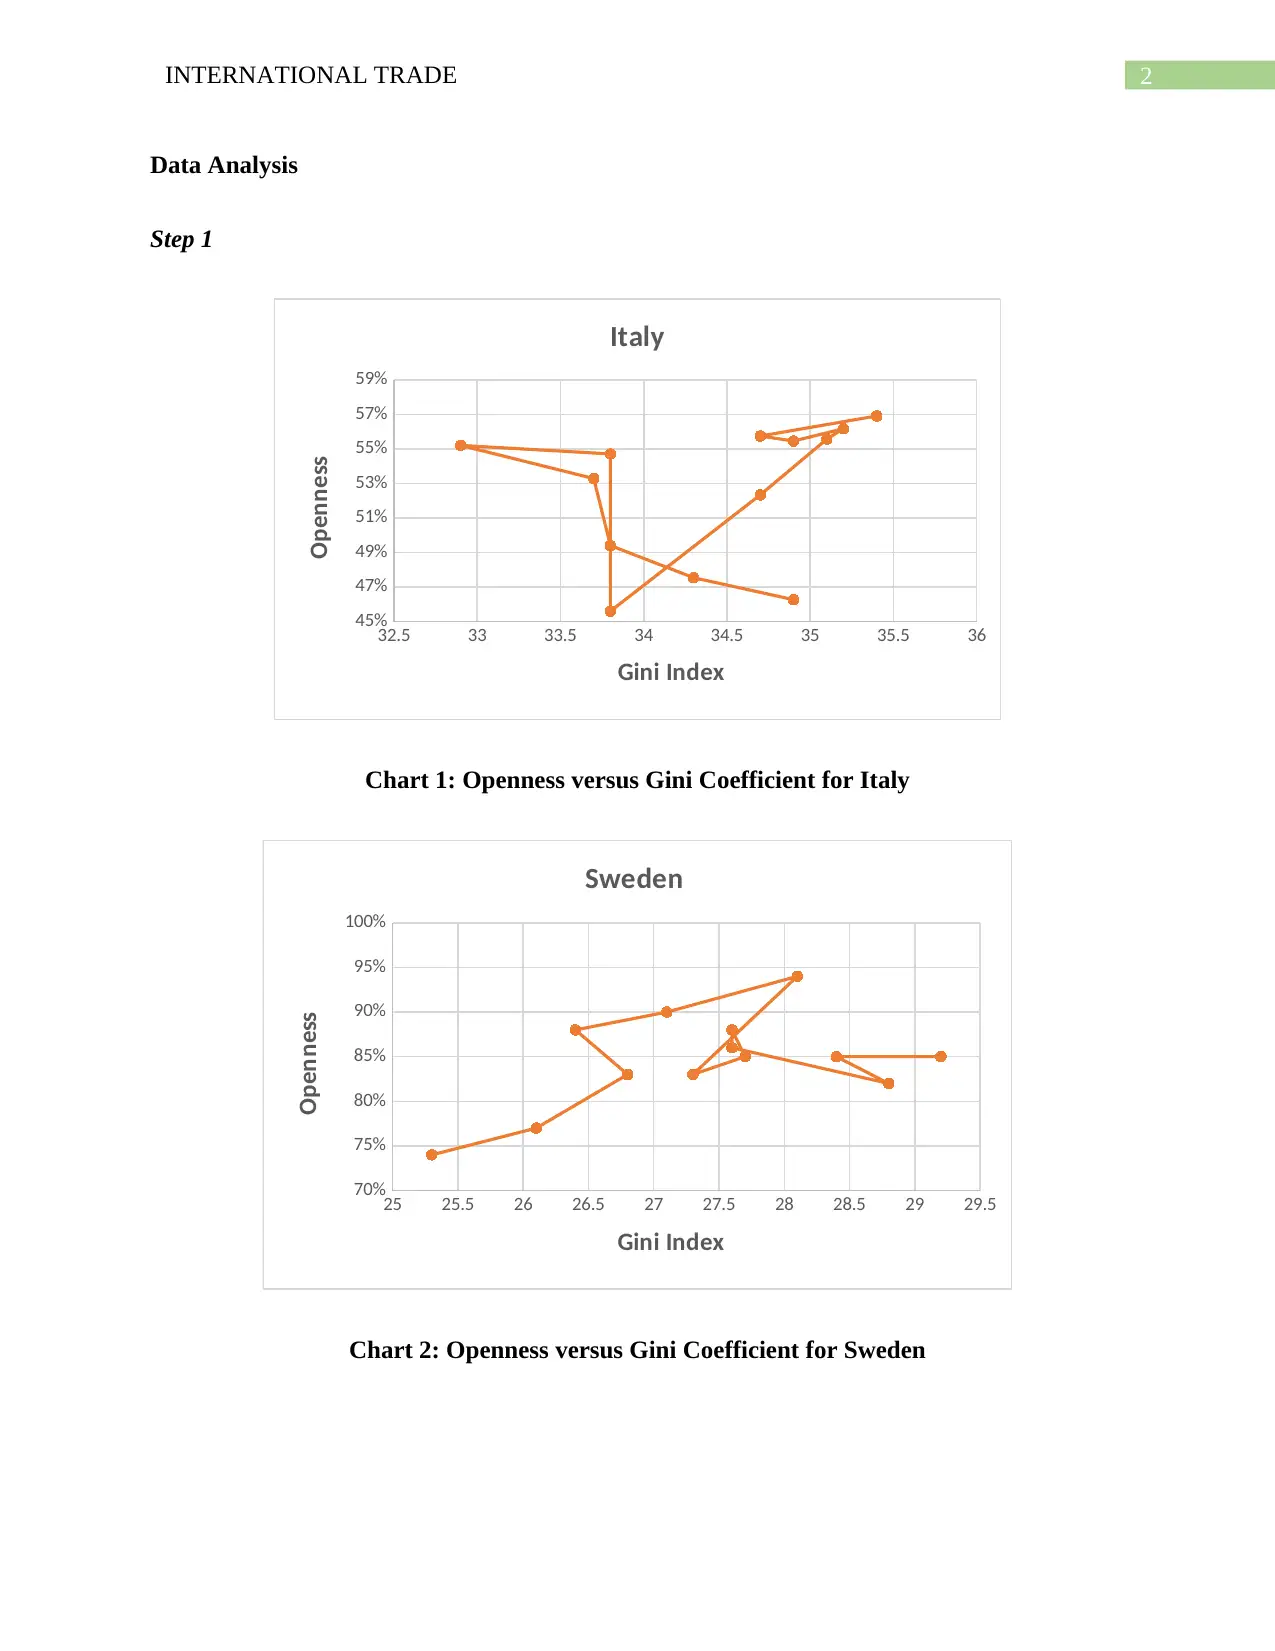
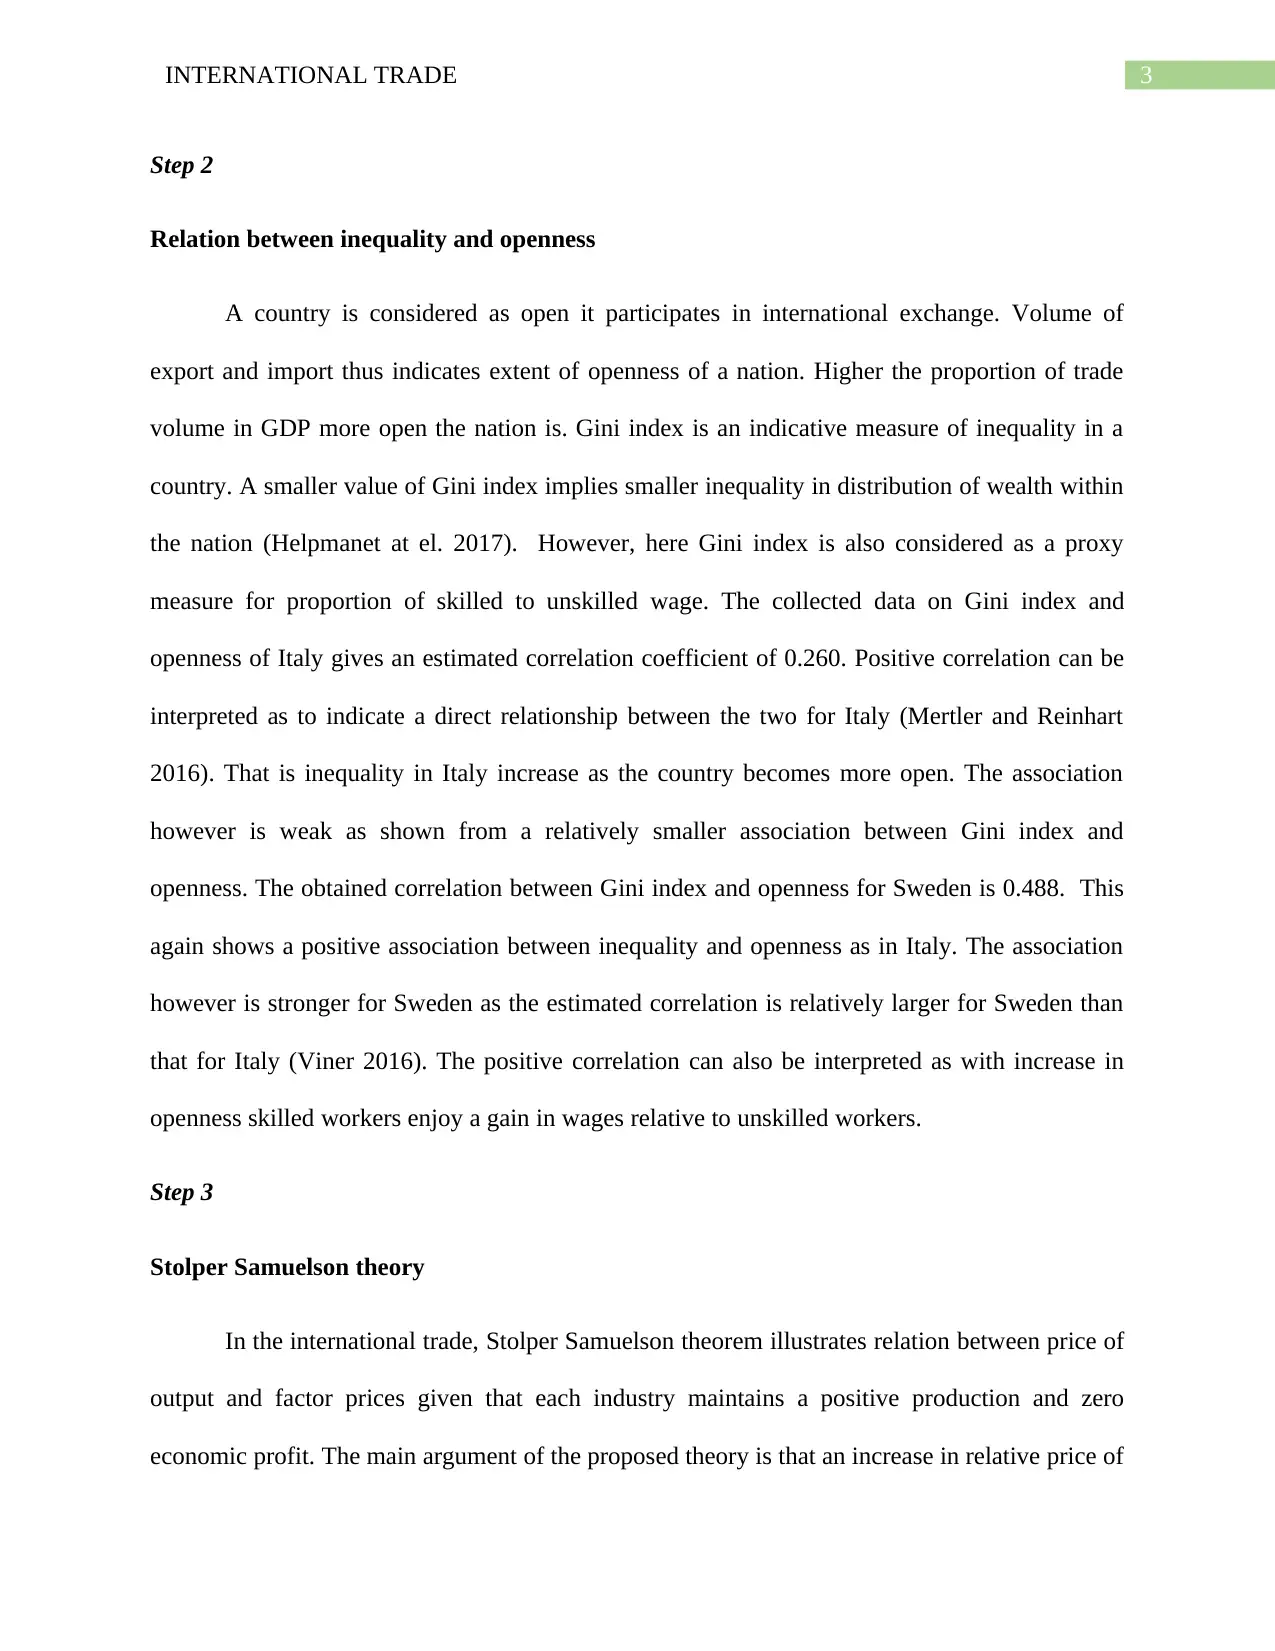
Chart 1: Openness versus Gini Coefficient for Italy
25 25.5 26 26.5 27 27.5 28 28.5 29 29.5
70%
75%
80%
85%
90%
95%
100%
Sweden
Gini Index
Openness
Chart 2: Openness versus Gini Coefficient for Sweden
Data Analysis
Step 1
32.5 33 33.5 34 34.5 35 35.5 36
45%
47%
49%
51%
53%
55%
57%
59%
Italy
Gini Index
Openness
Chart 1: Openness versus Gini Coefficient for Italy
25 25.5 26 26.5 27 27.5 28 28.5 29 29.5
70%
75%
80%
85%
90%
95%
100%
Sweden
Gini Index
Openness
Chart 2: Openness versus Gini Coefficient for Sweden
⊘ This is a preview!⊘
Do you want full access?
Subscribe today to unlock all pages.
Trusted by 1+ million students worldwide
3INTERNATIONAL TRADE
Step 2
Relation between inequality and openness
A country is considered as open it participates in international exchange. Volume of
export and import thus indicates extent of openness of a nation. Higher the proportion of trade
volume in GDP more open the nation is. Gini index is an indicative measure of inequality in a
country. A smaller value of Gini index implies smaller inequality in distribution of wealth within
the nation (Helpmanet at el. 2017). However, here Gini index is also considered as a proxy
measure for proportion of skilled to unskilled wage. The collected data on Gini index and
openness of Italy gives an estimated correlation coefficient of 0.260. Positive correlation can be
interpreted as to indicate a direct relationship between the two for Italy (Mertler and Reinhart
2016). That is inequality in Italy increase as the country becomes more open. The association
however is weak as shown from a relatively smaller association between Gini index and
openness. The obtained correlation between Gini index and openness for Sweden is 0.488. This
again shows a positive association between inequality and openness as in Italy. The association
however is stronger for Sweden as the estimated correlation is relatively larger for Sweden than
that for Italy (Viner 2016). The positive correlation can also be interpreted as with increase in
openness skilled workers enjoy a gain in wages relative to unskilled workers.
Step 3
Stolper Samuelson theory
In the international trade, Stolper Samuelson theorem illustrates relation between price of
output and factor prices given that each industry maintains a positive production and zero
economic profit. The main argument of the proposed theory is that an increase in relative price of
Paraphrase This Document
Need a fresh take? Get an instant paraphrase of this document with our AI Paraphraser
4INTERNATIONAL TRADE
labor intensive good increase return to labor and hence, makes labor better off. In contrast it
reduces return to capital and make capital worse-off (Jakel and Smolka 2013). In reference to
discussion in step 3, in both Italy and Sweden the estimated correlation coefficient between Gini
index and openness is obtained as positive. This in turn implies increase in openness is
association with an increase in wage ratio of skilled to unskilled workers. It is given that both
Italy and Sweden are skill-labor abundant nations. Both the nation therefore specializes and
export skilled-labor abundant goods. The world relative price is greater than the domestic price
ratio. A country tends to export more and more goods as world relative price increases.
Therefore, higher degree of openness implies more and more export (Burstein and Vogel 2017).
As world relative price of skilled-labor abundant goods increases, skilled labors in both the
country receive a higher wage increasing the ratio of skilled to unskilled wage. The result is thus
in line with Stolper Samuelson theorem claiming a higher gain to the intensive factor from
increase in relative price of the specific good.
Technical Analysis
Step 4
Ricardo’s mode of international trade
Given the unit labor requirement for production of shoes and calculators in both Italy and
Sweden, the Ricardo’s model of trade can be formed as follows.
5INTERNATIONAL TRADE
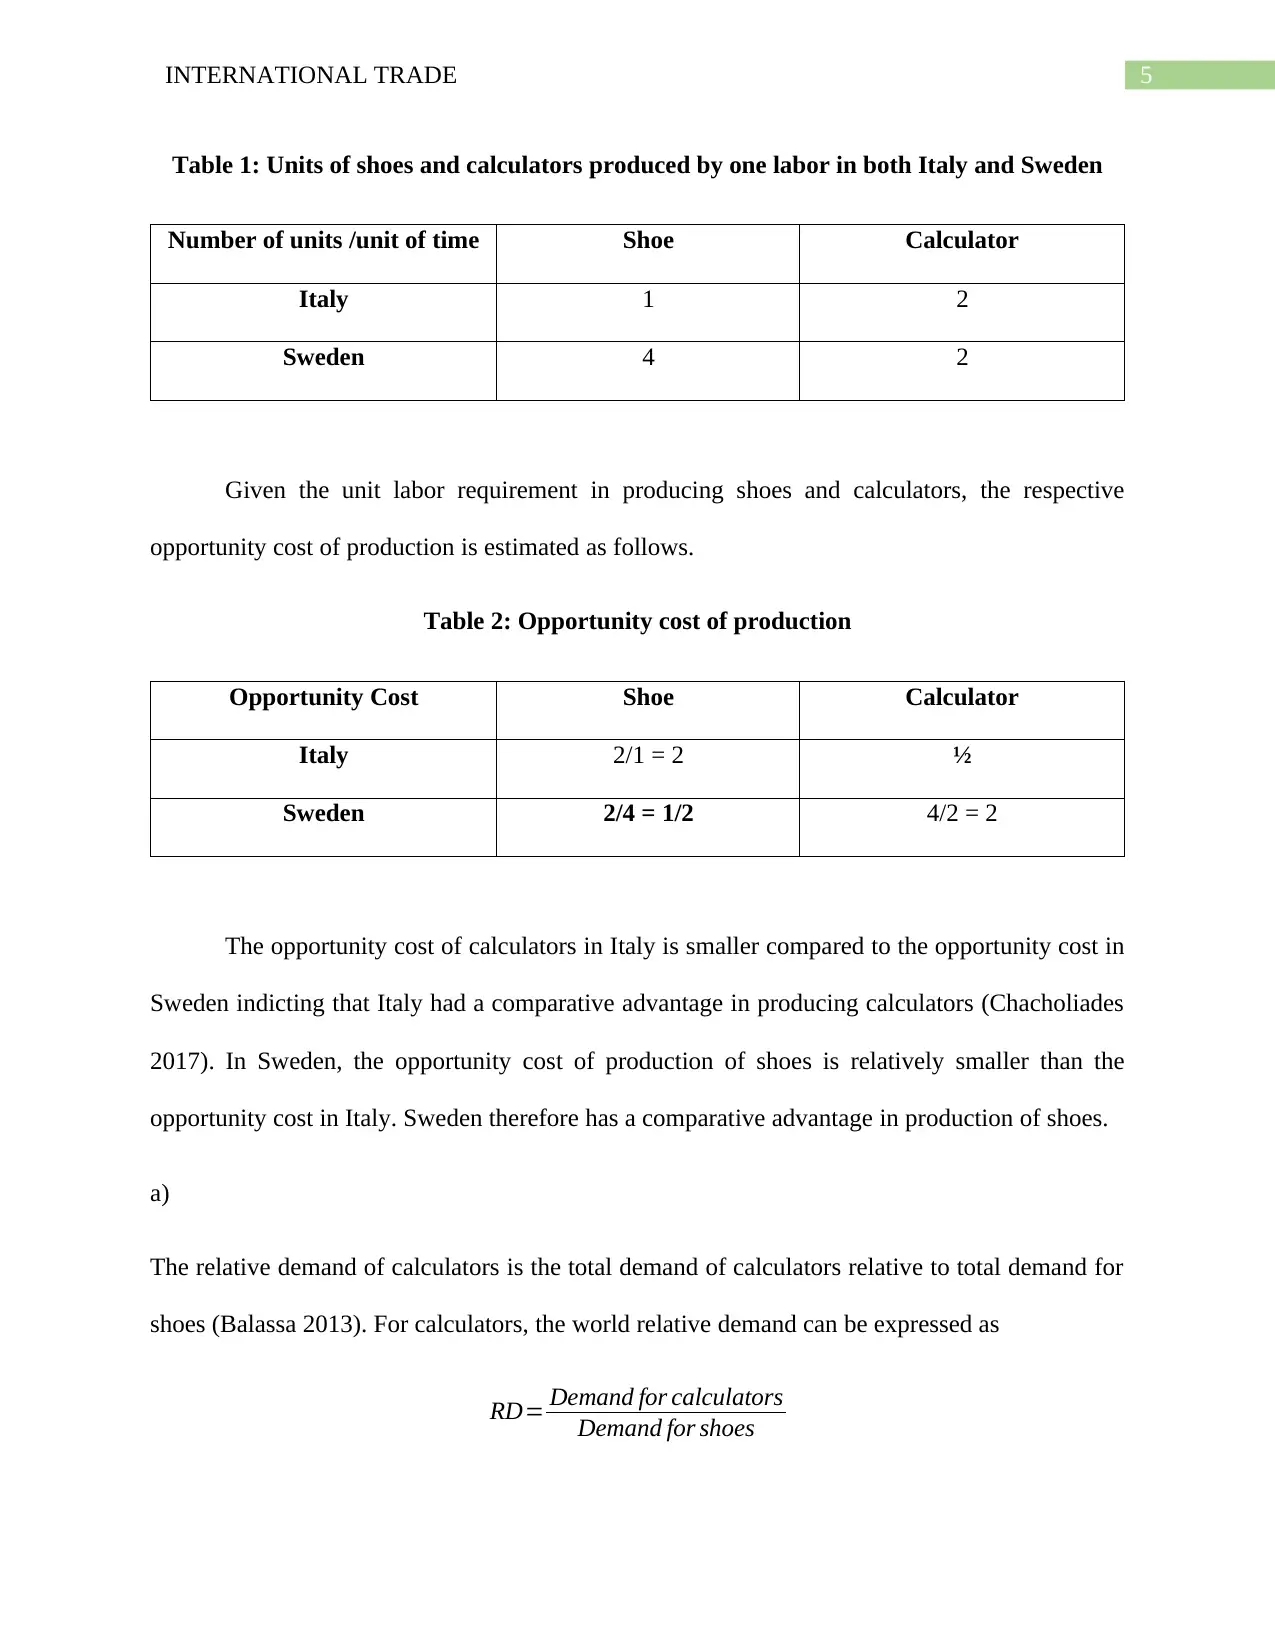
Table 1: Units of shoes and calculators produced by one labor in both Italy and Sweden
Number of units /unit of time Shoe Calculator
Italy 1 2
Sweden 4 2
Given the unit labor requirement in producing shoes and calculators, the respective
opportunity cost of production is estimated as follows.
Table 2: Opportunity cost of production
Opportunity Cost Shoe Calculator
Italy 2/1 = 2 ½
Sweden 2/4 = 1/2 4/2 = 2
The opportunity cost of calculators in Italy is smaller compared to the opportunity cost in
Sweden indicting that Italy had a comparative advantage in producing calculators (Chacholiades
2017). In Sweden, the opportunity cost of production of shoes is relatively smaller than the
opportunity cost in Italy. Sweden therefore has a comparative advantage in production of shoes.
a)
The relative demand of calculators is the total demand of calculators relative to total demand for
shoes (Balassa 2013). For calculators, the world relative demand can be expressed as
RD= Demand for calculators
Demand for shoes
⊘ This is a preview!⊘
Do you want full access?
Subscribe today to unlock all pages.
Trusted by 1+ million students worldwide
6INTERNATIONAL TRADE
¿ QC
I + QC
S
QS
I + QS
S
¿ QC
QS
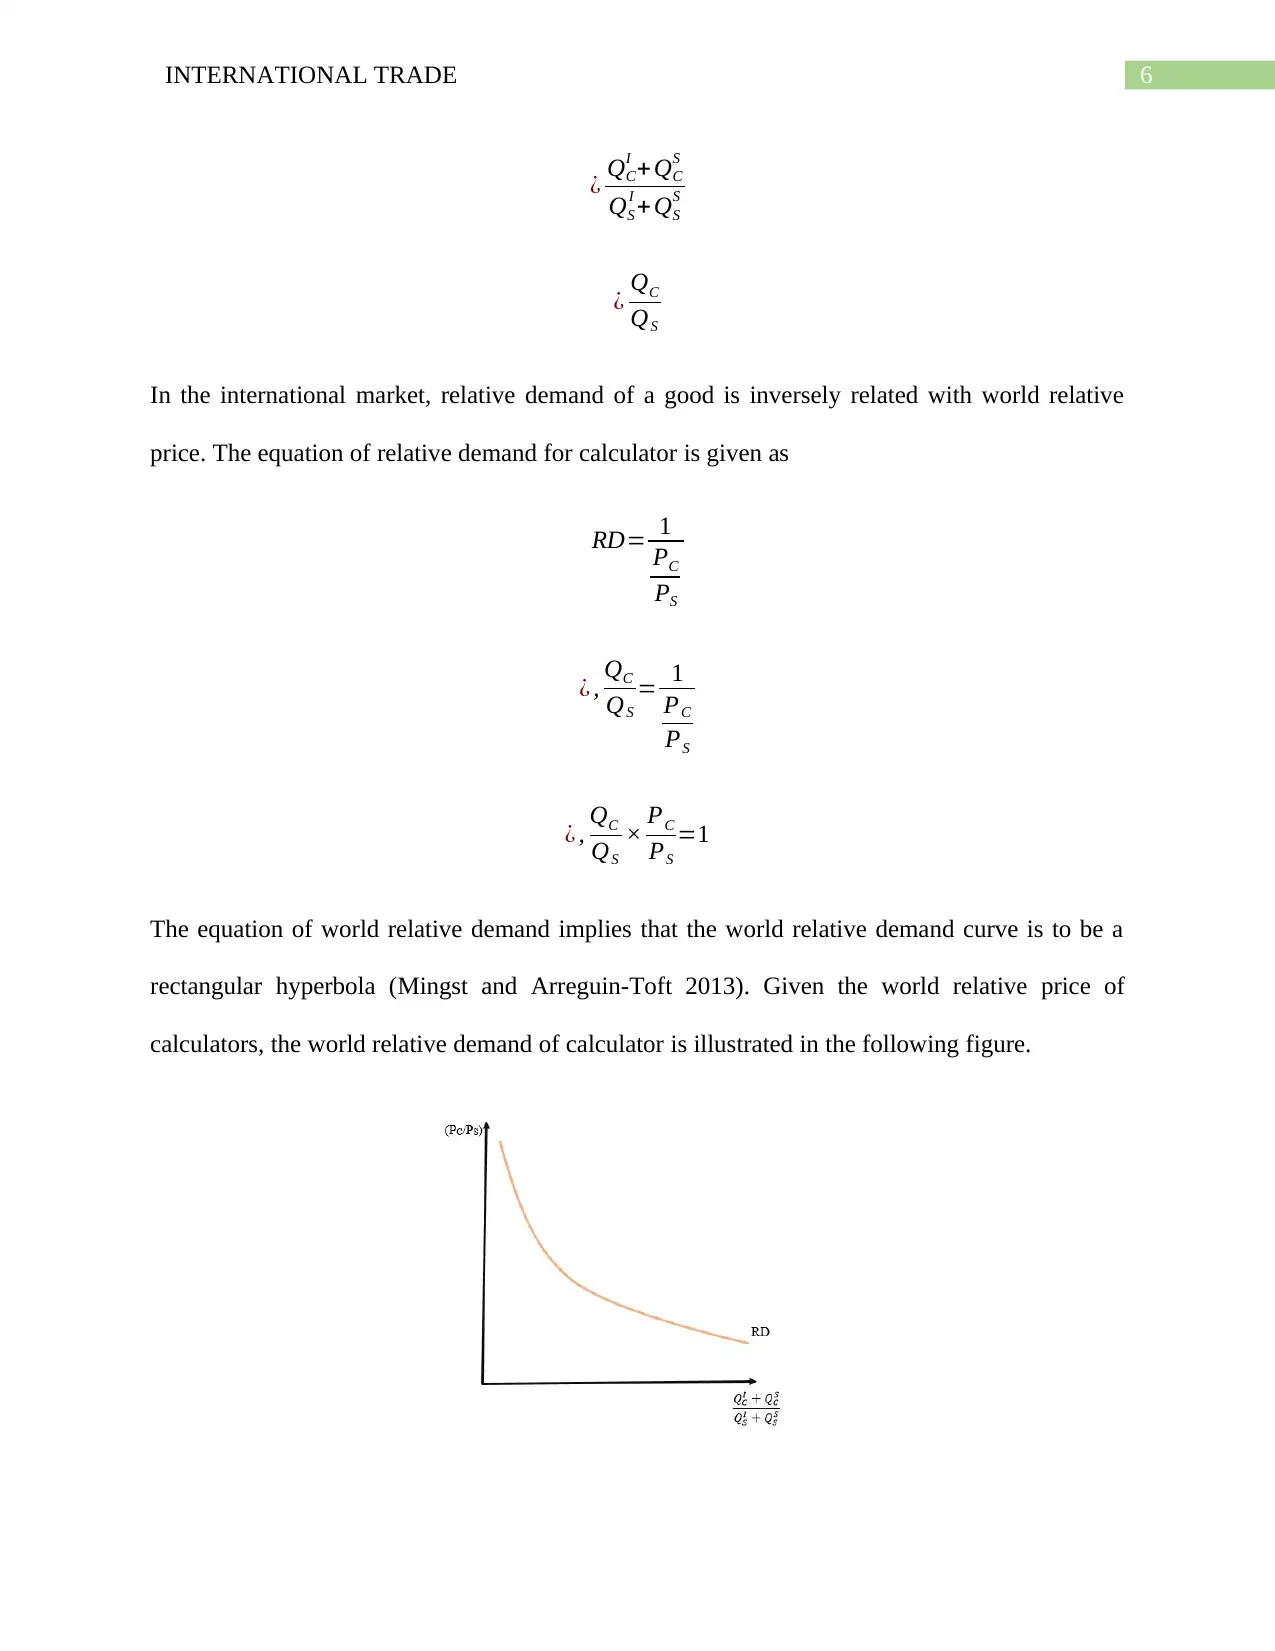
In the international market, relative demand of a good is inversely related with world relative
price. The equation of relative demand for calculator is given as
RD= 1
PC
PS
¿ , QC
QS
= 1
PC
PS
¿ , QC
QS
× PC
PS
=1
The equation of world relative demand implies that the world relative demand curve is to be a
rectangular hyperbola (Mingst and Arreguin-Toft 2013). Given the world relative price of
calculators, the world relative demand of calculator is illustrated in the following figure.
¿ QC
I + QC
S
QS
I + QS
S
¿ QC
QS
In the international market, relative demand of a good is inversely related with world relative
price. The equation of relative demand for calculator is given as
RD= 1
PC
PS
¿ , QC
QS
= 1
PC
PS
¿ , QC
QS
× PC
PS
=1
The equation of world relative demand implies that the world relative demand curve is to be a
rectangular hyperbola (Mingst and Arreguin-Toft 2013). Given the world relative price of
calculators, the world relative demand of calculator is illustrated in the following figure.
Paraphrase This Document
Need a fresh take? Get an instant paraphrase of this document with our AI Paraphraser
7INTERNATIONAL TRADE
Figure 3: Relative demand curve
b)
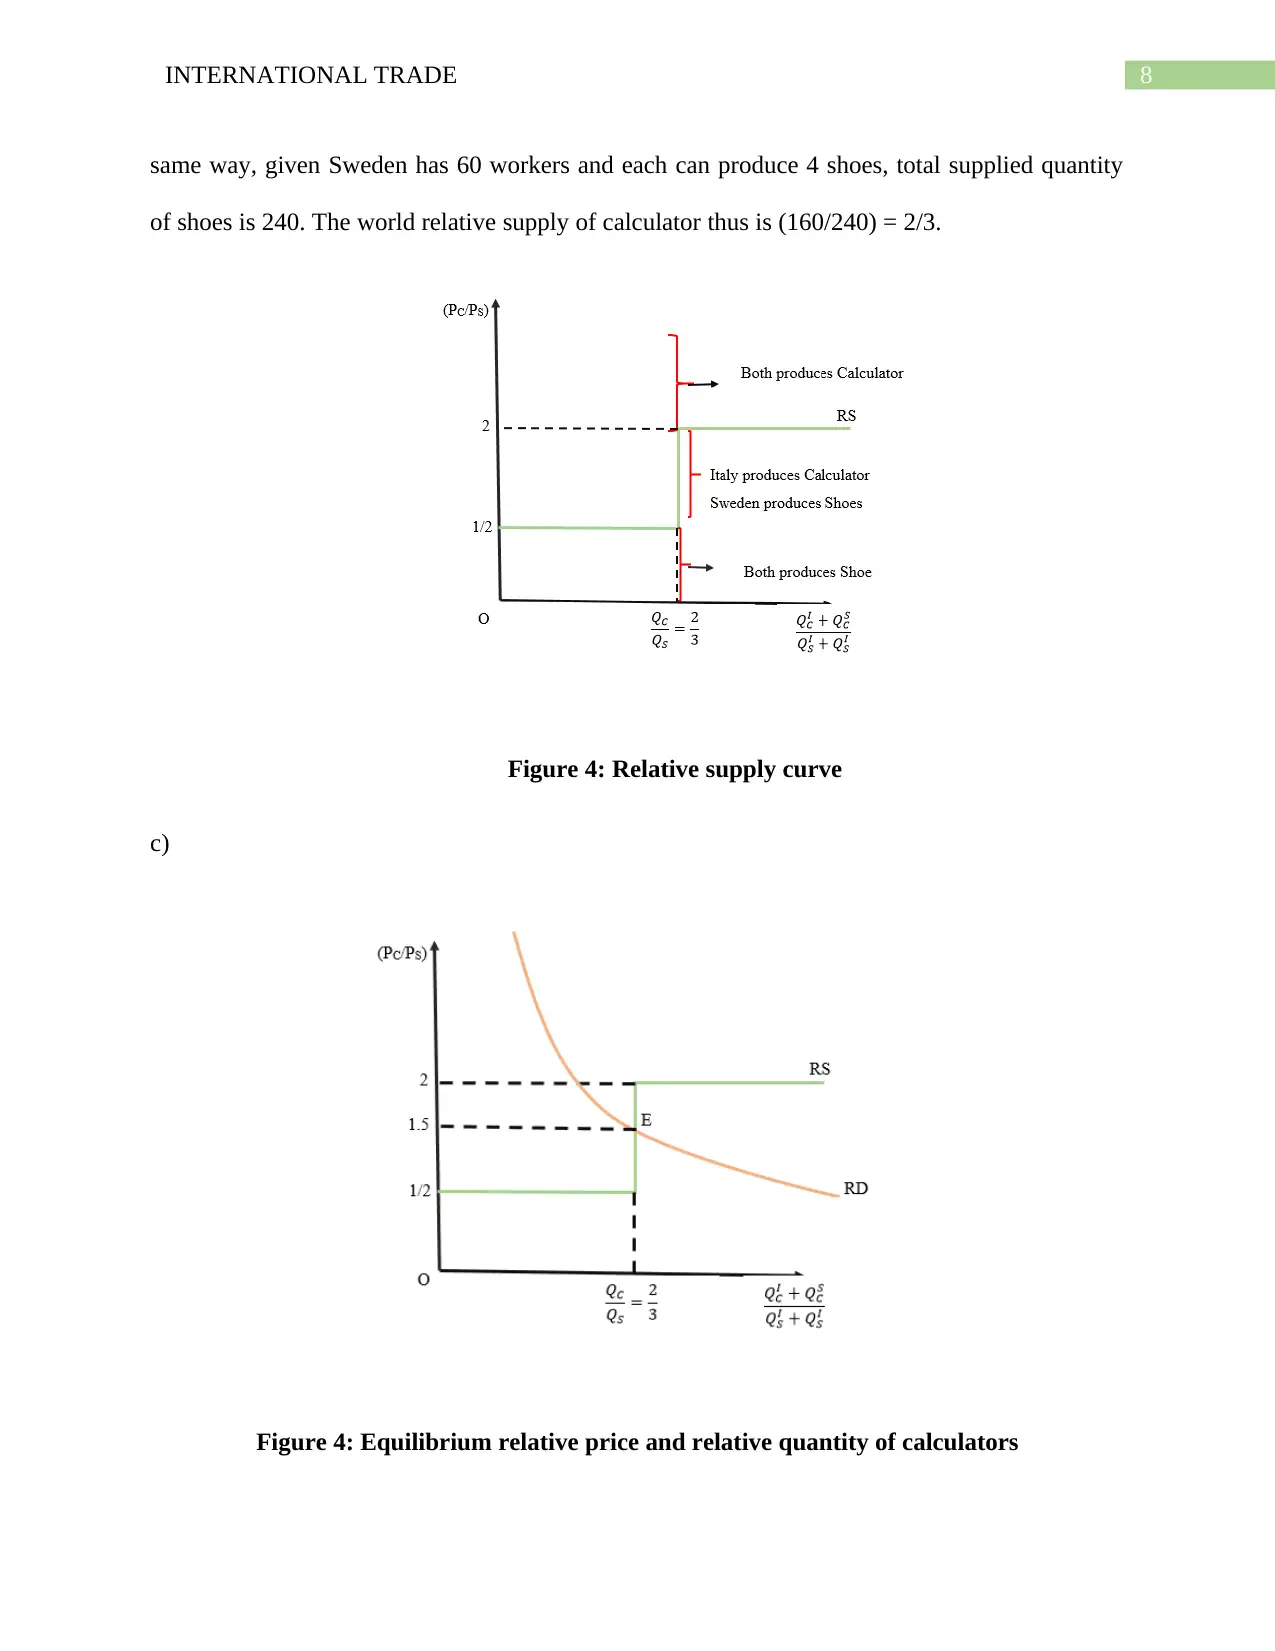
Relative supply curve shows the relation of quantity supplied of calculators relative of
quantity supplied of shoes. The relative supply of calculators depends on the world relative price
of calculator in the following manner.
In Italy, the opportunity cost of calculator is ½. In autarky, the opportunity cost shows the
domestic relative price of calculators. Italy therefore specialize in calculators if the world
relative price of calculators exceeds the domestic price ratio of calculators (Noussair, Plott and
Riezman 2013).
In Sweden, the opportunity cost of calculator is 2. Sweden thus imports calculators if the
relative price of calculator in the world market is less than the domestic relative price of
calculators in Sweden.
If world relative price of calculator is less than ½, then neither Italy nor Sweden will
produce calculators. In this case world relative price of shoes exceeds the domestic relative price
of both the nation indicating that both the nation should produce only shoes. Similarly, if the
relative price of calculators is above 2, then the world relative price exceeds domestic relative
price of calculators in both the nation. It will be them beneficial for both the nation to produce
only calculators (Levchenko and Zhang 2016). Therefore, in order to have the situation
indicating Italy exports calculators and Sweden imports calculators, the relative price of
calculators has to be in the range between ½ and 2. In the intermediary range of relative supply
curve, Italy produces only calculators and Sweden produces only shoes. Given Italy has 80
workers and each can produce 2 calculators, total supplied quantity of calculator is 160. In the
Figure 3: Relative demand curve
b)
Relative supply curve shows the relation of quantity supplied of calculators relative of
quantity supplied of shoes. The relative supply of calculators depends on the world relative price
of calculator in the following manner.
In Italy, the opportunity cost of calculator is ½. In autarky, the opportunity cost shows the
domestic relative price of calculators. Italy therefore specialize in calculators if the world
relative price of calculators exceeds the domestic price ratio of calculators (Noussair, Plott and
Riezman 2013).
In Sweden, the opportunity cost of calculator is 2. Sweden thus imports calculators if the
relative price of calculator in the world market is less than the domestic relative price of
calculators in Sweden.
If world relative price of calculator is less than ½, then neither Italy nor Sweden will
produce calculators. In this case world relative price of shoes exceeds the domestic relative price
of both the nation indicating that both the nation should produce only shoes. Similarly, if the
relative price of calculators is above 2, then the world relative price exceeds domestic relative
price of calculators in both the nation. It will be them beneficial for both the nation to produce
only calculators (Levchenko and Zhang 2016). Therefore, in order to have the situation
indicating Italy exports calculators and Sweden imports calculators, the relative price of
calculators has to be in the range between ½ and 2. In the intermediary range of relative supply
curve, Italy produces only calculators and Sweden produces only shoes. Given Italy has 80
workers and each can produce 2 calculators, total supplied quantity of calculator is 160. In the
8INTERNATIONAL TRADE
same way, given Sweden has 60 workers and each can produce 4 shoes, total supplied quantity
of shoes is 240. The world relative supply of calculator thus is (160/240) = 2/3.
Figure 4: Relative supply curve
c)
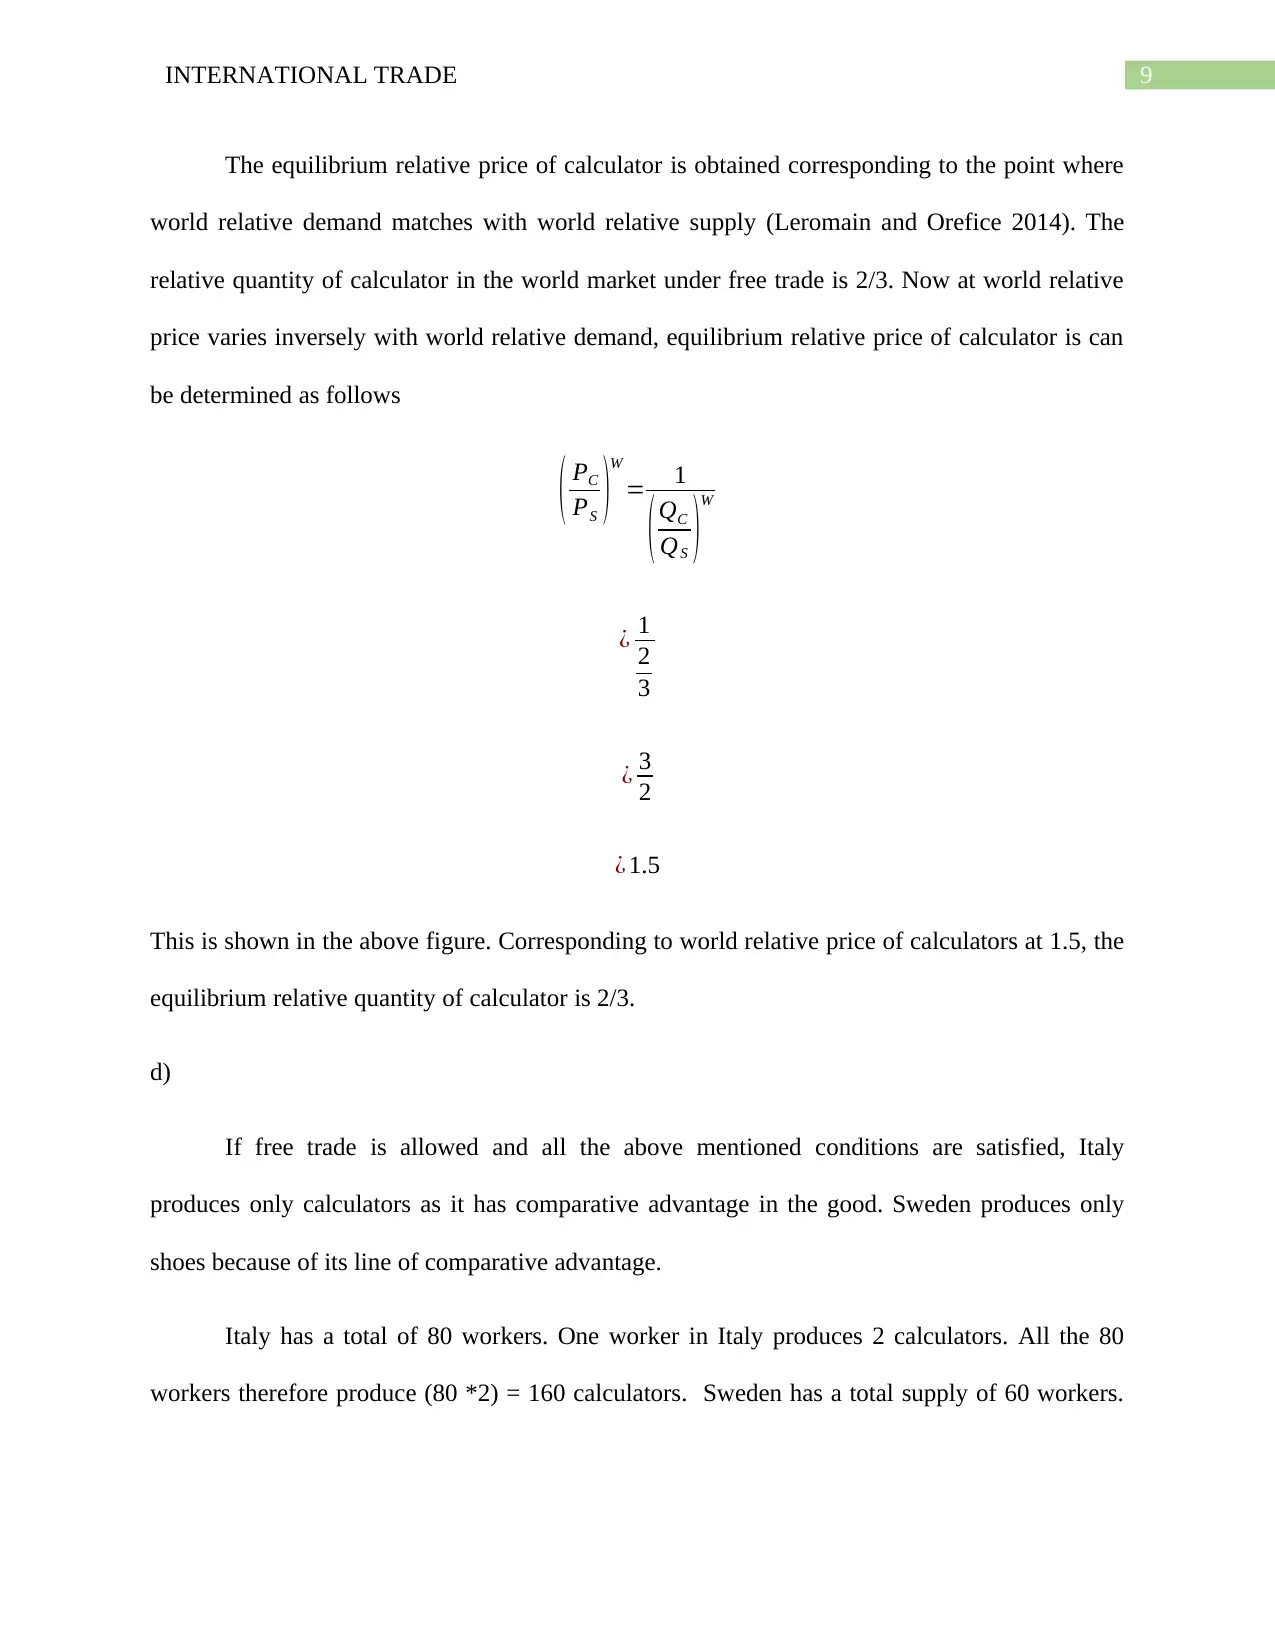
Figure 4: Equilibrium relative price and relative quantity of calculators
same way, given Sweden has 60 workers and each can produce 4 shoes, total supplied quantity
of shoes is 240. The world relative supply of calculator thus is (160/240) = 2/3.
Figure 4: Relative supply curve
c)
Figure 4: Equilibrium relative price and relative quantity of calculators
⊘ This is a preview!⊘
Do you want full access?
Subscribe today to unlock all pages.
Trusted by 1+ million students worldwide
9INTERNATIONAL TRADE
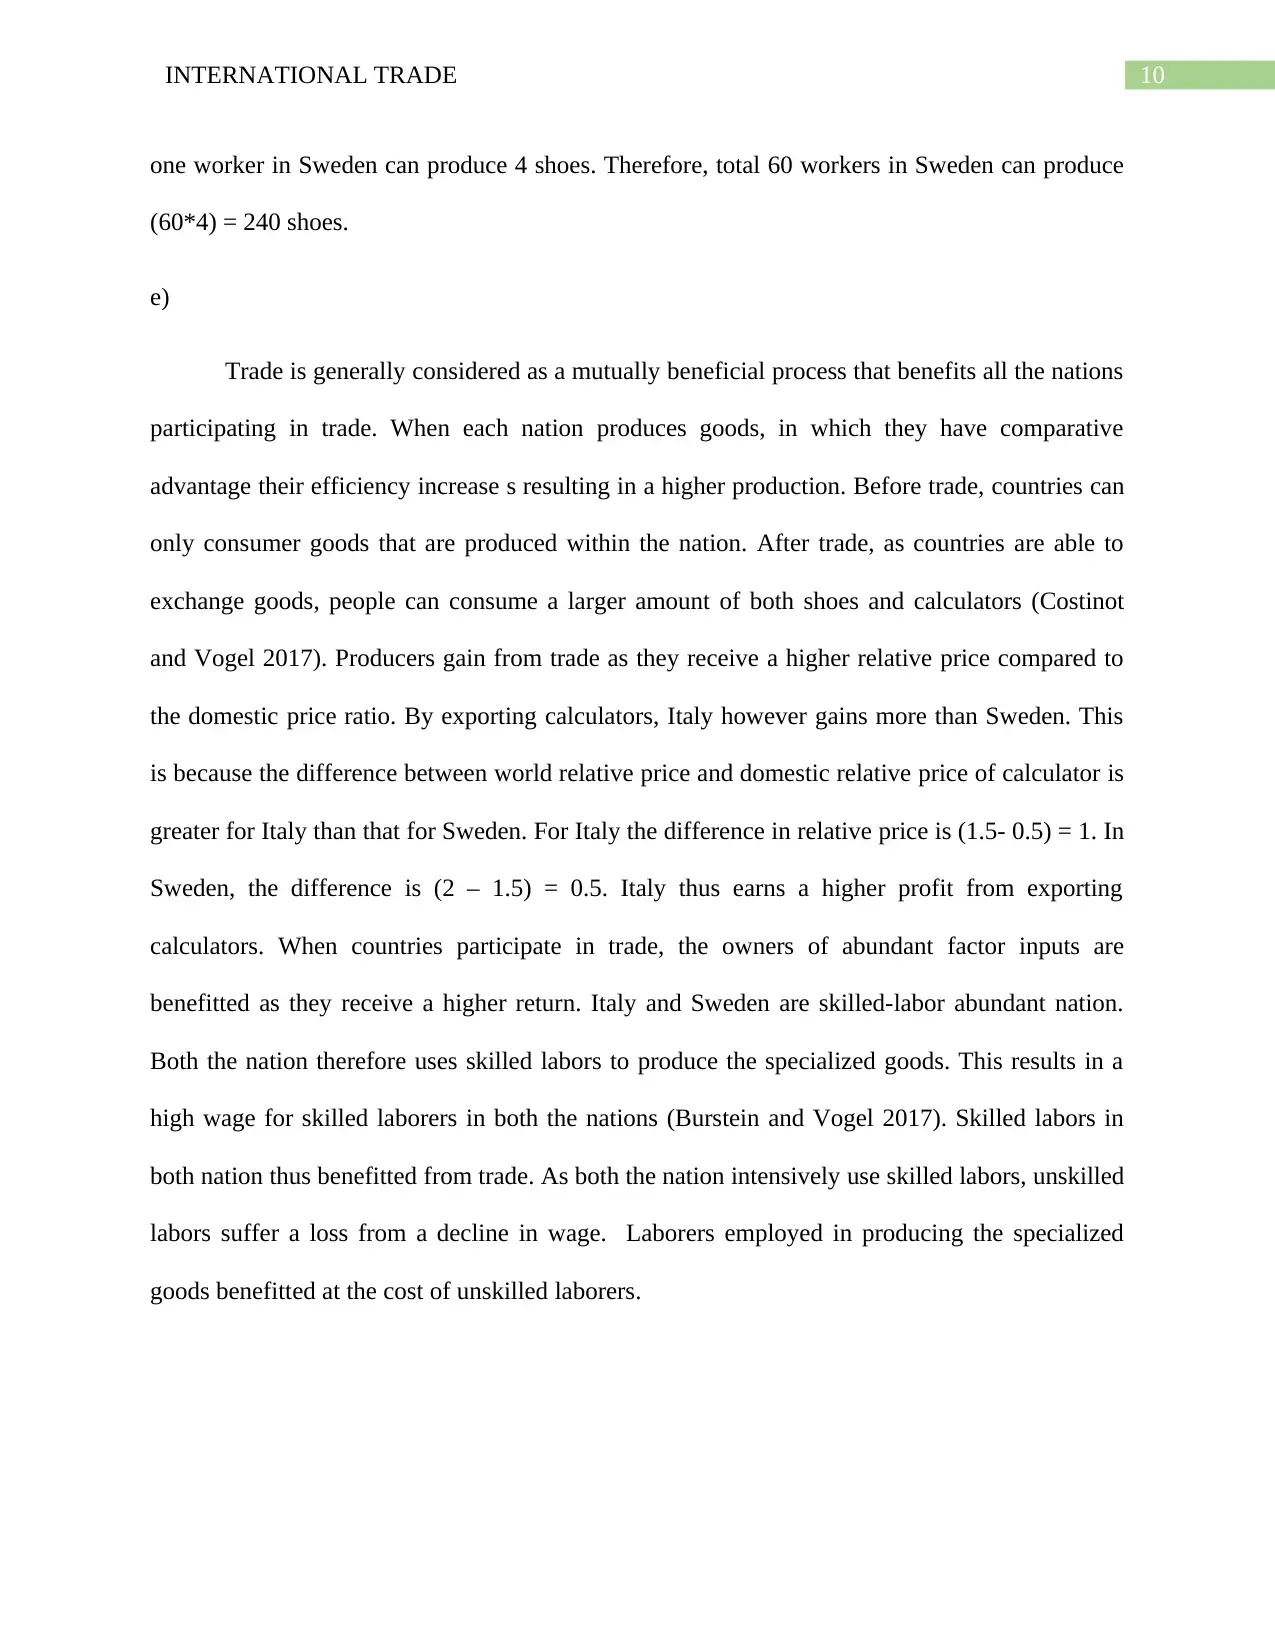
The equilibrium relative price of calculator is obtained corresponding to the point where
world relative demand matches with world relative supply (Leromain and Orefice 2014). The
relative quantity of calculator in the world market under free trade is 2/3. Now at world relative
price varies inversely with world relative demand, equilibrium relative price of calculator is can
be determined as follows
( PC
PS )
W
= 1
( QC
QS )
W
¿ 1
2
3
¿ 3
2
¿ 1.5
This is shown in the above figure. Corresponding to world relative price of calculators at 1.5, the
equilibrium relative quantity of calculator is 2/3.
d)
If free trade is allowed and all the above mentioned conditions are satisfied, Italy
produces only calculators as it has comparative advantage in the good. Sweden produces only
shoes because of its line of comparative advantage.
Italy has a total of 80 workers. One worker in Italy produces 2 calculators. All the 80
workers therefore produce (80 *2) = 160 calculators. Sweden has a total supply of 60 workers.
Paraphrase This Document
Need a fresh take? Get an instant paraphrase of this document with our AI Paraphraser
10INTERNATIONAL TRADE
one worker in Sweden can produce 4 shoes. Therefore, total 60 workers in Sweden can produce
(60*4) = 240 shoes.
e)
Trade is generally considered as a mutually beneficial process that benefits all the nations
participating in trade. When each nation produces goods, in which they have comparative
advantage their efficiency increase s resulting in a higher production. Before trade, countries can
only consumer goods that are produced within the nation. After trade, as countries are able to
exchange goods, people can consume a larger amount of both shoes and calculators (Costinot
and Vogel 2017). Producers gain from trade as they receive a higher relative price compared to
the domestic price ratio. By exporting calculators, Italy however gains more than Sweden. This
is because the difference between world relative price and domestic relative price of calculator is
greater for Italy than that for Sweden. For Italy the difference in relative price is (1.5- 0.5) = 1. In
Sweden, the difference is (2 – 1.5) = 0.5. Italy thus earns a higher profit from exporting
calculators. When countries participate in trade, the owners of abundant factor inputs are
benefitted as they receive a higher return. Italy and Sweden are skilled-labor abundant nation.
Both the nation therefore uses skilled labors to produce the specialized goods. This results in a
high wage for skilled laborers in both the nations (Burstein and Vogel 2017). Skilled labors in
both nation thus benefitted from trade. As both the nation intensively use skilled labors, unskilled
labors suffer a loss from a decline in wage. Laborers employed in producing the specialized
goods benefitted at the cost of unskilled laborers.
11INTERNATIONAL TRADE
Reference list
Balassa, B., 2013. The theory of economic integration (routledge revivals). Routledge.
Burstein, A. and Vogel, J., 2017. International trade, technology, and the skill premium. Journal
of Political Economy, 125(5), pp.1356-1412.
Chacholiades, M., 2017. The pure theory of international trade. Routledge.
Costinot, A. and Vogel, J., 2015. Beyond Ricardo: Assignment models in international
trade. economics, 7(1), pp.31-62.
Helpman, E., Itskhoki, O., Muendler, M.A. and Redding, S.J., 2017. Trade and inequality: From
theory to estimation. The Review of Economic Studies, 84(1), pp.357-405.
Jakel, I.C. and Smolka, M., 2013. Individual attitudes towards trade: Stolper-Samuelson
revisited. Open Economies Review, 24(4), pp.731-761.
Leromain, E. and Orefice, G., 2014. New revealed comparative advantage index: dataset and
empirical distribution. International Economics, 139, pp.48-70.
Levchenko, A.A. and Zhang, J., 2016. The evolution of comparative advantage: Measurement
and welfare implications. Journal of Monetary Economics, 78, pp.96-111.
Mertler, C.A. and Reinhart, R.V., 2016. Advanced and multivariate statistical methods:
Practical application and interpretation. Routledge.
Mingst, K.A. and Arreguin-Toft, I.M., 2013. Essentials of International Relations: Sixth
International Student Edition. WW Norton & Company.
⊘ This is a preview!⊘
Do you want full access?
Subscribe today to unlock all pages.
Trusted by 1+ million students worldwide
1 out of 13
Related Documents


Your All-in-One AI-Powered Toolkit for Academic Success.
+13062052269
info@desklib.com
Available 24*7 on WhatsApp / Email
![[object Object]](/_next/static/media/star-bottom.7253800d.svg)
Unlock your academic potential
Copyright © 2020–2026 A2Z Services. All Rights Reserved. Developed and managed by ZUCOL.