Economic Analysis: International Trade in Italy and Sweden, 2019

Verified

Added on  2023/04/25

|9
|1219
|109
Report
AI Summary
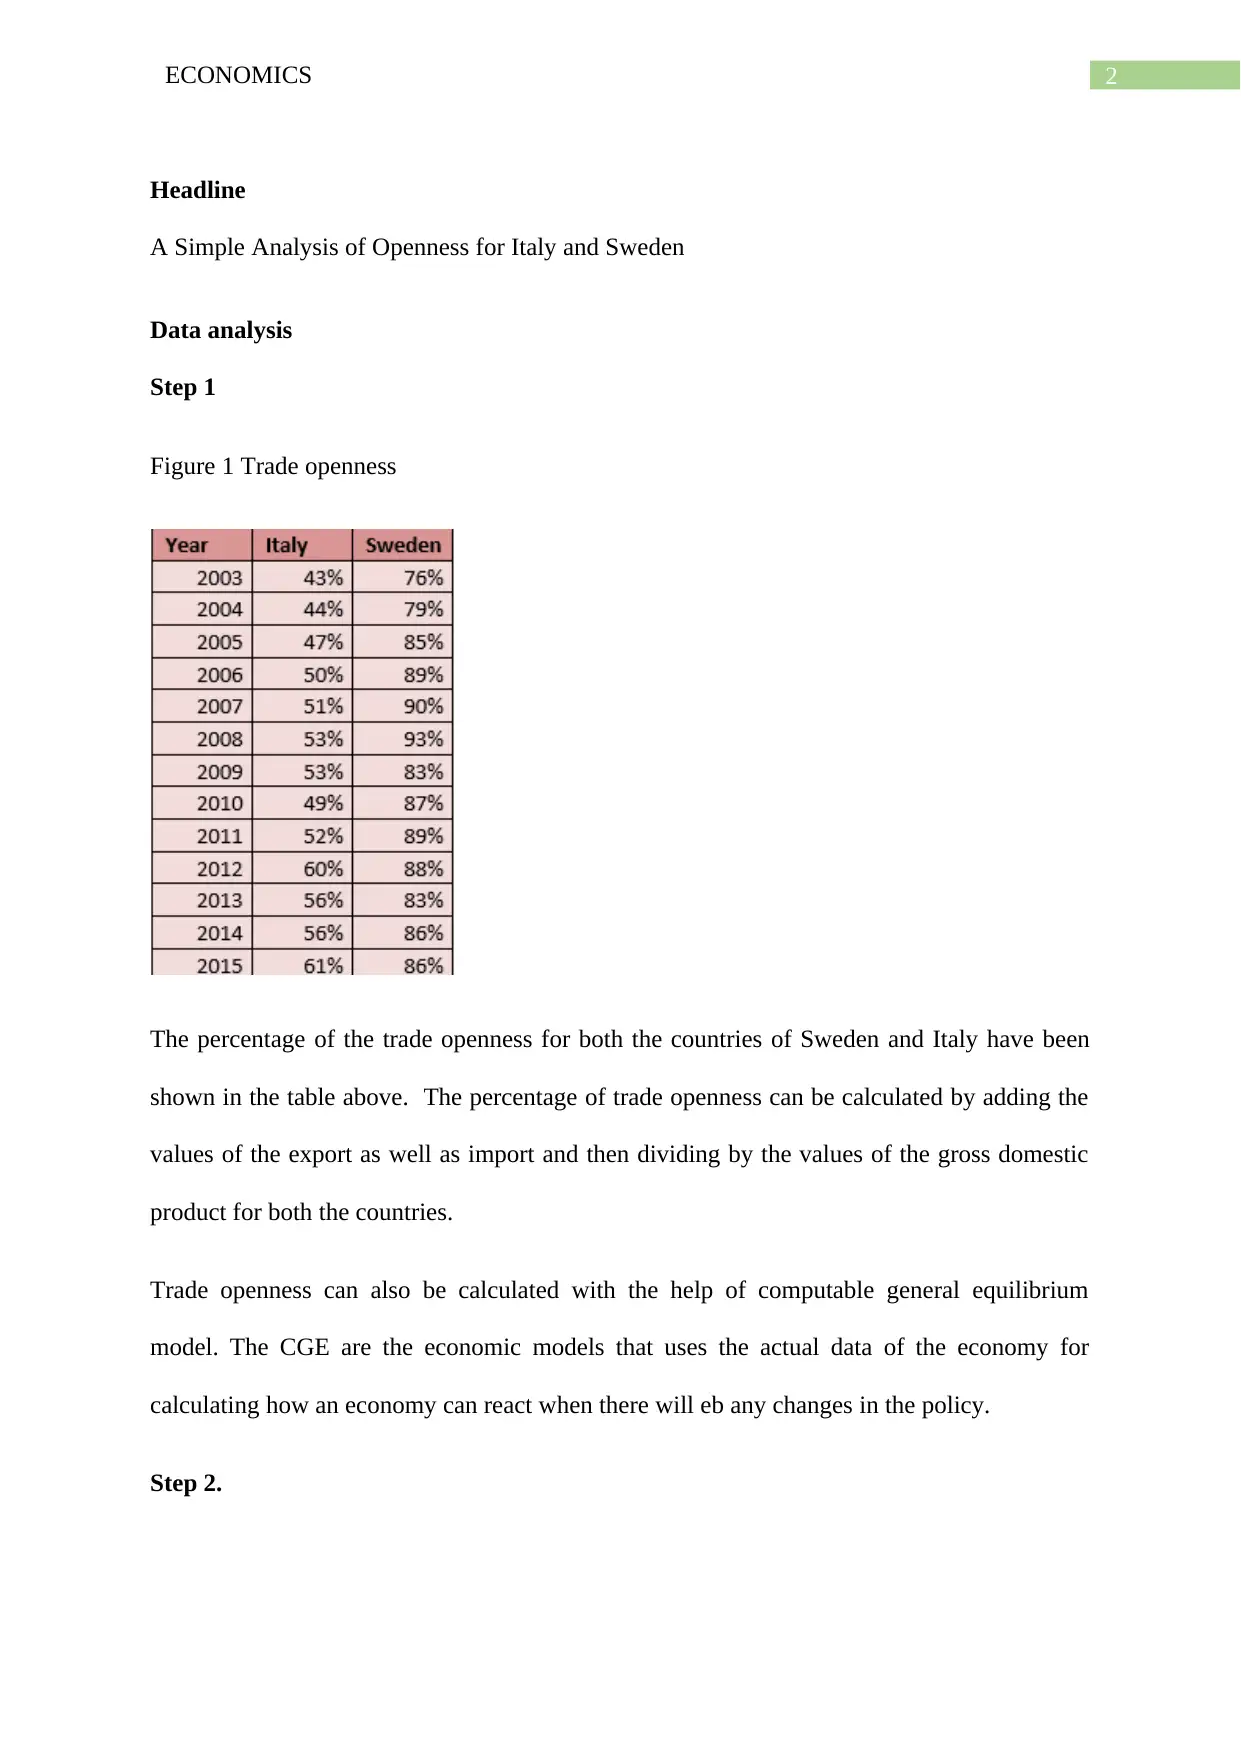
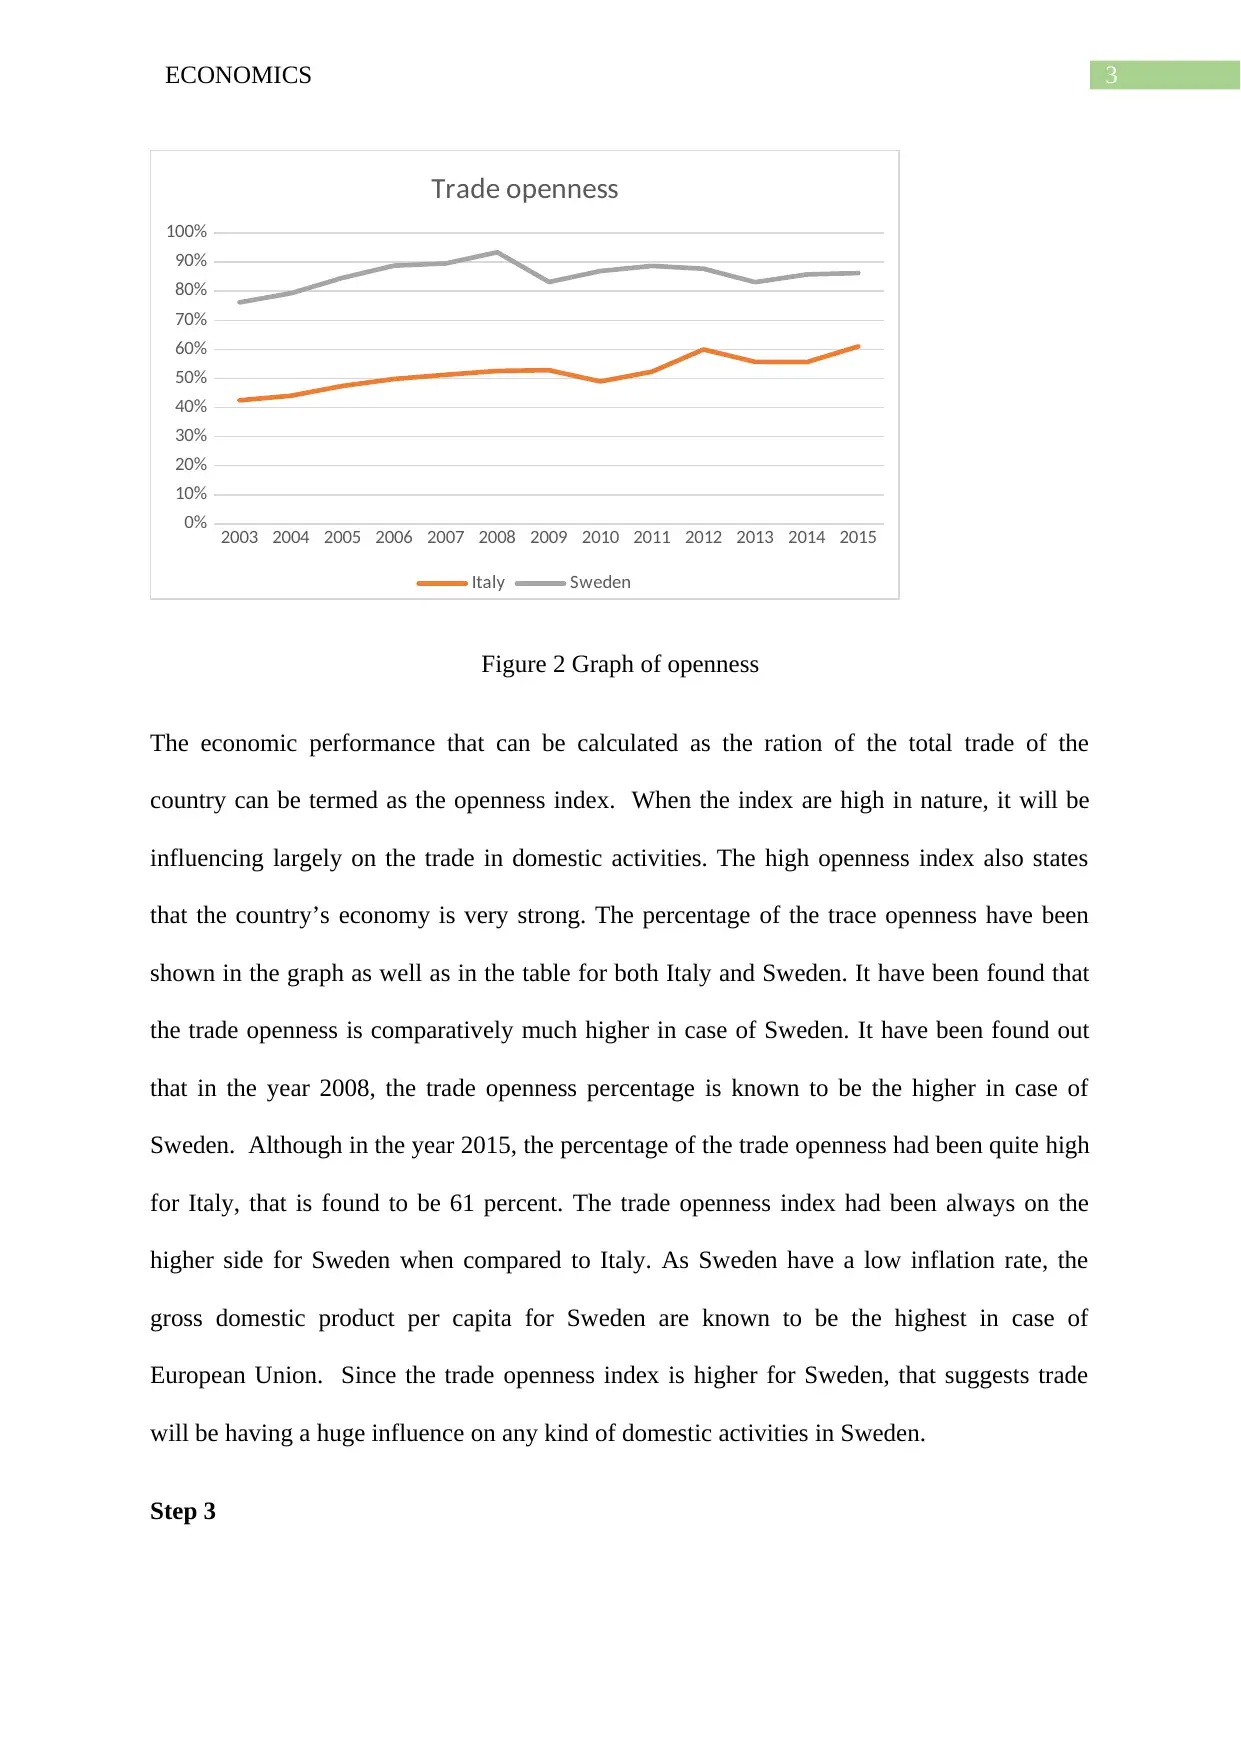
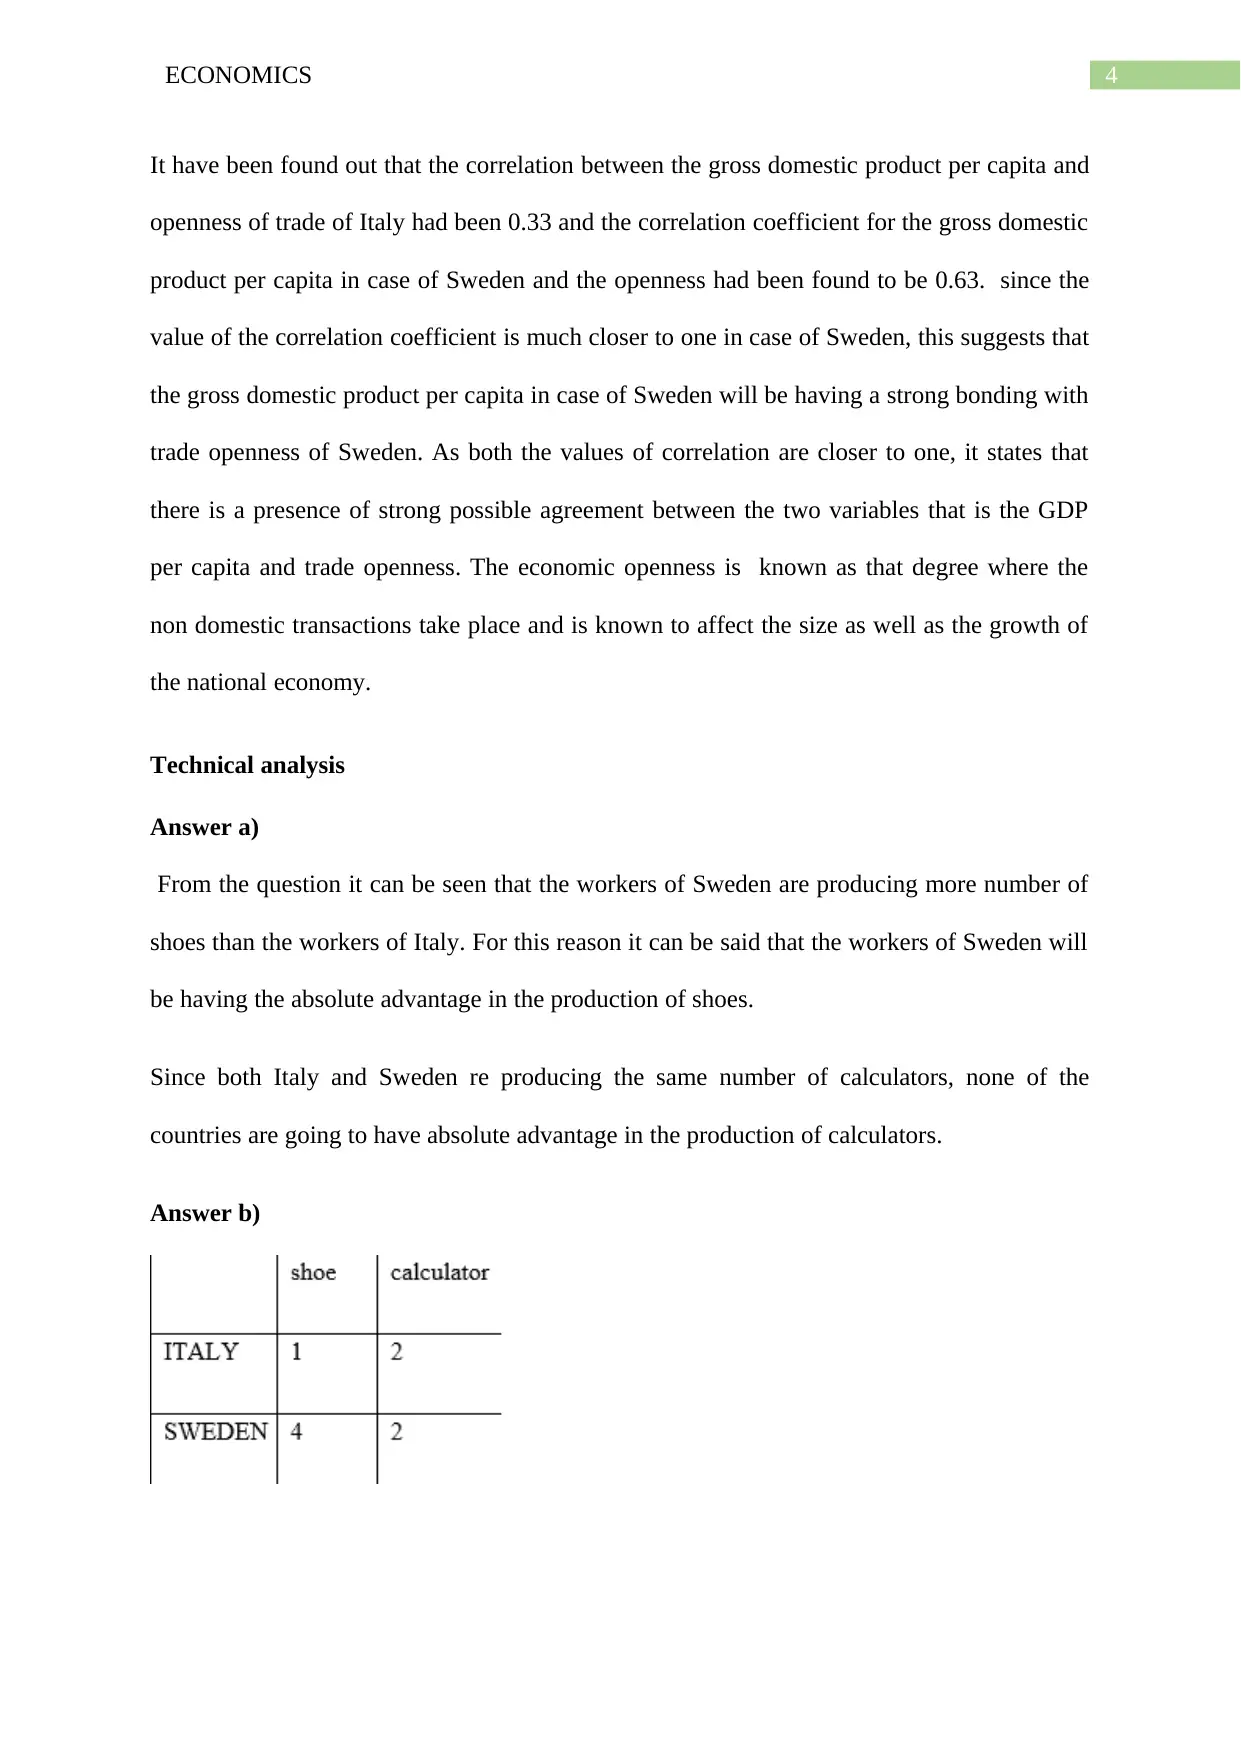
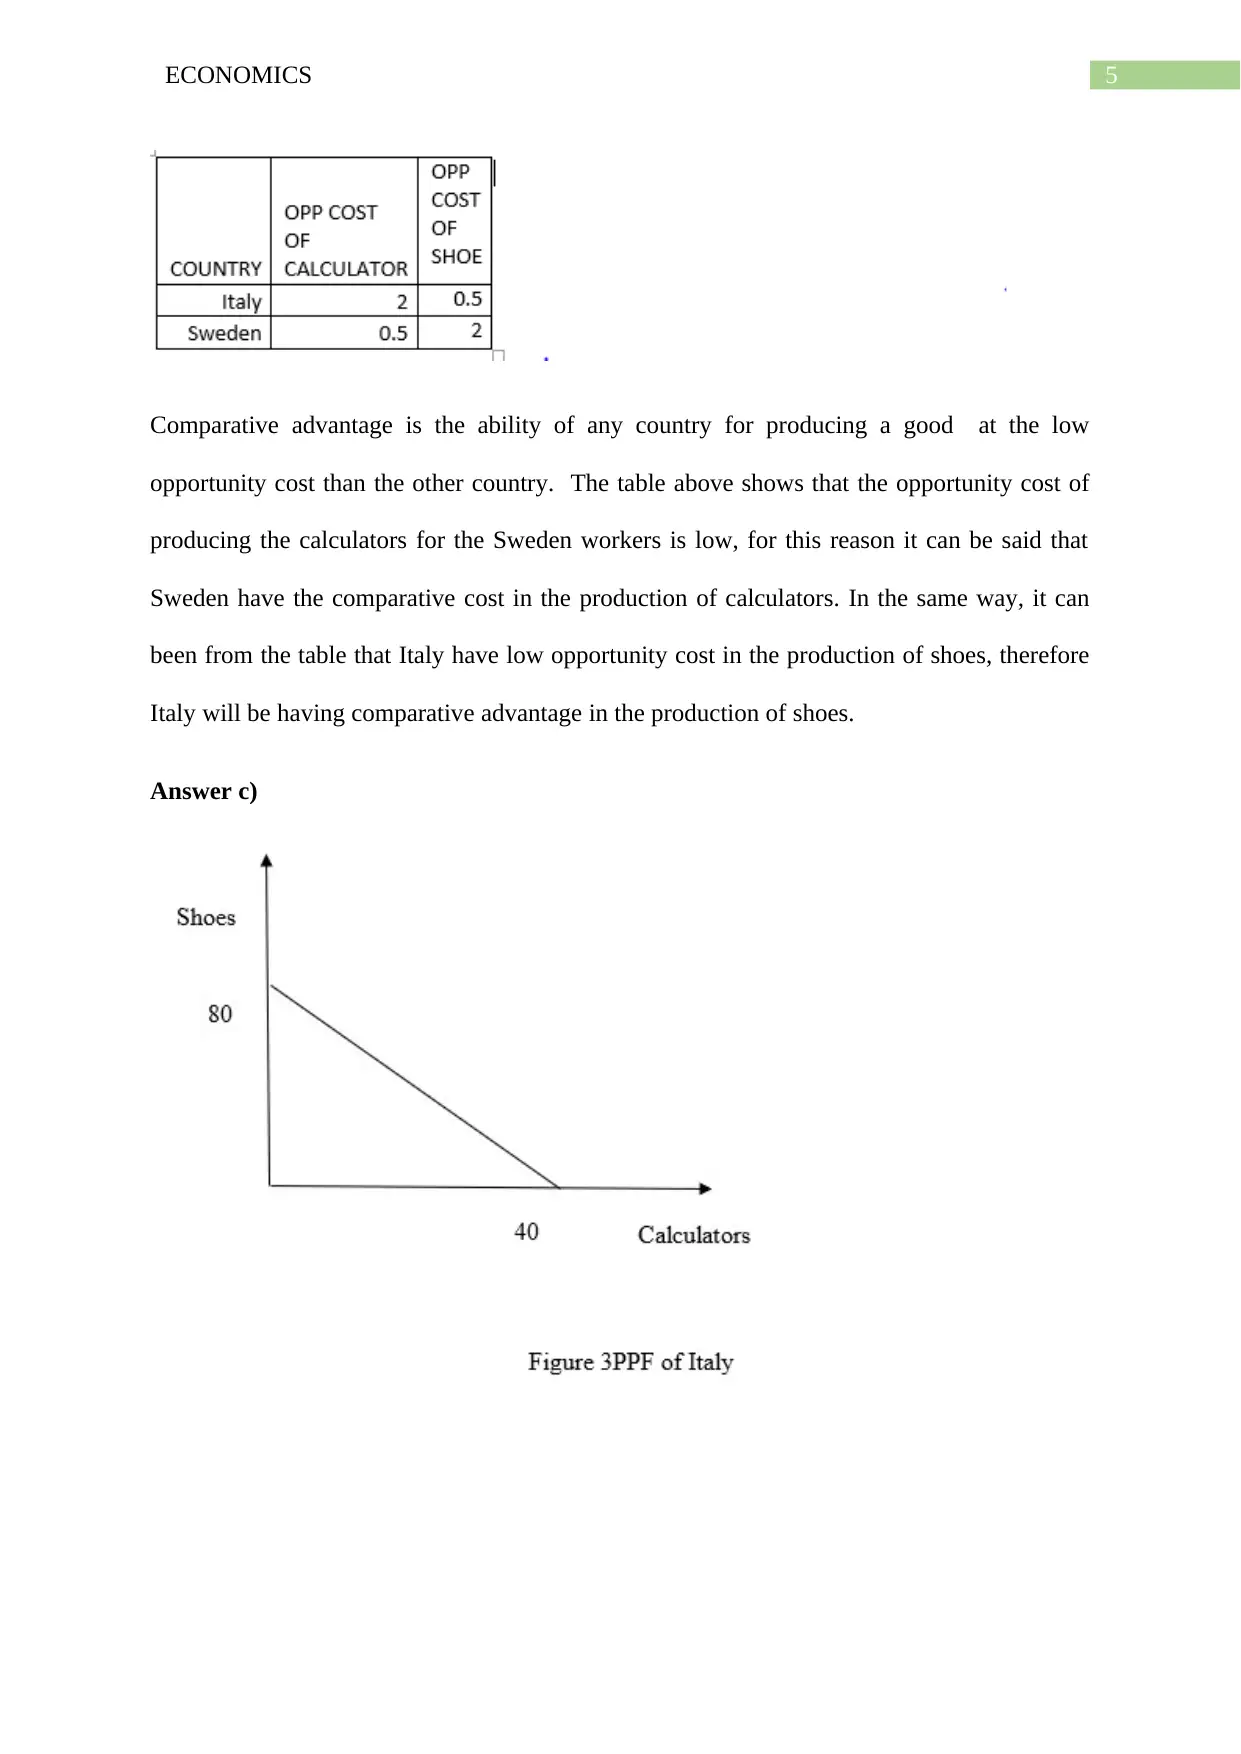
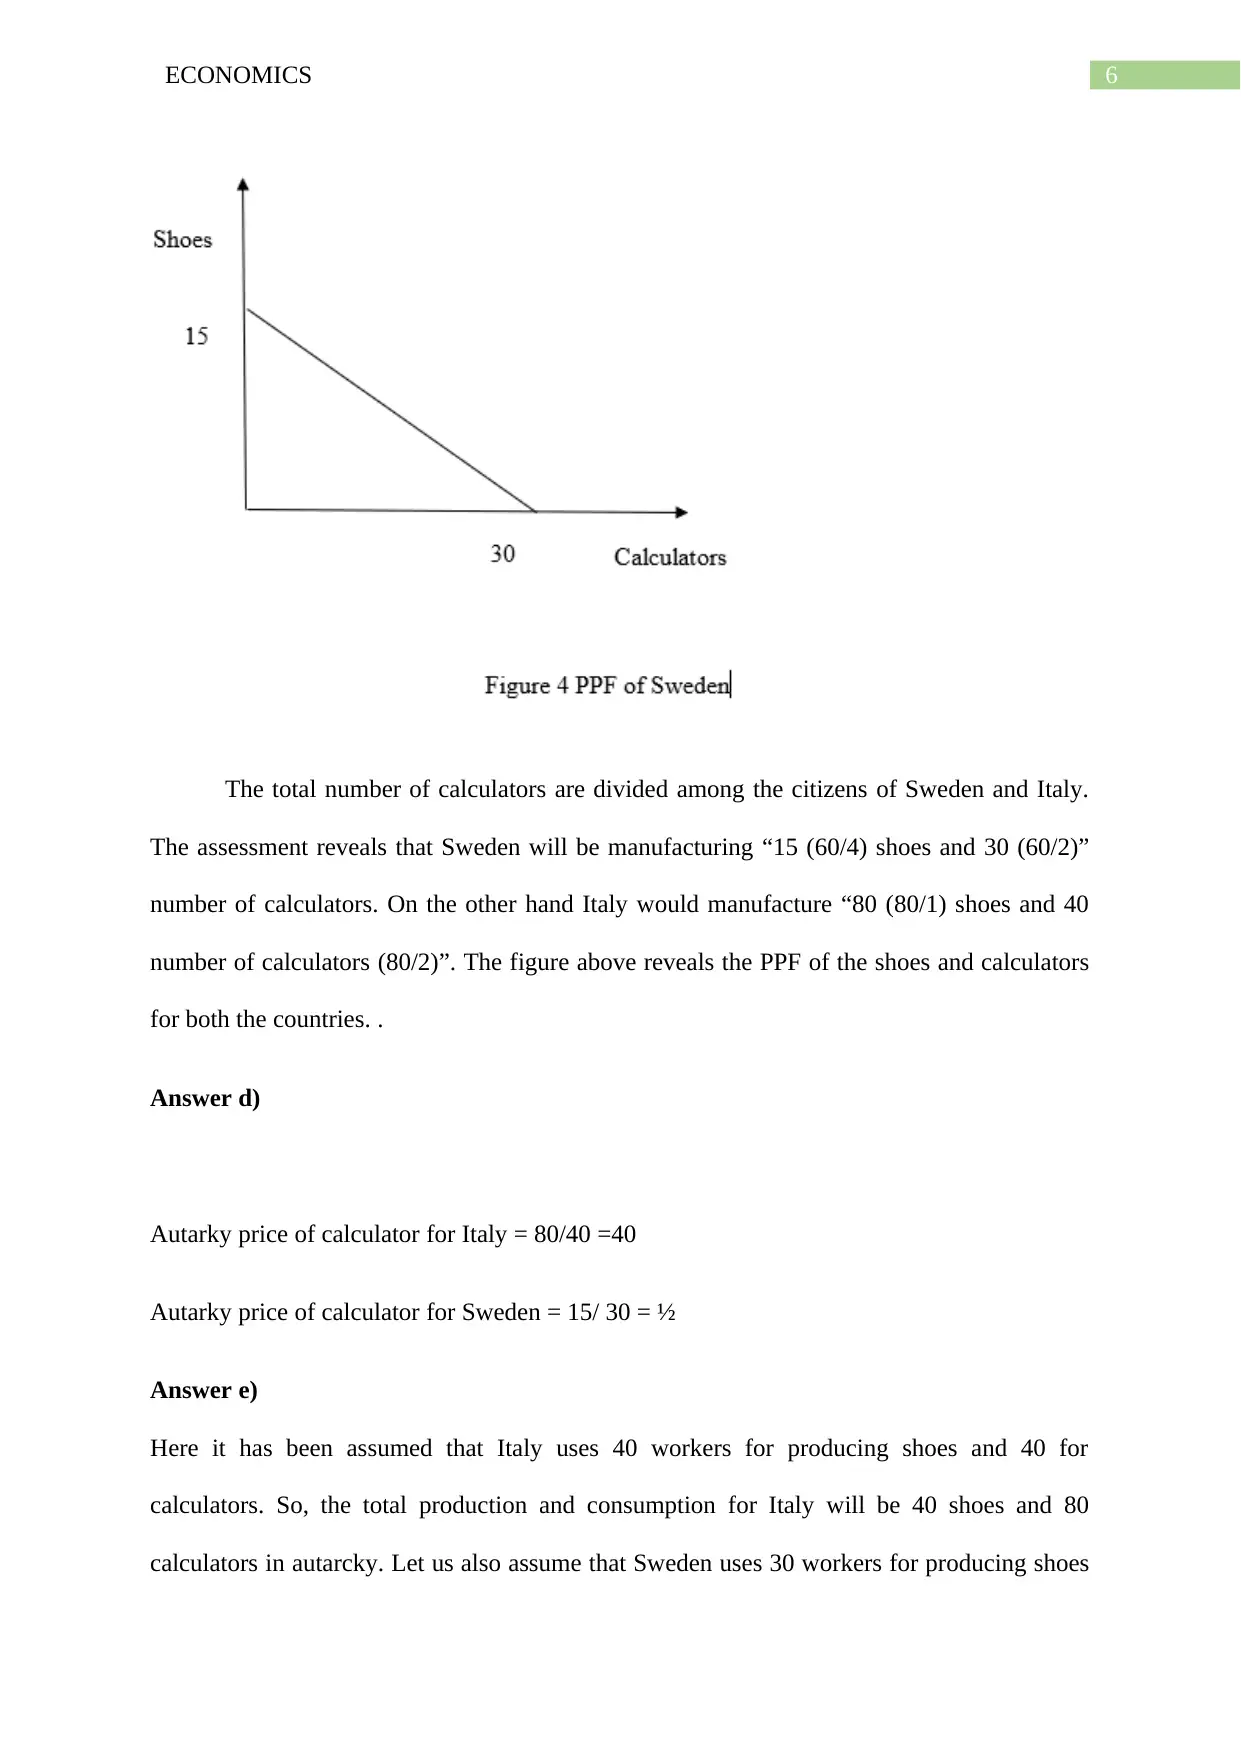
This report provides an economic analysis of international trade between Italy and Sweden. It includes a data analysis of trade openness, calculating and comparing the trade openness percentages for both countries from 2003 to 2015, along with correlation coefficients between GDP per capita and trade openness. The report then uses the Ricardian model to analyze comparative advantage in shoe and calculator production, determining which country has absolute and comparative advantages. Production possibility frontiers are constructed, and autarky prices are calculated. Finally, the report examines production and consumption levels under autarky, providing a comprehensive overview of the trade dynamics between Italy and Sweden. Desklib offers a wealth of similar solved assignments and past papers to aid students in their studies.
tabler-icon-diamond-filled.svg

Contribute Materials

Your contribution can guide someone’s learning journey. Share your documents today.
Document Page
Running head: ECONOMICS
Economics
Name of the student
Name of the university
Author note
tabler-icon-diamond-filled.svg

Secure Best Marks with AI Grader

Need help grading? Try our AI Grader for instant feedback on your assignments.
Document Page
1ECONOMICS
Table of Contents
Headline.....................................................................................................................................2
Data analysis..............................................................................................................................2
Technical analysis......................................................................................................................4
Answer a)...............................................................................................................................4
Answer b)...............................................................................................................................4
Answer c)...............................................................................................................................5
Answer d)...............................................................................................................................6
Answer e)...............................................................................................................................6
Reference list..............................................................................................................................8
Document Page
2ECONOMICS
Headline
A Simple Analysis of Openness for Italy and Sweden
Data analysis
Step 1
Figure 1 Trade openness
The percentage of the trade openness for both the countries of Sweden and Italy have been
shown in the table above. The percentage of trade openness can be calculated by adding the
values of the export as well as import and then dividing by the values of the gross domestic
product for both the countries.
Trade openness can also be calculated with the help of computable general equilibrium
model. The CGE are the economic models that uses the actual data of the economy for
calculating how an economy can react when there will eb any changes in the policy.
Step 2.
Document Page
3ECONOMICS
2003 2004 2005 2006 2007 2008 2009 2010 2011 2012 2013 2014 2015
0%
10%
20%
30%
40%
50%
60%
70%
80%
90%
100%
Trade openness
Italy Sweden
Figure 2 Graph of openness
The economic performance that can be calculated as the ration of the total trade of the
country can be termed as the openness index. When the index are high in nature, it will be
influencing largely on the trade in domestic activities. The high openness index also states
that the country’s economy is very strong. The percentage of the trace openness have been
shown in the graph as well as in the table for both Italy and Sweden. It have been found that
the trade openness is comparatively much higher in case of Sweden. It have been found out
that in the year 2008, the trade openness percentage is known to be the higher in case of
Sweden. Although in the year 2015, the percentage of the trade openness had been quite high
for Italy, that is found to be 61 percent. The trade openness index had been always on the
higher side for Sweden when compared to Italy. As Sweden have a low inflation rate, the
gross domestic product per capita for Sweden are known to be the highest in case of
European Union. Since the trade openness index is higher for Sweden, that suggests trade
will be having a huge influence on any kind of domestic activities in Sweden.
Step 3
tabler-icon-diamond-filled.svg

Secure Best Marks with AI Grader

Need help grading? Try our AI Grader for instant feedback on your assignments.
Document Page
4ECONOMICS
It have been found out that the correlation between the gross domestic product per capita and
openness of trade of Italy had been 0.33 and the correlation coefficient for the gross domestic
product per capita in case of Sweden and the openness had been found to be 0.63. since the
value of the correlation coefficient is much closer to one in case of Sweden, this suggests that
the gross domestic product per capita in case of Sweden will be having a strong bonding with
trade openness of Sweden. As both the values of correlation are closer to one, it states that
there is a presence of strong possible agreement between the two variables that is the GDP
per capita and trade openness. The economic openness is known as that degree where the
non domestic transactions take place and is known to affect the size as well as the growth of
the national economy.
Technical analysis
Answer a)
From the question it can be seen that the workers of Sweden are producing more number of
shoes than the workers of Italy. For this reason it can be said that the workers of Sweden will
be having the absolute advantage in the production of shoes.
Since both Italy and Sweden re producing the same number of calculators, none of the
countries are going to have absolute advantage in the production of calculators.
Answer b)
Document Page
5ECONOMICS
Comparative advantage is the ability of any country for producing a good at the low
opportunity cost than the other country. The table above shows that the opportunity cost of
producing the calculators for the Sweden workers is low, for this reason it can be said that
Sweden have the comparative cost in the production of calculators. In the same way, it can
been from the table that Italy have low opportunity cost in the production of shoes, therefore
Italy will be having comparative advantage in the production of shoes.
Answer c)
Document Page
6ECONOMICS
The total number of calculators are divided among the citizens of Sweden and Italy.
The assessment reveals that Sweden will be manufacturing “15 (60/4) shoes and 30 (60/2)”
number of calculators. On the other hand Italy would manufacture “80 (80/1) shoes and 40
number of calculators (80/2)”. The figure above reveals the PPF of the shoes and calculators
for both the countries. .
Answer d)
Autarky price of calculator for Italy = 80/40 =40
Autarky price of calculator for Sweden = 15/ 30 = ½
Answer e)
Here it has been assumed that Italy uses 40 workers for producing shoes and 40 for
calculators. So, the total production and consumption for Italy will be 40 shoes and 80
calculators in autarcky. Let us also assume that Sweden uses 30 workers for producing shoes
tabler-icon-diamond-filled.svg

Paraphrase This Document

Need a fresh take? Get an instant paraphrase of this document with our AI Paraphraser
Document Page
7ECONOMICS
and the other 30 for producing calculators. In total, Sweden will produce and consume 240
shoes along with 120 calculators.
Document Page
8ECONOMICS
Reference list
Calligaris, S., Del Gatto, M., Hassan, F., Ottaviano, G.I. and Schivardi, F., 2016. Italy’s
productivity conundrum. a study on resource misallocation in Italy (No. 030). Directorate
General Economic and Financial Affairs (DG ECFIN), European Commission.
Fonte, M. and Cucco, I., 2015. 14. The political economy of alternative agriculture in
Italy. Handbook of the international political economy of agriculture and food, p.264.
Lawrence, P. and Spybey, T., 2018. Management and society in Sweden. Routledge.
Markovits, A., Gourevitch, P., Ross, G., Martin, A., Bornstein, S. and Allen, C.,
2016. Unions and Economic Crisis: Britain, West Germany and Sweden. Routledge.
Spencer, N., Huws, U., Syrdal, D. and Holts, K., 2018. Work in the European Gig Economy:
Research Results from the UK, Sweden, Germany, Austria, the Netherlands, Switzerland and
Italy.
Waldenström, D., 2017. Wealth-income ratios in a small, developing economy: Sweden,
1810–2014. The Journal of Economic History, 77(1), pp.285-313.
chevron_up_icon
1 out of 9
circle_padding
hide_on_mobile
zoom_out_icon
logo.png

Your All-in-One AI-Powered Toolkit for Academic Success.

Available 24*7 on WhatsApp / Email

[object Object]