ITD101 Crime Statistics: Technology in Crime Prevention Methods

Verified

Added on  2023/06/13

|3
|524
|340
Report
AI Summary
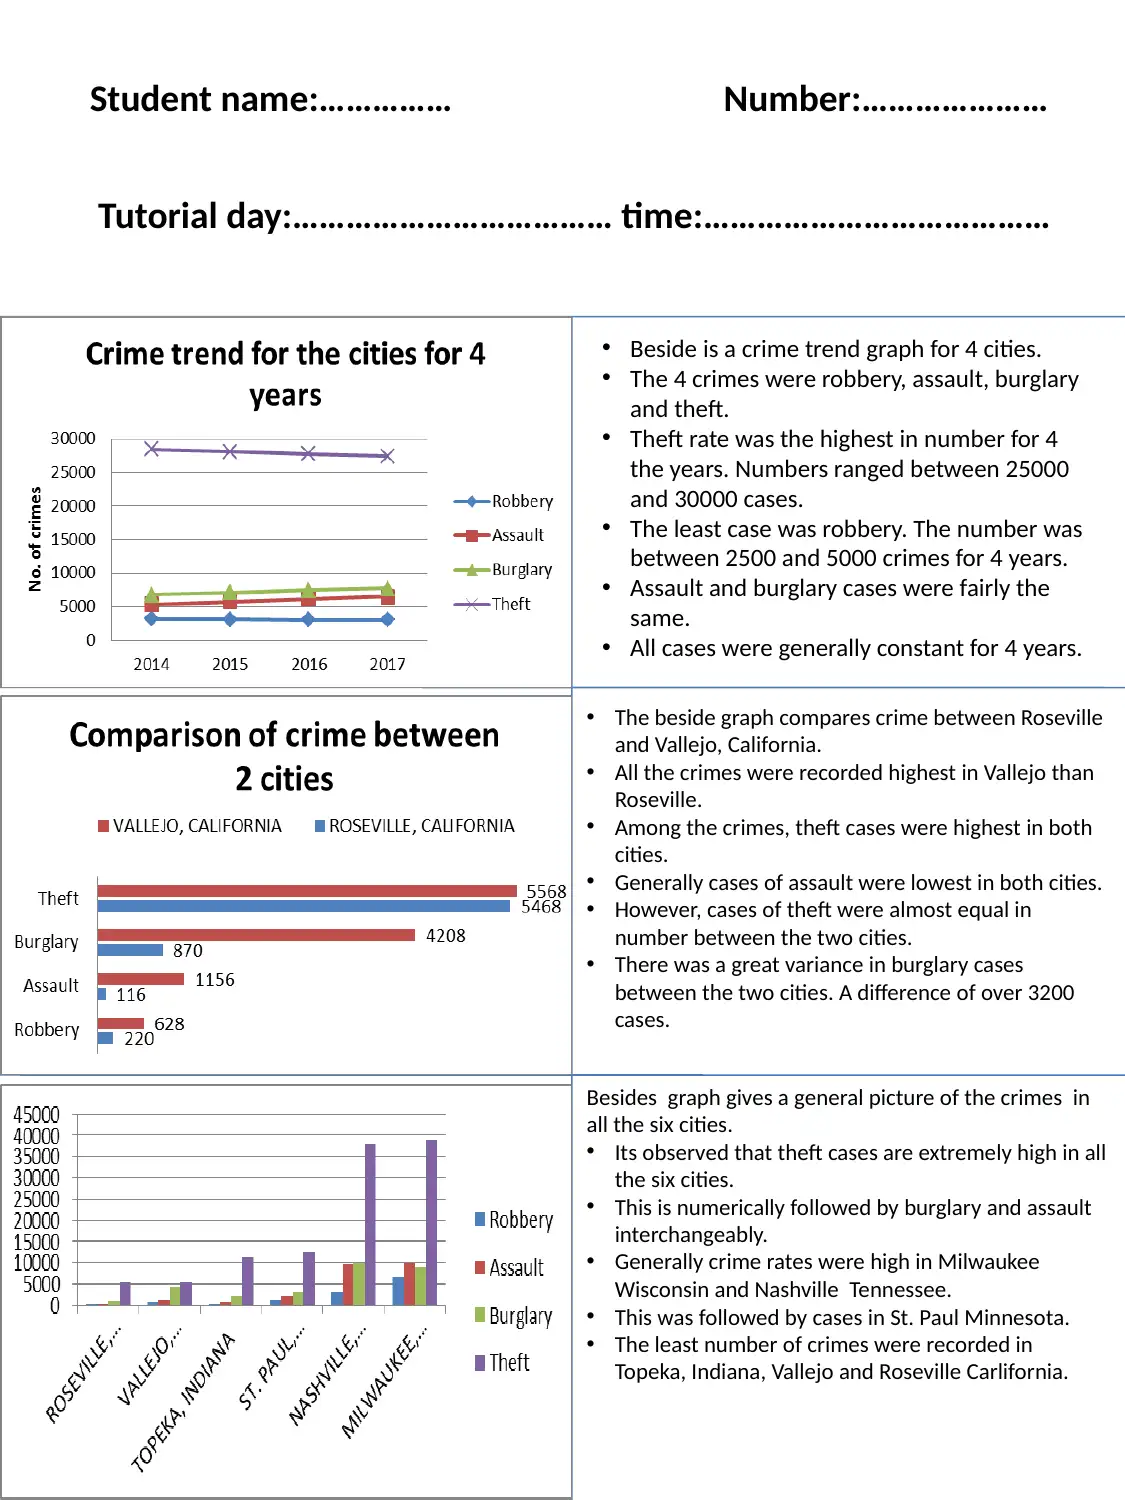
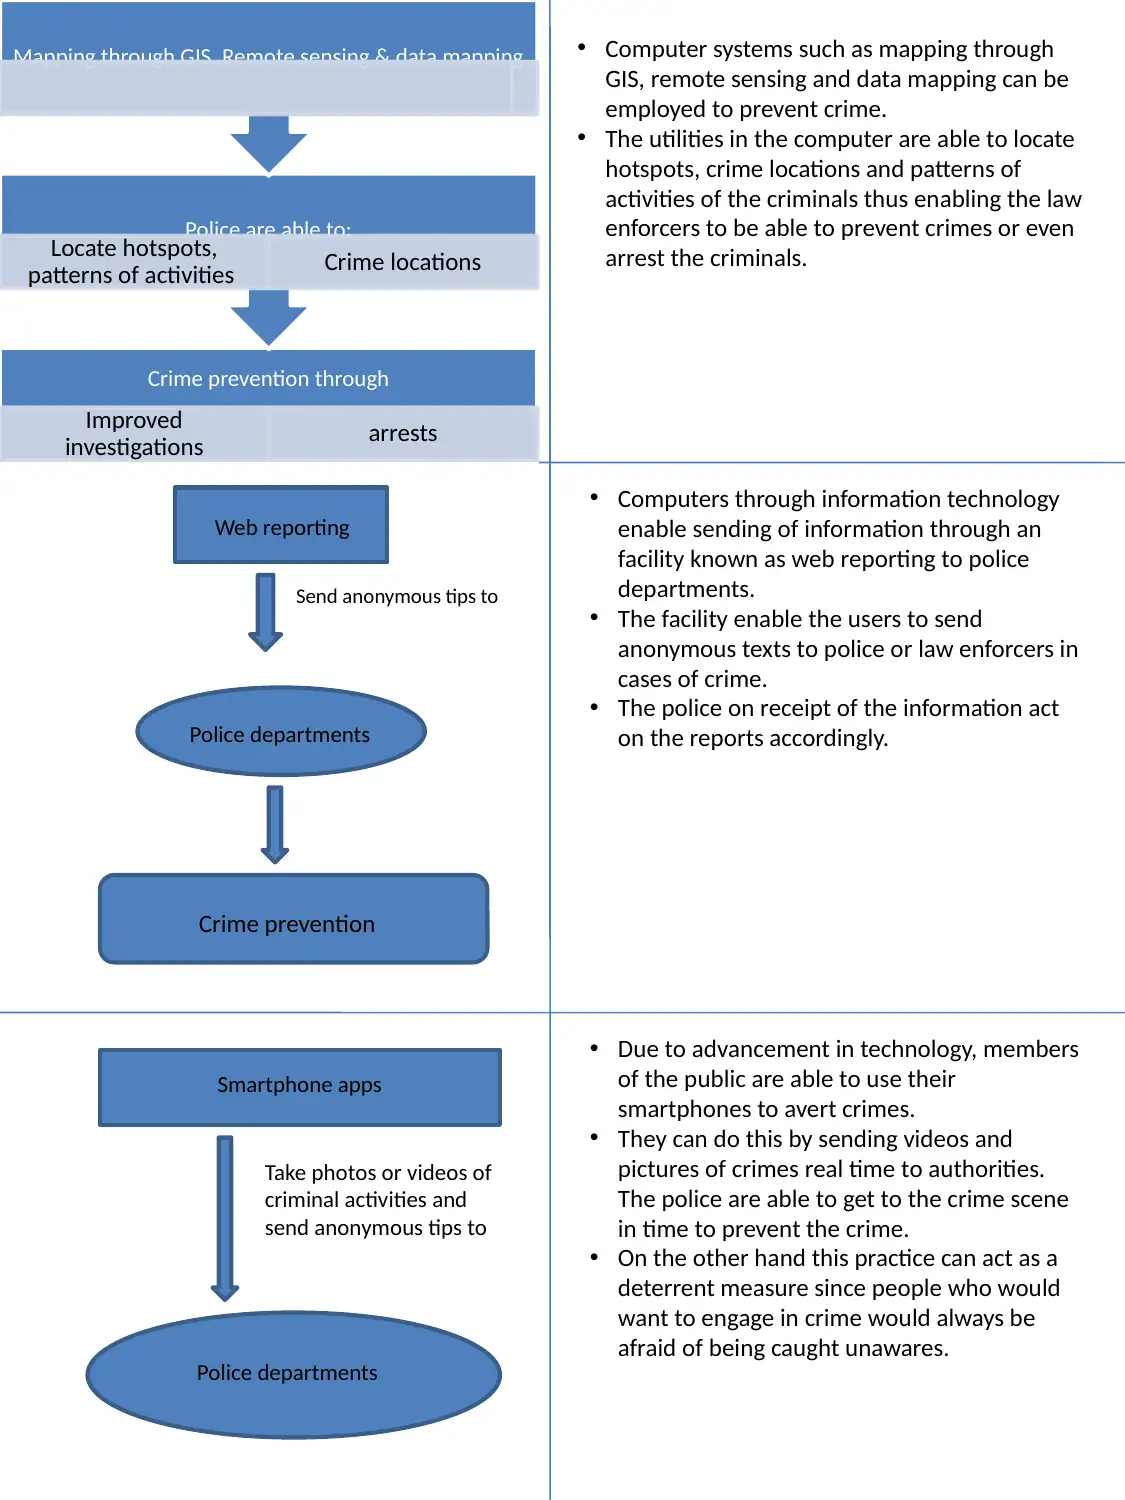
This report analyzes crime statistics across various cities, highlighting trends in robbery, assault, burglary, and theft. It compares crime rates between Roseville and Vallejo, California, and provides a general overview of crime in six cities, noting the prevalence of theft. The report emphasizes the use of technology in crime prevention, including GIS mapping for locating hotspots and patterns, web reporting for anonymous tips, and smartphone apps for real-time reporting. It also discusses how these technologies enable law enforcement to prevent crimes and apprehend criminals. The document is a student submission and more resources can be found on Desklib.
tabler-icon-diamond-filled.svg

Contribute Materials

Your contribution can guide someone’s learning journey. Share your documents today.
Document Page
Research
Crime survey report
tabler-icon-diamond-filled.svg

Secure Best Marks with AI Grader

Need help grading? Try our AI Grader for instant feedback on your assignments.
Document Page
Student name:…………… Number:…………………
Tutorial day:……………………………… time:…………………………………
Beside is a crime trend graph for 4 cities.
The 4 crimes were robbery, assault, burglary
and theft.
Theft rate was the highest in number for 4
the years. Numbers ranged between 25000
and 30000 cases.
The least case was robbery. The number was
between 2500 and 5000 crimes for 4 years.
Assault and burglary cases were fairly the
same.
All cases were generally constant for 4 years.
The beside graph compares crime between Roseville
and Vallejo, California.
All the crimes were recorded highest in Vallejo than
Roseville.
Among the crimes, theft cases were highest in both
cities.
Generally cases of assault were lowest in both cities.
However, cases of theft were almost equal in
number between the two cities.
There was a great variance in burglary cases
between the two cities. A difference of over 3200
cases.
Besides graph gives a general picture of the crimes in
all the six cities.
Its observed that theft cases are extremely high in all
the six cities.
This is numerically followed by burglary and assault
interchangeably.
Generally crime rates were high in Milwaukee
Wisconsin and Nashville Tennessee.
This was followed by cases in St. Paul Minnesota.
The least number of crimes were recorded in
Topeka, Indiana, Vallejo and Roseville Carlifornia.
Document Page
Crime prevention through
Improved
investigations arrests
Police are able to;
Locate hotspots,
patterns of activities Crime locations
Mapping through GIS, Remote sensing & data mapping
Web reporting
Police departments
Crime prevention
Send anonymous tips to
Smartphone apps
Police departments
Take photos or videos of
criminal activities and
send anonymous tips to
Due to advancement in technology, members
of the public are able to use their
smartphones to avert crimes.
They can do this by sending videos and
pictures of crimes real time to authorities.
The police are able to get to the crime scene
in time to prevent the crime.
On the other hand this practice can act as a
deterrent measure since people who would
want to engage in crime would always be
afraid of being caught unawares.
Computer systems such as mapping through
GIS, remote sensing and data mapping can be
employed to prevent crime.
The utilities in the computer are able to locate
hotspots, crime locations and patterns of
activities of the criminals thus enabling the law
enforcers to be able to prevent crimes or even
arrest the criminals.
Computers through information technology
enable sending of information through an
facility known as web reporting to police
departments.
The facility enable the users to send
anonymous texts to police or law enforcers in
cases of crime.
The police on receipt of the information act
on the reports accordingly.
chevron_up_icon
1 out of 3
circle_padding
hide_on_mobile
zoom_out_icon
logo.png

Your All-in-One AI-Powered Toolkit for Academic Success.

Available 24*7 on WhatsApp / Email

[object Object]