ITECH1100 Understanding the Digital Revolution Assignment 1 - Analysis

Verified

Added on  2023/04/21

|7
|1157
|186
Homework Assignment
AI Summary
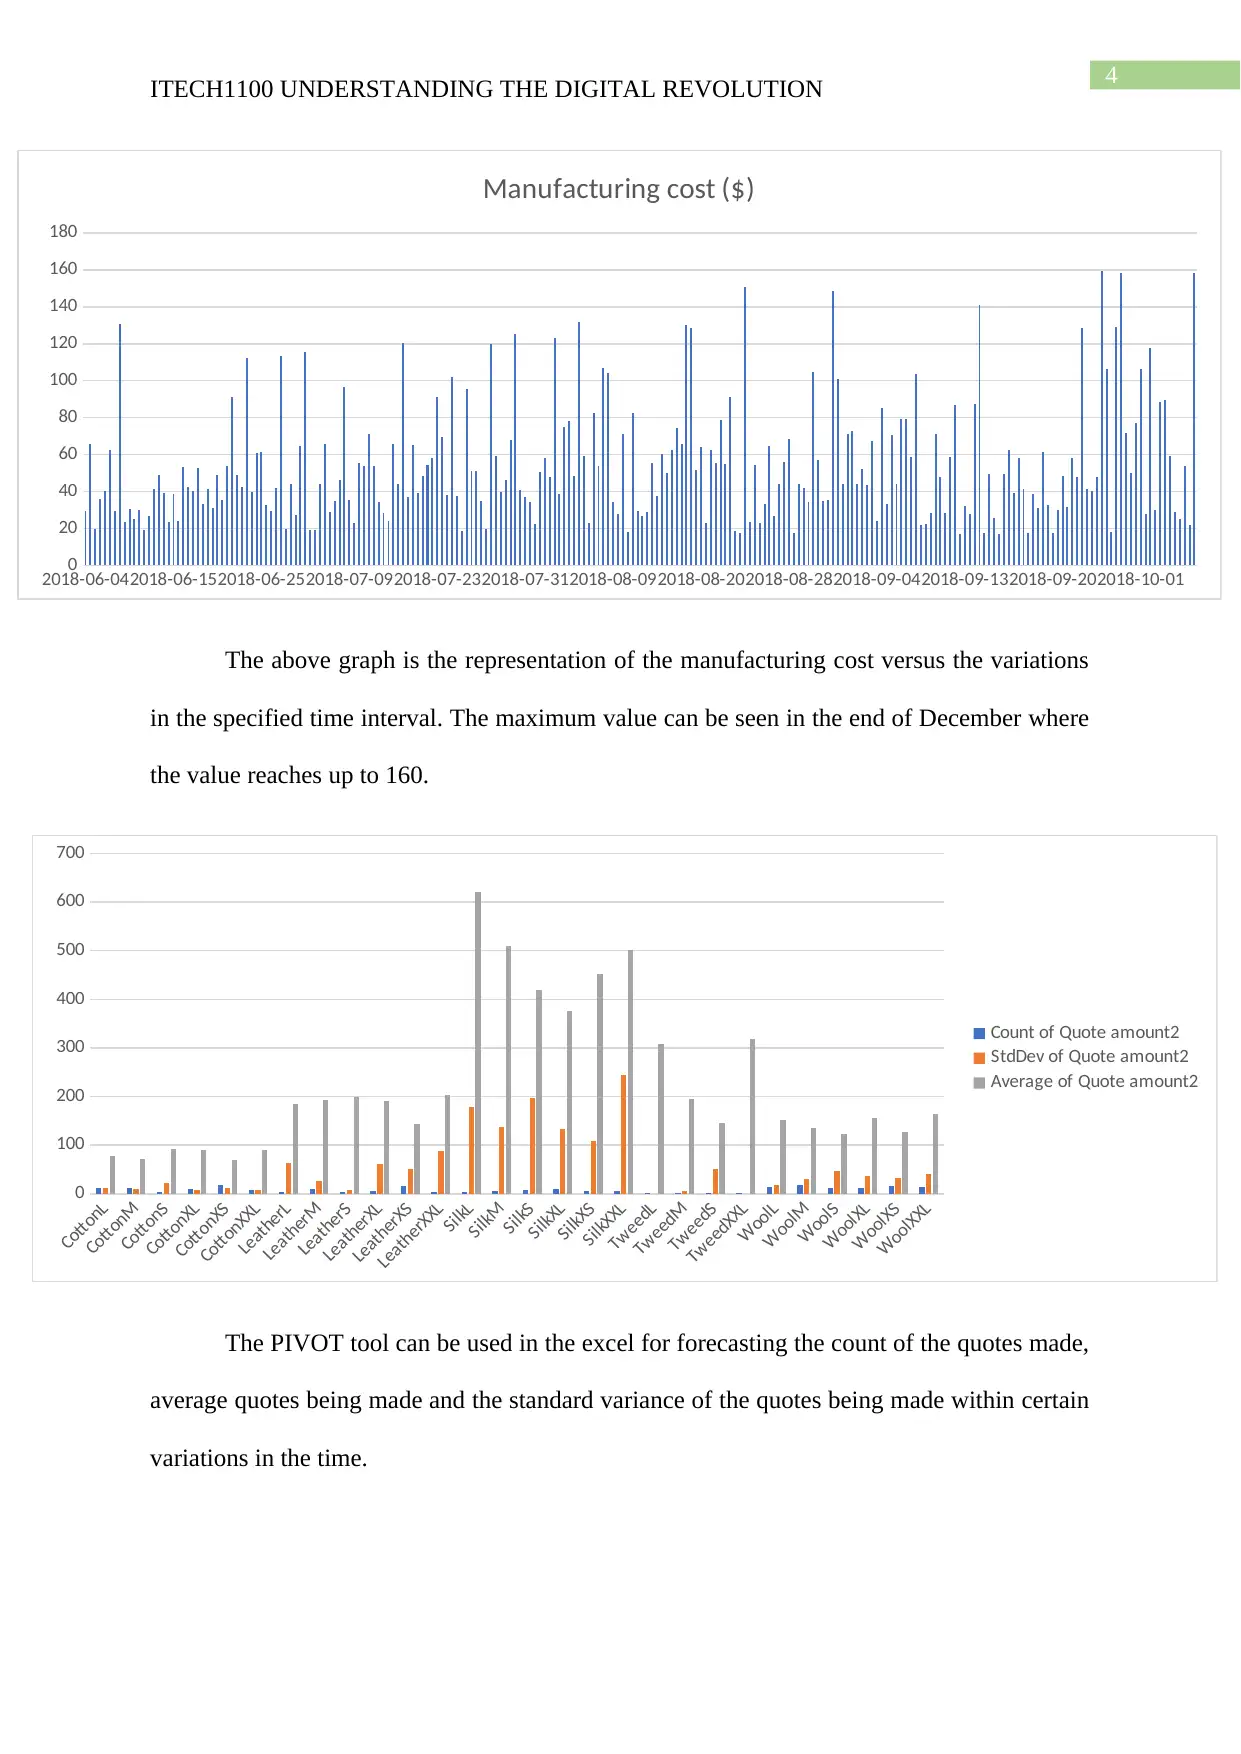
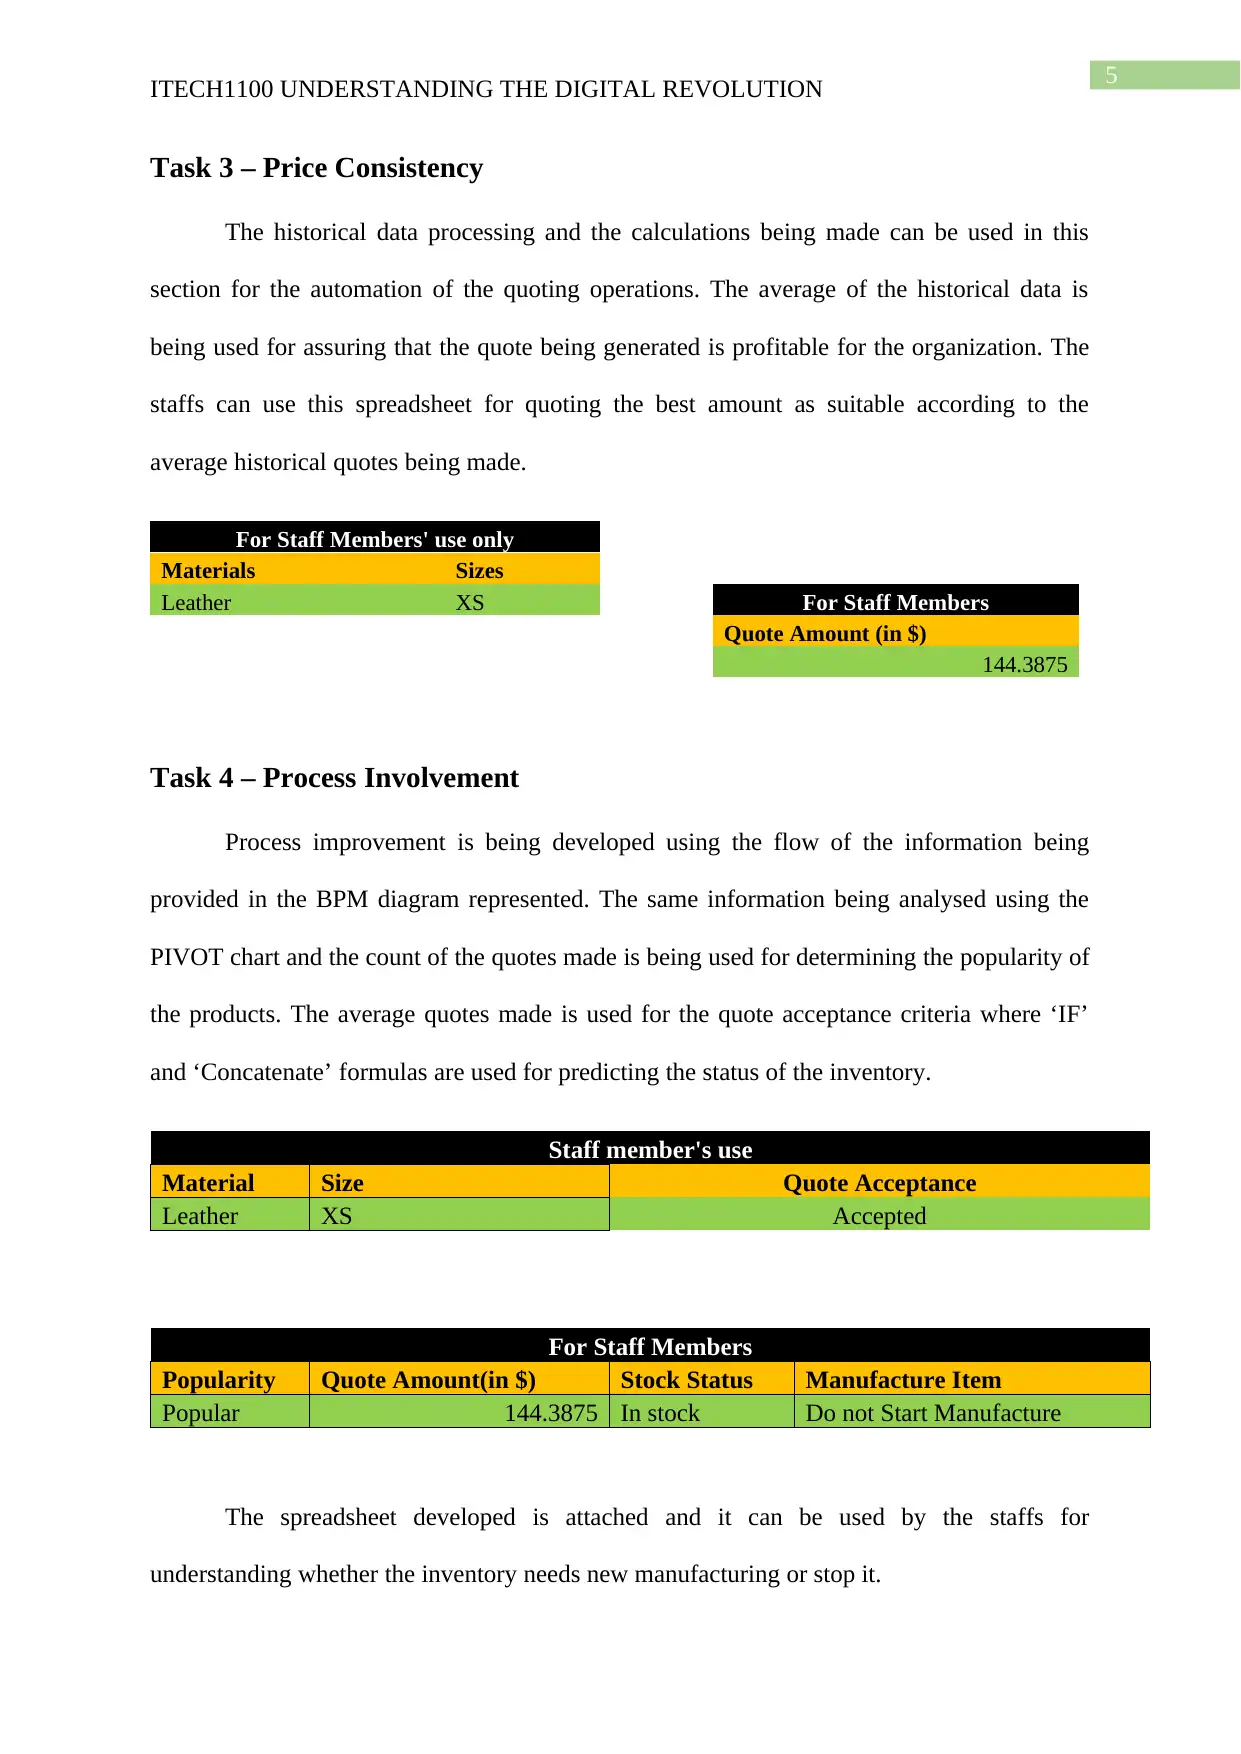
This assignment solution for ITECH1100 Understanding the Digital Revolution focuses on automating business processes using Microsoft Excel. The student creates an ePortfolio and addresses several tasks, including calculating employee costs, analyzing order information through data visualization (graphs), and ensuring price consistency using historical data. The solution utilizes Excel formulas for calculations, pivot tables for forecasting, and 'IF' and 'Concatenate' formulas to determine inventory stock status. The assignment demonstrates the application of Excel for data analysis, process improvement, and decision-making in a business context. The student's work covers setting up the portfolio, calculating costs, analyzing order data, and implementing a process for price consistency and inventory management using Excel spreadsheets and charts. The document also includes a bibliography with relevant references.
Document Page
Running head: ITECH1100 UNDERSTANDING THE DIGITAL REVOLUTION
ITECH1100 Understanding the Digital Revolution
Assignment 1 - Uniform Revival (30364196)
Name of the Student
Name of the University
Author’s Note
tabler-icon-diamond-filled.svg

Secure Best Marks with AI Grader

Need help grading? Try our AI Grader for instant feedback on your assignments.
Document Page
1
ITECH1100 UNDERSTANDING THE DIGITAL REVOLUTION
Table of Contents
Task 0 – Setting Up....................................................................................................................2
Task 1 – Cost of Operating the Business...................................................................................2
Task 2 – Order Information........................................................................................................3
Task 3 – Price Consistency........................................................................................................5
Task 4 – Process Involvement....................................................................................................5
Bibliography...............................................................................................................................7
Document Page
2
ITECH1100 UNDERSTANDING THE DIGITAL REVOLUTION
Task 0 – Setting Up
E Portfolio Page
This portfolio was all about calculating the total works being served by each of the
three members for which simple excel formulas are used. Basic multiplication and addition
formulas are used that lead to the outcome that the total working hours for Agnes is 25.5 hrs.
for Benjamin; it was 15 hrs. and for Calvin; it was 25.5 hrs. This result was derived through
calculating the working hours of every members in a week and summing them up to find total
working hours. The following table was developed using the Excel spreadsheet as attached.
Name Working days
Working
hours(in week)
Additional Working
hours( in week)
Total working
hours in week
Agnes
Monday,
Tuesday and
Wednesday 22.5 3 25.5
Benjamin
Thursday and
Friday 15 0 15
Calvin Every weekday 22.5 3 25.5
Task 1 – Cost of Operating the Business
Based on the provided information of the cost per hour for every employees, the
following calculation is being performed that can be used for calculating the annual cost of
all the three employees. The actual cost and fixed cost of the organization is being summed
for reaching at conclusion that the overall cost of the employees is $ 109096.
Name
No. of
Working days
in a week
Working
hours in a
week
Additional
working
hours in a
week
Total
working
hours in a
week
Hour
ly
rates(
in $)
Annua
l
cost(in
$)
Archie 3 22.5 3 25.5 26 34476
Barbara 2 15 0 15 26 20280
Carol 5 22.5 3 25.5 24 31824
Replaceme
nt
employee 66 39 10296
Document Page
3
ITECH1100 UNDERSTANDING THE DIGITAL REVOLUTION
Fixed cost(in $) 9100
Utility cost(in $) 3120
Total Outgoing cost (per
annum in $) 109096
The general mathematical formulas are used for summing up and multiplying the cost
per hour and hours spent by all the three employees in a year.
Task 2 – Order Information
2018-06-042018-06-152018-06-272018-07-112018-07-242018-08-022018-08-142018-08-222018-08-302018-09-072018-09-172018-09-25
0
100
200
300
400
500
600
700
800
900
Quote amount
Historical data made available is being used for forecasting the above graph. The
simple graph tool is being used for forecasting the quote amount being made within certain
interval of time. It demonstrates that at the end of the September, the quotes were high that
exceeded $800. Furthermore, another relation can be established through forecasting the
manufacturing cost versus the variations in time.
tabler-icon-diamond-filled.svg

Secure Best Marks with AI Grader

Need help grading? Try our AI Grader for instant feedback on your assignments.
Document Page
4
ITECH1100 UNDERSTANDING THE DIGITAL REVOLUTION
2018-06-042018-06-152018-06-252018-07-092018-07-232018-07-312018-08-092018-08-202018-08-282018-09-042018-09-132018-09-202018-10-01
0
20
40
60
80
100
120
140
160
180
Manufacturing cost ($)
The above graph is the representation of the manufacturing cost versus the variations
in the specified time interval. The maximum value can be seen in the end of December where
the value reaches up to 160.
CottonL
CottonM
CottonS
CottonXL
CottonXS
CottonXXL
LeatherL
LeatherM
LeatherS
LeatherXL
LeatherXS
LeatherXXL
SilkL
SilkM
SilkS
SilkXL
SilkXS
SilkXXL
TweedL
TweedM
TweedS
TweedXXL
WoolL
WoolM
WoolS
WoolXL
WoolXS
WoolXXL
0
100
200
300
400
500
600
700
Count of Quote amount2
StdDev of Quote amount2
Average of Quote amount2
The PIVOT tool can be used in the excel for forecasting the count of the quotes made,
average quotes being made and the standard variance of the quotes being made within certain
variations in the time.
Document Page
5
ITECH1100 UNDERSTANDING THE DIGITAL REVOLUTION
Task 3 – Price Consistency
The historical data processing and the calculations being made can be used in this
section for the automation of the quoting operations. The average of the historical data is
being used for assuring that the quote being generated is profitable for the organization. The
staffs can use this spreadsheet for quoting the best amount as suitable according to the
average historical quotes being made.
For Staff Members' use only
Materials Sizes
Leather XS For Staff Members
Quote Amount (in $)
144.3875
Task 4 – Process Involvement
Process improvement is being developed using the flow of the information being
provided in the BPM diagram represented. The same information being analysed using the
PIVOT chart and the count of the quotes made is being used for determining the popularity of
the products. The average quotes made is used for the quote acceptance criteria where ‘IF’
and ‘Concatenate’ formulas are used for predicting the status of the inventory.
Staff member's use
Material Size Quote Acceptance
Leather XS Accepted
For Staff Members
Popularity Quote Amount(in $) Stock Status Manufacture Item
Popular 144.3875 In stock Do not Start Manufacture
The spreadsheet developed is attached and it can be used by the staffs for
understanding whether the inventory needs new manufacturing or stop it.
Document Page
6
ITECH1100 UNDERSTANDING THE DIGITAL REVOLUTION
Bibliography
Ahmad, Z. I. B., Aloysius, D., Aziz, H., Som, M., Kasim, M., Gambaretto, A., ... & Biniwale,
S. (2016, October). Bringing Excellence in Asset Management through Streamlined
Automated Reporting & KPI Tracking System. In SPE Asia Pacific Oil & Gas
Conference and Exhibition. Society of Petroleum Engineers.
Atieh, A. M., Kaylani, H., Al-abdallat, Y., Qaderi, A., Ghoul, L., Jaradat, L., & Hdairis, I.
(2016). Performance improvement of inventory management system processes by an
automated warehouse management system. Procedia Cirp, 41, 568-572.
Wahab, M. F., Dasgupta, P. K., Kadjo, A. F., & Armstrong, D. W. (2016). Sampling
frequency, response times and embedded signal filtration in fast, high efficiency
liquid chromatography: A tutorial. Analytica chimica acta, 907, 31-44.
chevron_up_icon
1 out of 7
circle_padding
hide_on_mobile
zoom_out_icon
logo.png

Your All-in-One AI-Powered Toolkit for Academic Success.

Available 24*7 on WhatsApp / Email

[object Object]