ITECH1100 Assignment 1 - Jacket Revival: Automating Business Processes

Verified

Added on  2023/04/21

|8
|1190
|467
Homework Assignment
AI Summary
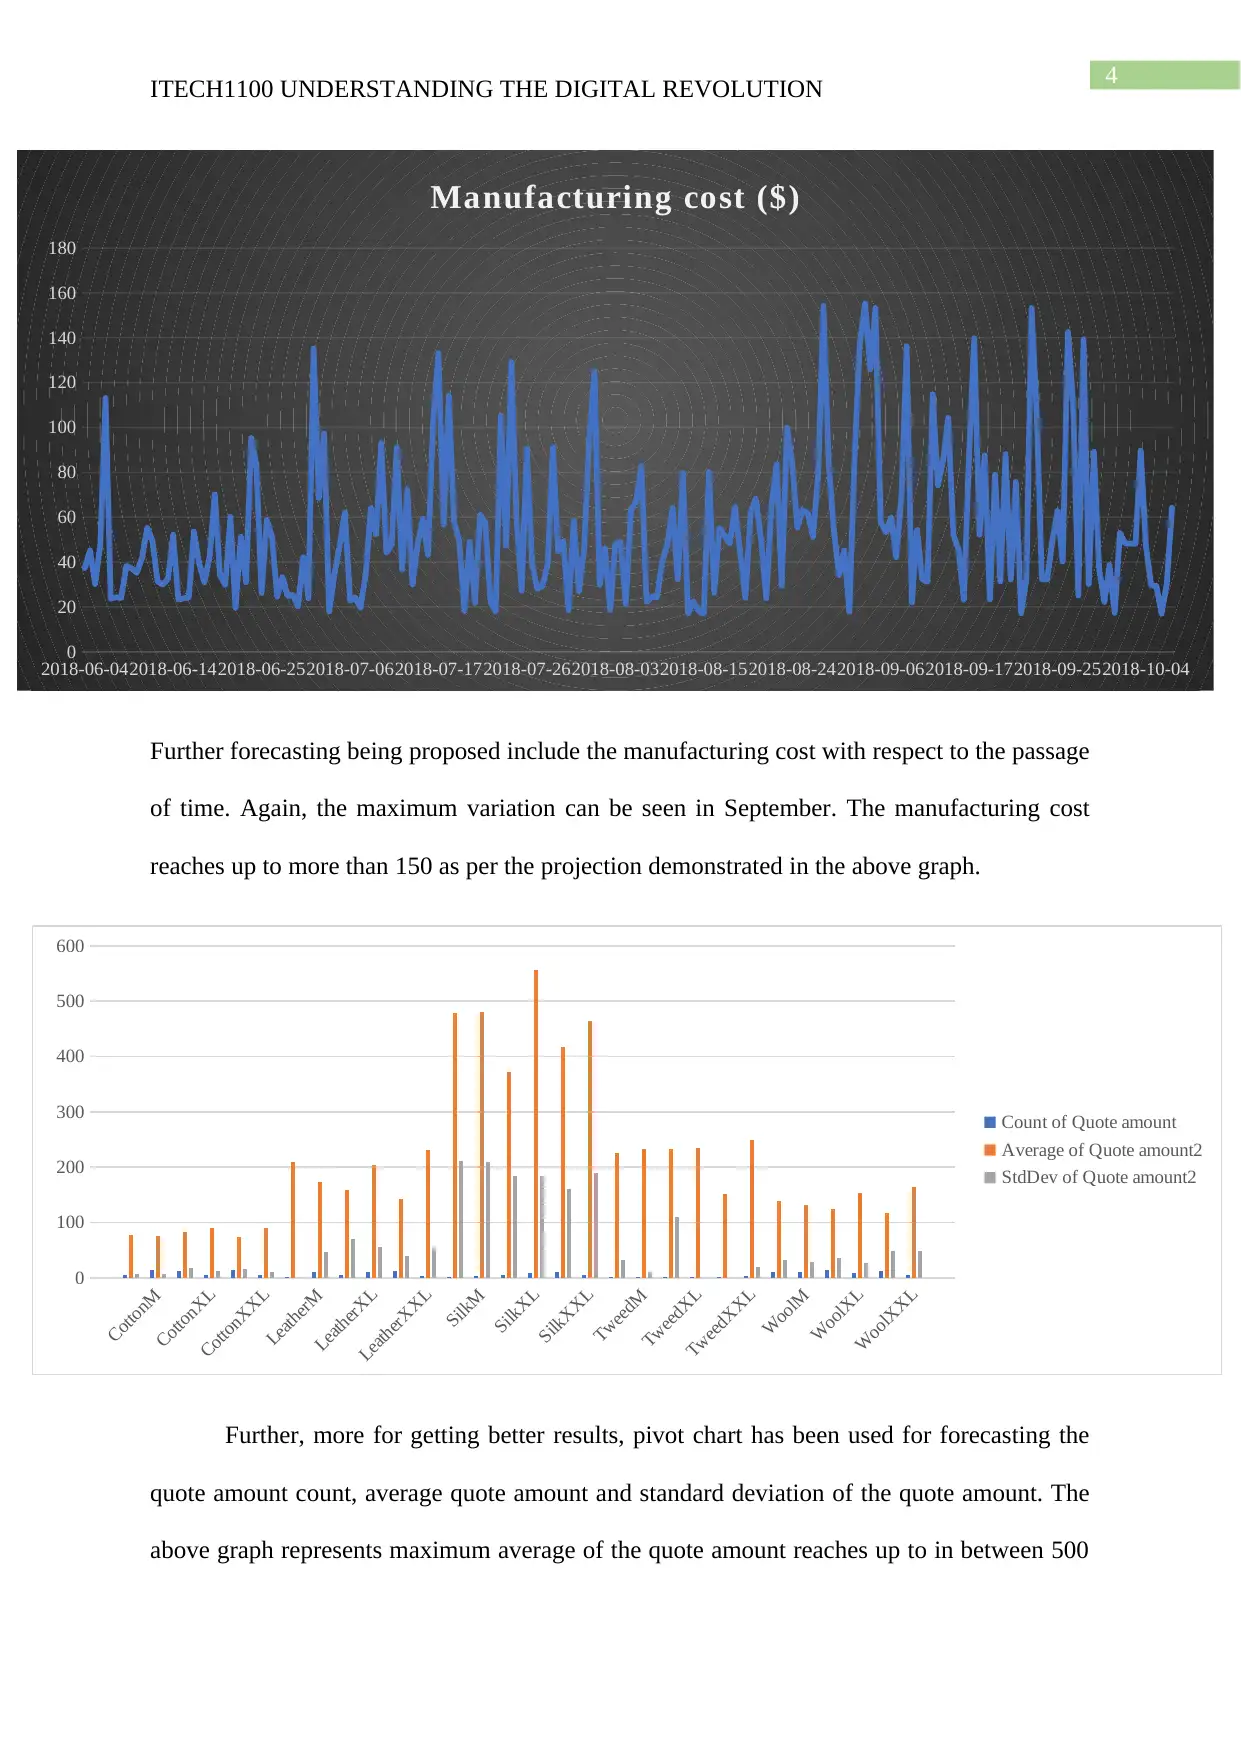
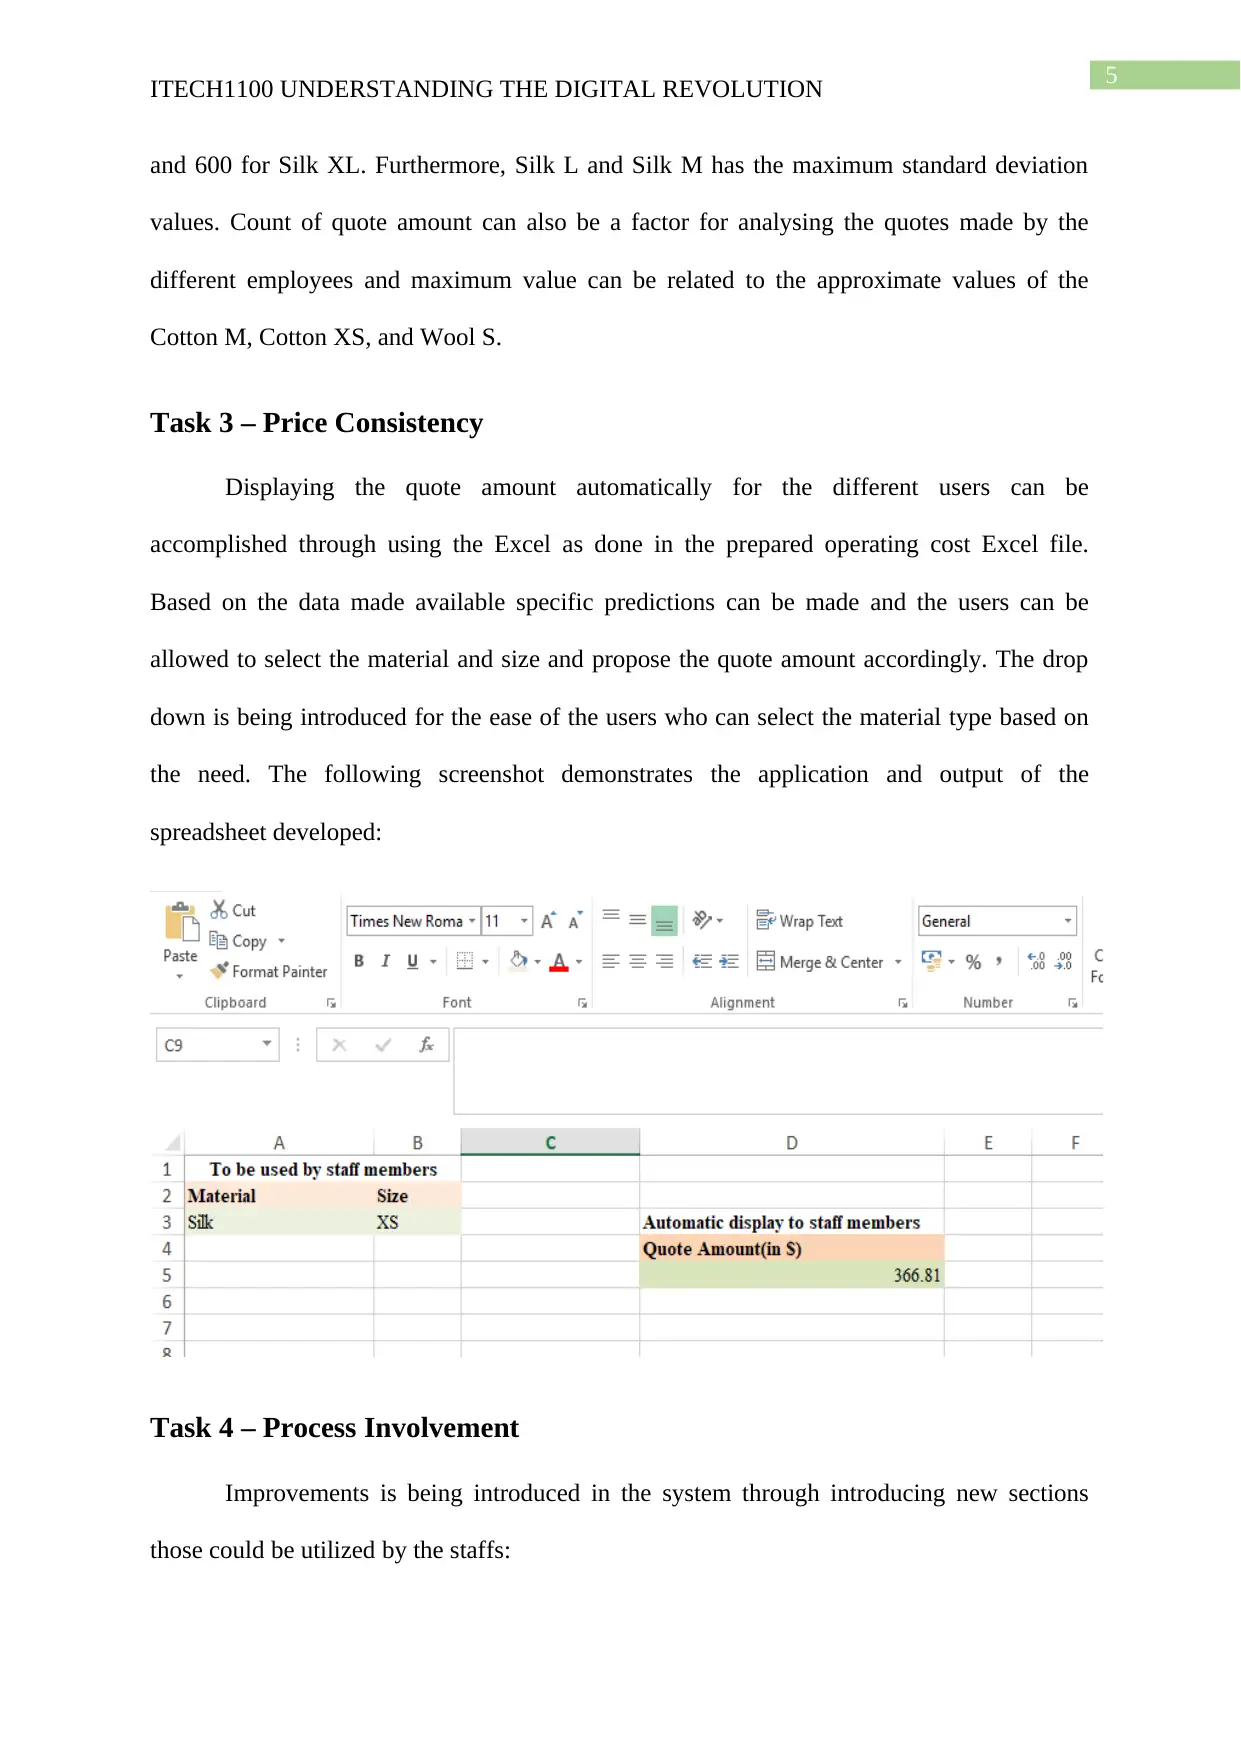
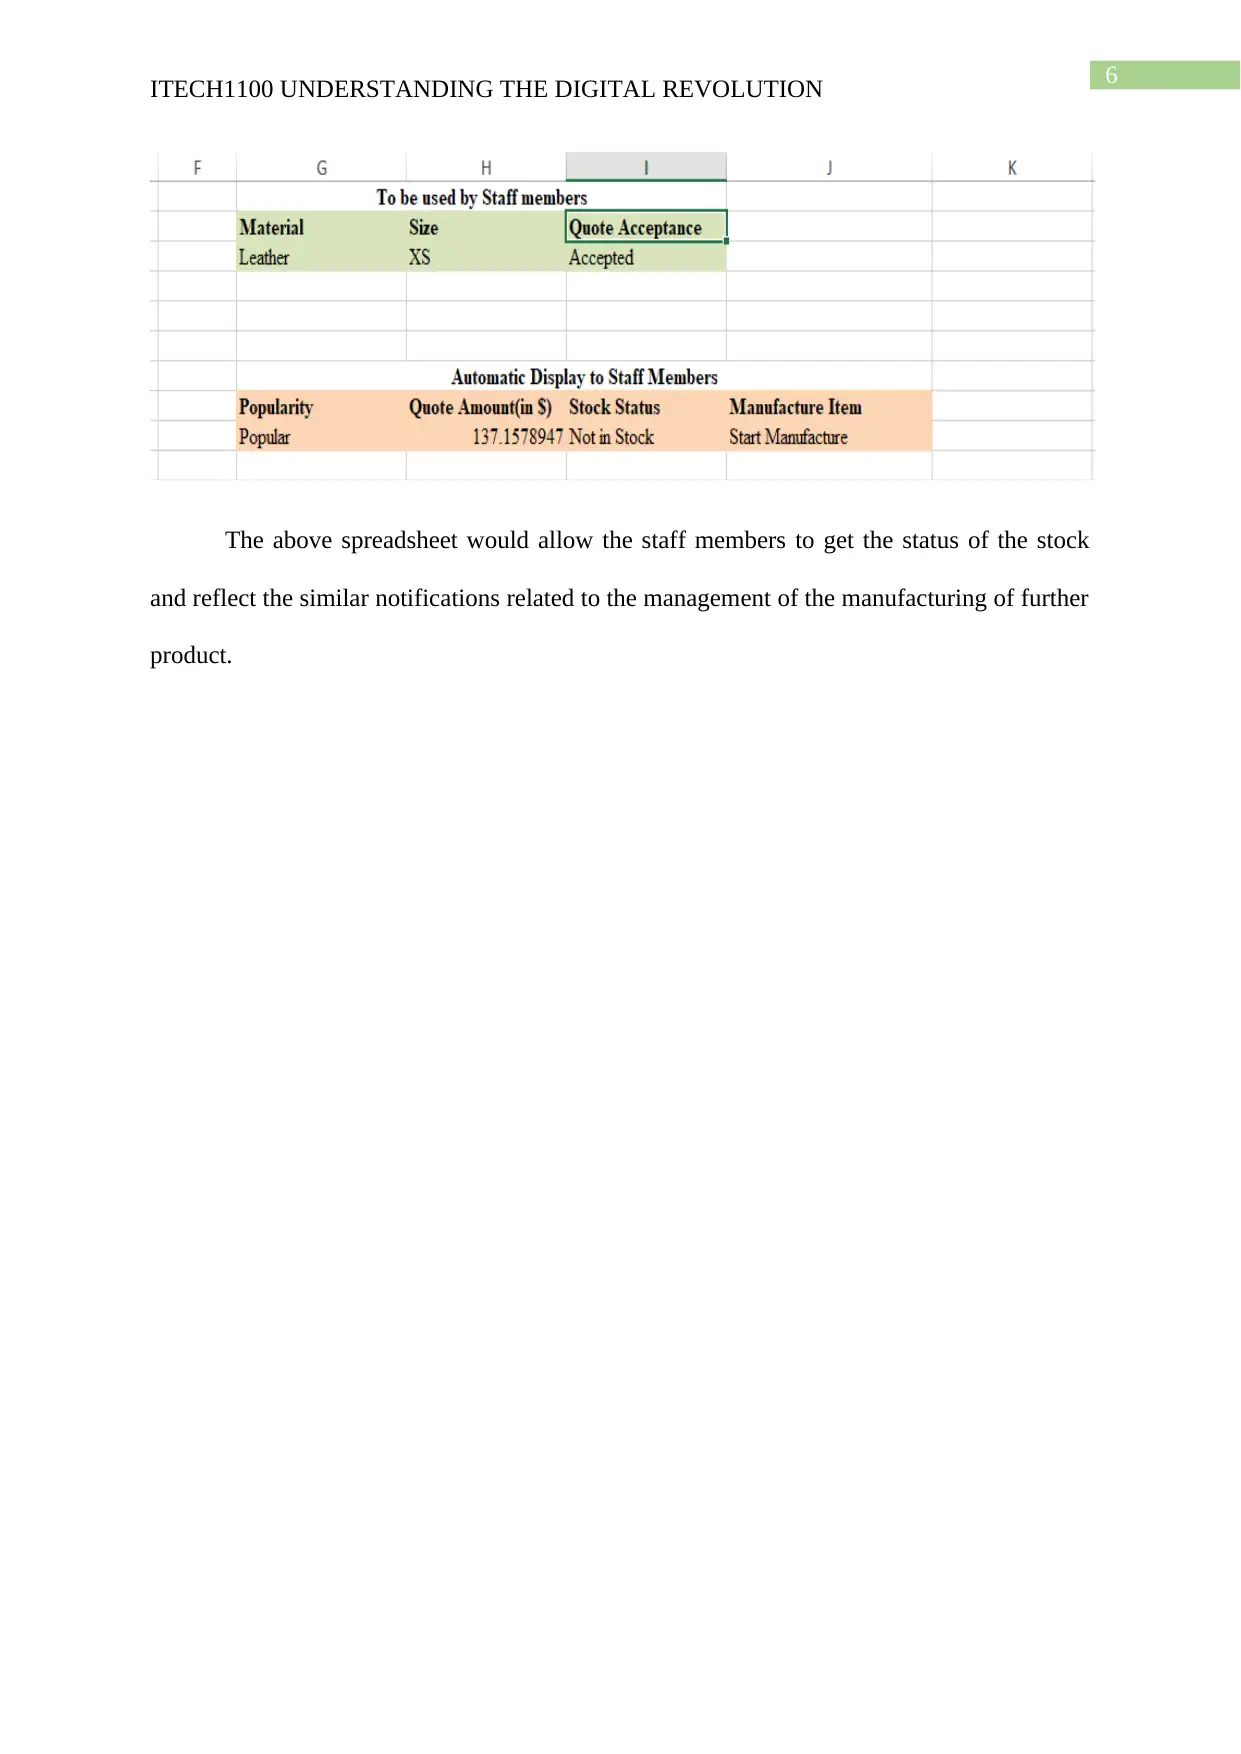
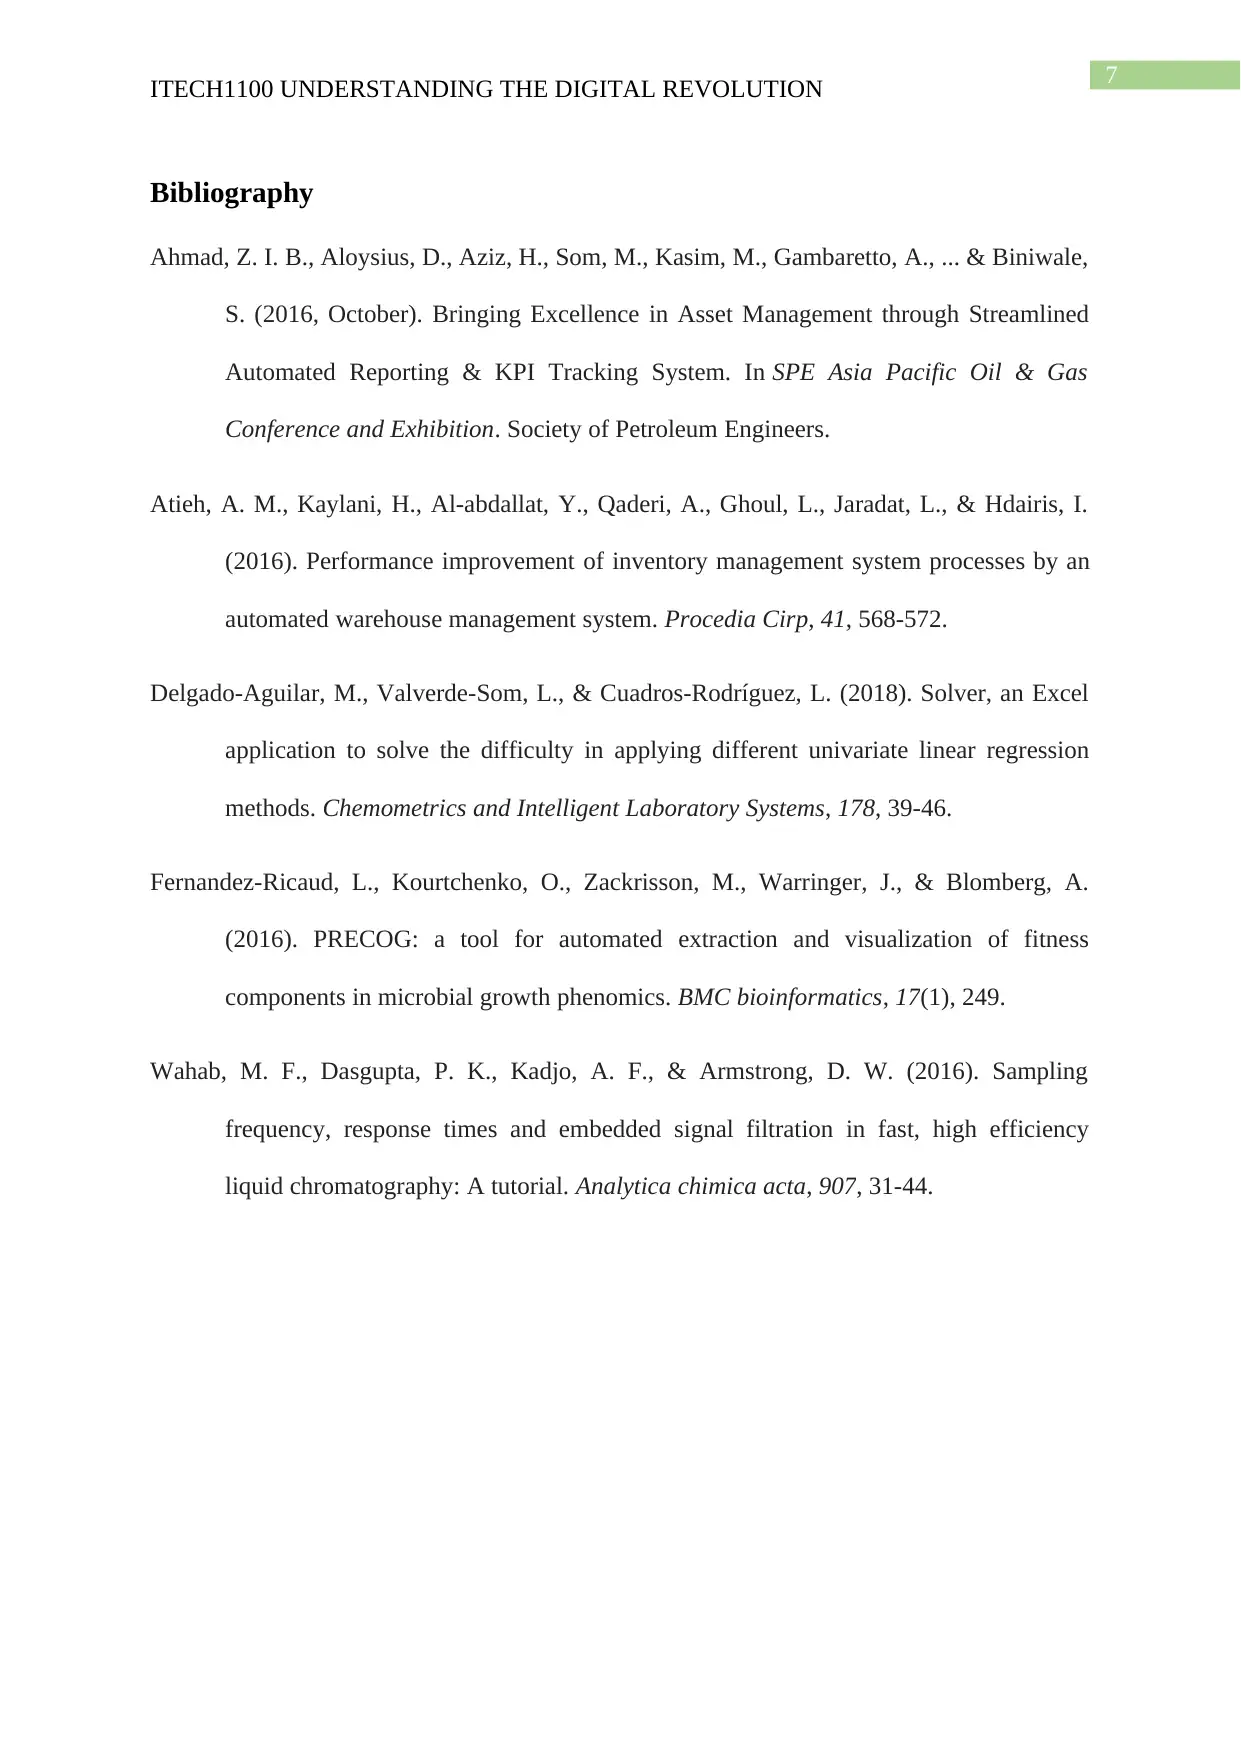
This assignment solution for ITECH1100, titled "Jacket Revival," utilizes Microsoft Excel to automate business processes and visualize data. The student analyzes the cost of operating a business, including employee costs, utility costs, and fixed expenses. Order information is presented graphically to track quote amounts and manufacturing costs over time, with pivot charts used for further data analysis. The solution addresses price consistency through the use of Excel formulas and drop-down menus. The assignment demonstrates how to automate processes, analyze business data, and visualize the impact of automation using Excel, including the use of spreadsheets for stock management and process improvements. The student's ePortfolio page details the work completed to fulfill the assignment requirements.
tabler-icon-diamond-filled.svg

Contribute Materials

Your contribution can guide someone’s learning journey. Share your documents today.
Document Page
Running head: ITECH1100 UNDERSTANDING THE DIGITAL REVOLUTION
ITECH1100 Understanding the Digital Revolution
Assignment 1 - Jacket Revival (30362822)
Name of the Student
Name of the University
Author’s Note
tabler-icon-diamond-filled.svg

Secure Best Marks with AI Grader

Need help grading? Try our AI Grader for instant feedback on your assignments.
Document Page
1
ITECH1100 UNDERSTANDING THE DIGITAL REVOLUTION
Table of Contents
Task 0 – Setting Up....................................................................................................................2
Task 1 – Cost of Operating the Business...................................................................................2
Task 2 – Order Information........................................................................................................3
Task 3 – Price Consistency........................................................................................................5
Task 4 – Process Involvement....................................................................................................5
Bibliography...............................................................................................................................7
Document Page
2
ITECH1100 UNDERSTANDING THE DIGITAL REVOLUTION
Task 0 – Setting Up
E Portfolio Page
Nam
e Working days
Working
hours(in week)
Additional Working
hours( in week)
Total working
hours in week
Arch
ie
Monday, Tuesday
and Wednesday 22.5 3 25.5
Barb
ara Thursday and Friday 15 0 15
Caro
l Every weekday 22.5 3 25.5
Task 1 – Cost of Operating the Business
Name
No. of Working
days in a week
Working
hours in a
week
Additional
working
hours in a
week
Total
working
hours in a
week
Hourly
rates(in
$)
Annual
cost(in
$)
Archie 3 22.5 3 25.5 26 34476
Barbara 2 15 0 15 26 20280
Carol 5 22.5 3 25.5 24 31824
Replacem
ent
employee 66 39 10296
Fixed
cost(in $) 9100
Utility
cost(in $) 3120
Total
Outgoing
cost (per
annum in
$) 109096
Simple excel formula is used for calculating the annual cost of the employees based
on the daily working hours spent for the operational activities. The overall cost calculated
using daily hours spent, times of the cost of the employee per hour; this resulted in the cost of
the employee for a single day that was further multiplied with the seven unit for the
calculation of employees’ cost for seven years. Thereafter, for the calculation of one-year
Document Page
3
ITECH1100 UNDERSTANDING THE DIGITAL REVOLUTION
cost, 52 multiply the calculated cost; and utility and fixed cost is added to the overall
calculated cost. This led to the final cost for all the three employees is $ 109096.
Task 2 – Order Information
2018-06-042018-06-142018-06-252018-07-062018-07-172018-07-262018-08-032018-08-152018-08-242018-09-062018-09-172018-09-252018-10-04
0
100
200
300
400
500
600
700
800
900
Quote amount
The above graph is the distribution of the quote of the amount made with the passage
of the time for analysing the aspect of the changes being identified over time. The graph
represents that there was one time growth in the quote during June and until July, there was
only once vast increment of the quote. Until September 2018, there is not any crowd of the
high quotes however; many bars can be seen in September 2018 that suggests that the quote
amount was higher near to 700.
tabler-icon-diamond-filled.svg

Secure Best Marks with AI Grader

Need help grading? Try our AI Grader for instant feedback on your assignments.
Document Page
4
ITECH1100 UNDERSTANDING THE DIGITAL REVOLUTION
2018-06-042018-06-142018-06-252018-07-062018-07-172018-07-262018-08-032018-08-152018-08-242018-09-062018-09-172018-09-252018-10-04
0
20
40
60
80
100
120
140
160
180
Manufacturing cost ($)
Further forecasting being proposed include the manufacturing cost with respect to the passage
of time. Again, the maximum variation can be seen in September. The manufacturing cost
reaches up to more than 150 as per the projection demonstrated in the above graph.
CottonM
CottonXL
CottonXXL
LeatherM
LeatherXL
LeatherXXL
SilkM
SilkXL
SilkXXL
TweedM
TweedXL
TweedXXL
WoolM
WoolXL
WoolXXL
0
100
200
300
400
500
600
Count of Quote amount
Average of Quote amount2
StdDev of Quote amount2
Further, more for getting better results, pivot chart has been used for forecasting the
quote amount count, average quote amount and standard deviation of the quote amount. The
above graph represents maximum average of the quote amount reaches up to in between 500
Document Page
5
ITECH1100 UNDERSTANDING THE DIGITAL REVOLUTION
and 600 for Silk XL. Furthermore, Silk L and Silk M has the maximum standard deviation
values. Count of quote amount can also be a factor for analysing the quotes made by the
different employees and maximum value can be related to the approximate values of the
Cotton M, Cotton XS, and Wool S.
Task 3 – Price Consistency
Displaying the quote amount automatically for the different users can be
accomplished through using the Excel as done in the prepared operating cost Excel file.
Based on the data made available specific predictions can be made and the users can be
allowed to select the material and size and propose the quote amount accordingly. The drop
down is being introduced for the ease of the users who can select the material type based on
the need. The following screenshot demonstrates the application and output of the
spreadsheet developed:
Task 4 – Process Involvement
Improvements is being introduced in the system through introducing new sections
those could be utilized by the staffs:
Document Page
6
ITECH1100 UNDERSTANDING THE DIGITAL REVOLUTION
The above spreadsheet would allow the staff members to get the status of the stock
and reflect the similar notifications related to the management of the manufacturing of further
product.
tabler-icon-diamond-filled.svg

Paraphrase This Document

Need a fresh take? Get an instant paraphrase of this document with our AI Paraphraser
Document Page
7
ITECH1100 UNDERSTANDING THE DIGITAL REVOLUTION
Bibliography
Ahmad, Z. I. B., Aloysius, D., Aziz, H., Som, M., Kasim, M., Gambaretto, A., ... & Biniwale,
S. (2016, October). Bringing Excellence in Asset Management through Streamlined
Automated Reporting & KPI Tracking System. In SPE Asia Pacific Oil & Gas
Conference and Exhibition. Society of Petroleum Engineers.
Atieh, A. M., Kaylani, H., Al-abdallat, Y., Qaderi, A., Ghoul, L., Jaradat, L., & Hdairis, I.
(2016). Performance improvement of inventory management system processes by an
automated warehouse management system. Procedia Cirp, 41, 568-572.
Delgado-Aguilar, M., Valverde-Som, L., & Cuadros-Rodríguez, L. (2018). Solver, an Excel
application to solve the difficulty in applying different univariate linear regression
methods. Chemometrics and Intelligent Laboratory Systems, 178, 39-46.
Fernandez-Ricaud, L., Kourtchenko, O., Zackrisson, M., Warringer, J., & Blomberg, A.
(2016). PRECOG: a tool for automated extraction and visualization of fitness
components in microbial growth phenomics. BMC bioinformatics, 17(1), 249.
Wahab, M. F., Dasgupta, P. K., Kadjo, A. F., & Armstrong, D. W. (2016). Sampling
frequency, response times and embedded signal filtration in fast, high efficiency
liquid chromatography: A tutorial. Analytica chimica acta, 907, 31-44.
chevron_up_icon
1 out of 8
circle_padding
hide_on_mobile
zoom_out_icon
logo.png

Your All-in-One AI-Powered Toolkit for Academic Success.

Available 24*7 on WhatsApp / Email

[object Object]