ITECH1100 Assignment 1: Garment Oasis - Excel Solution Analysis

Verified

Added on  2023/01/16

|7
|987
|69
Homework Assignment
AI Summary
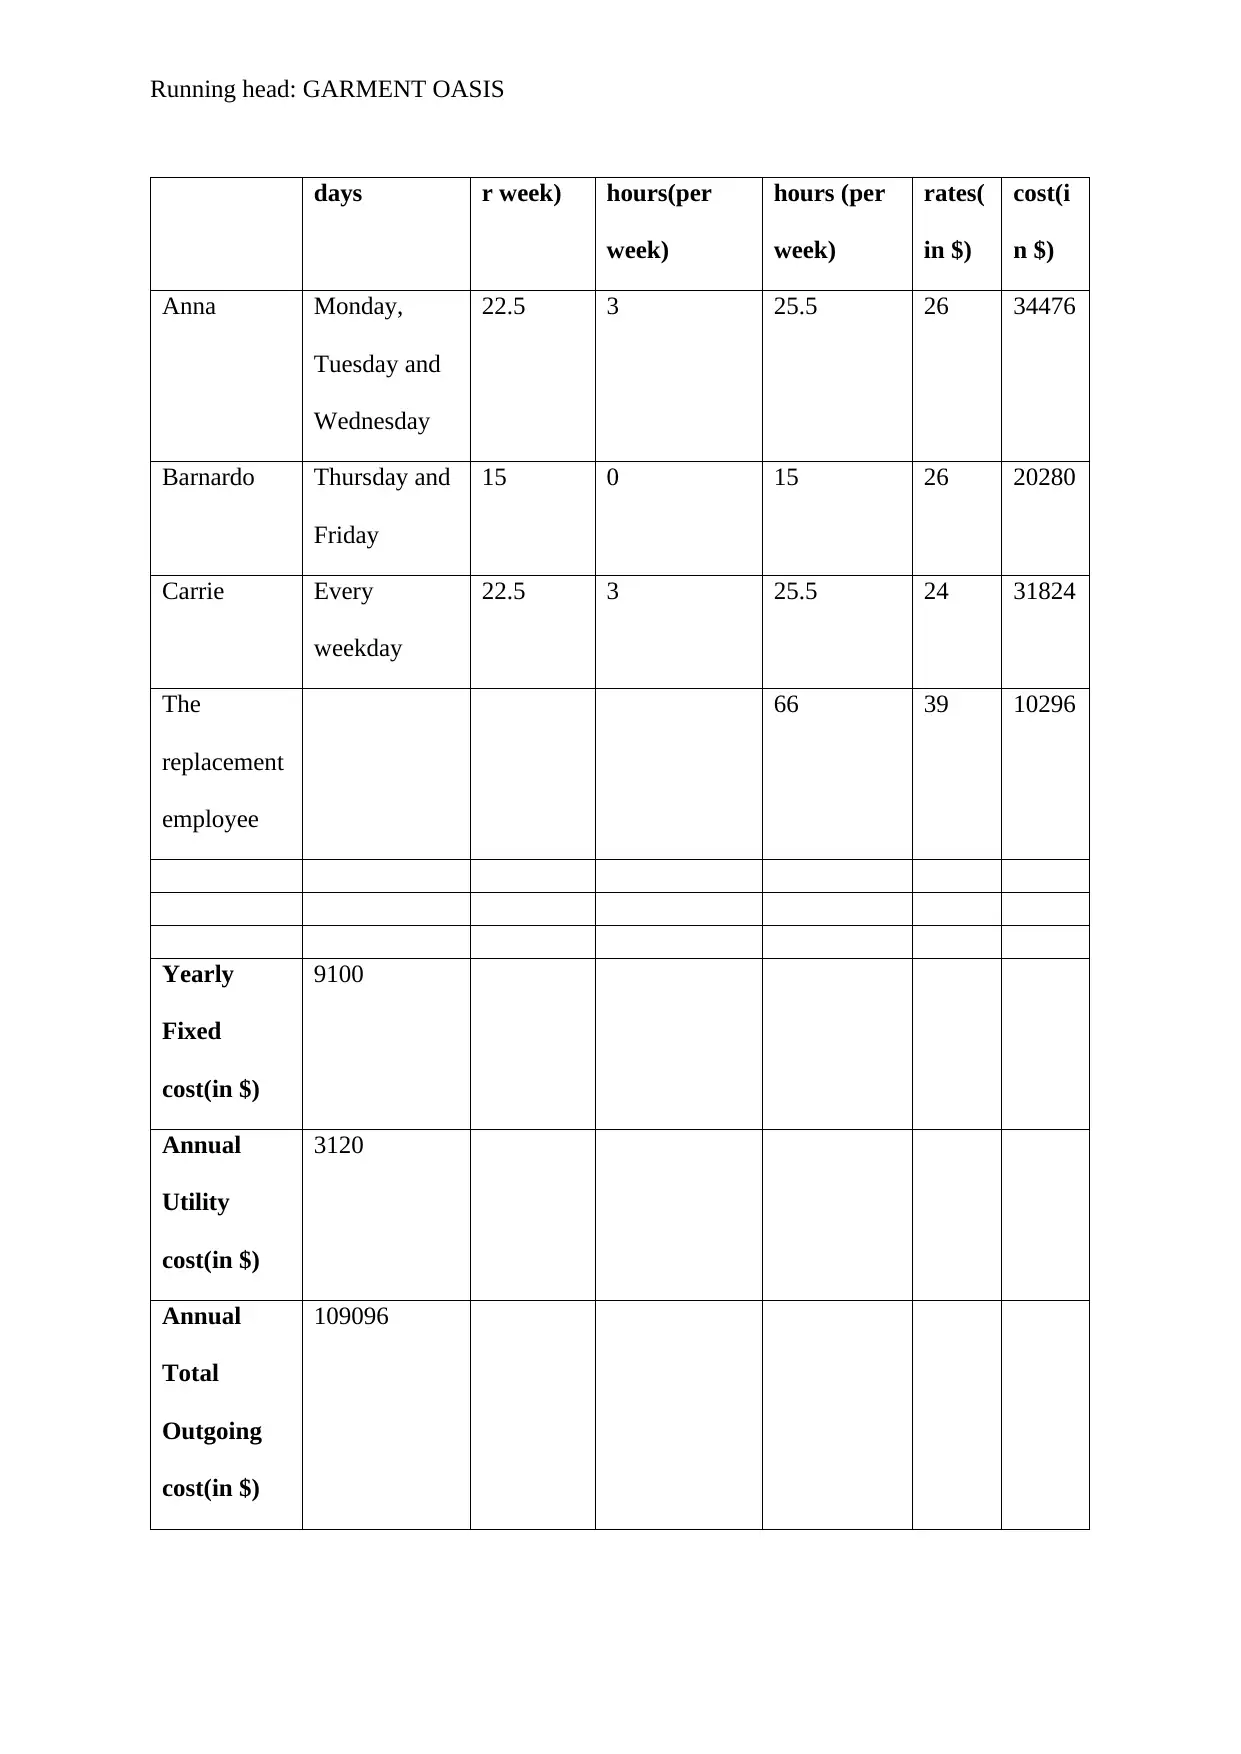
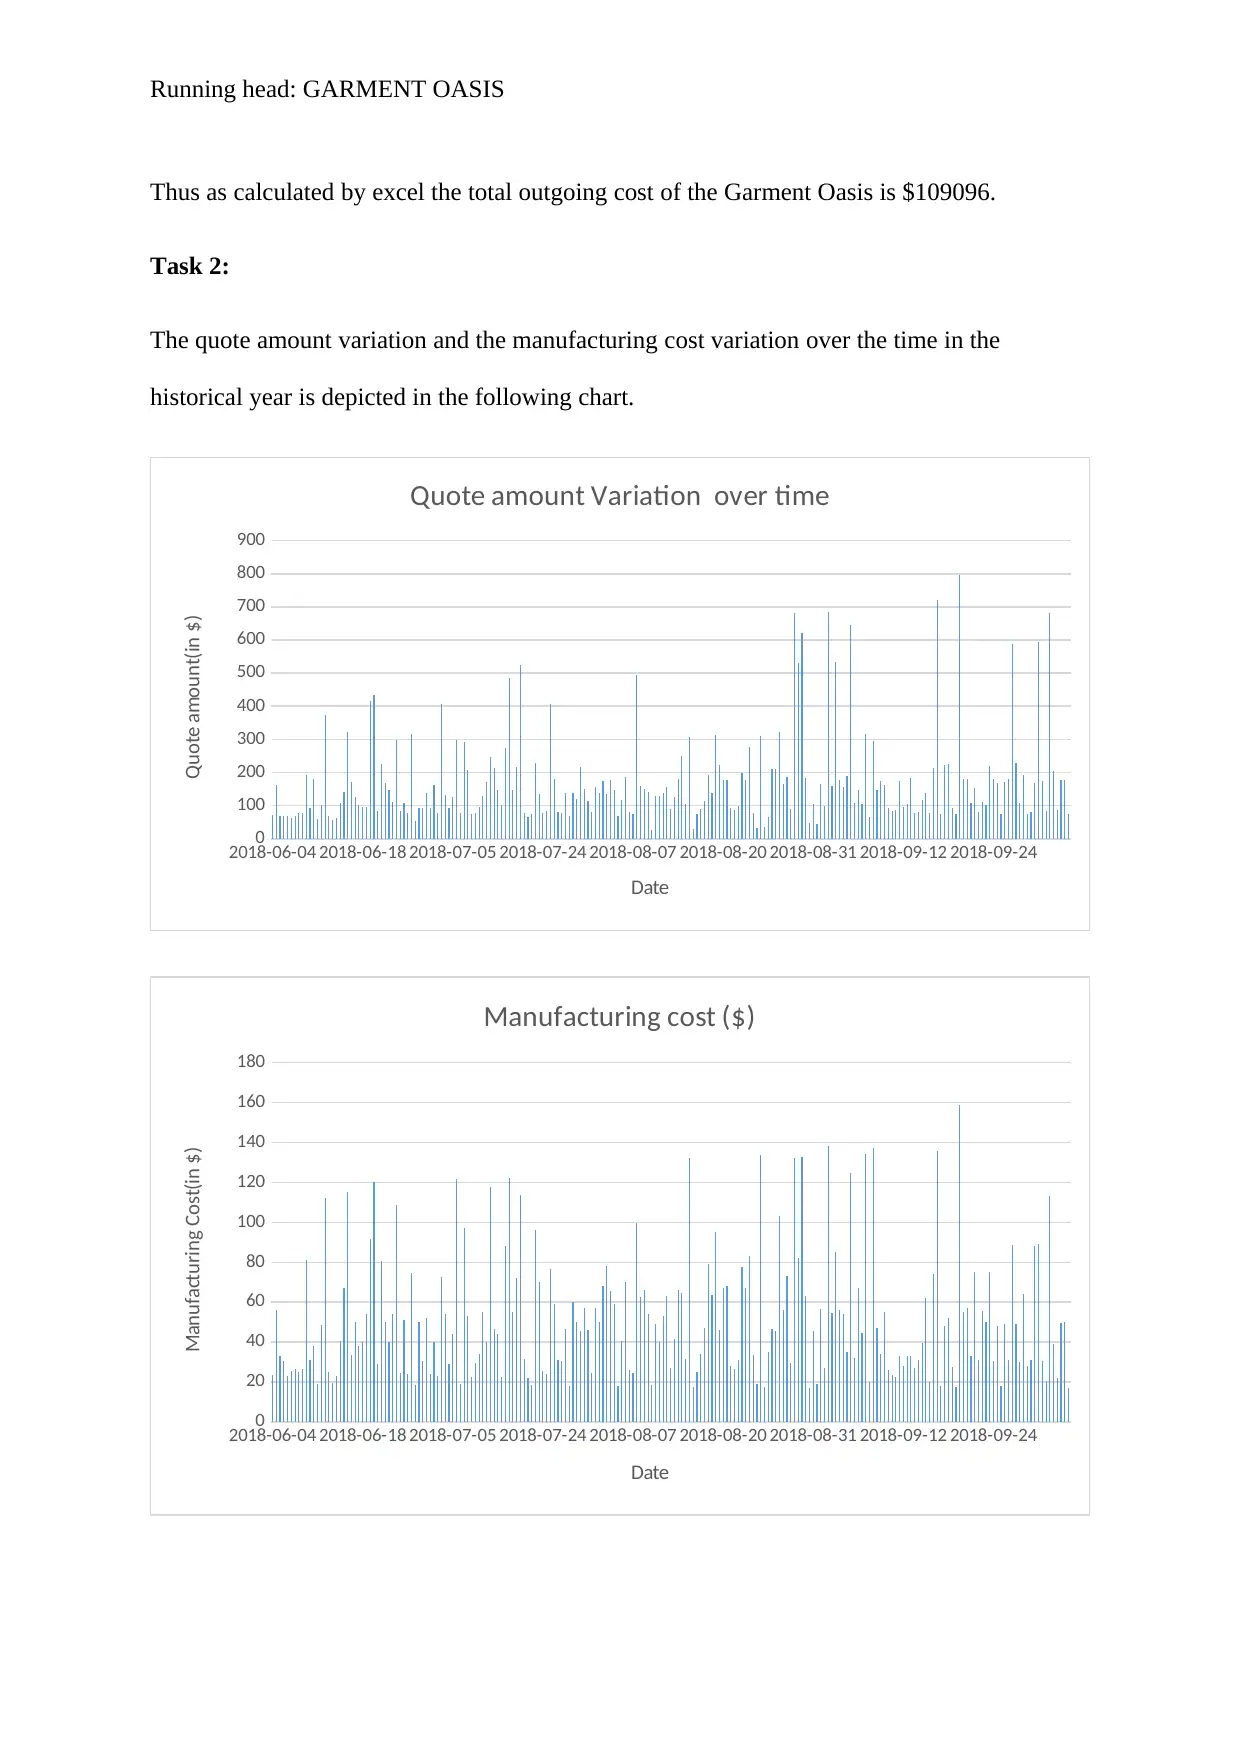
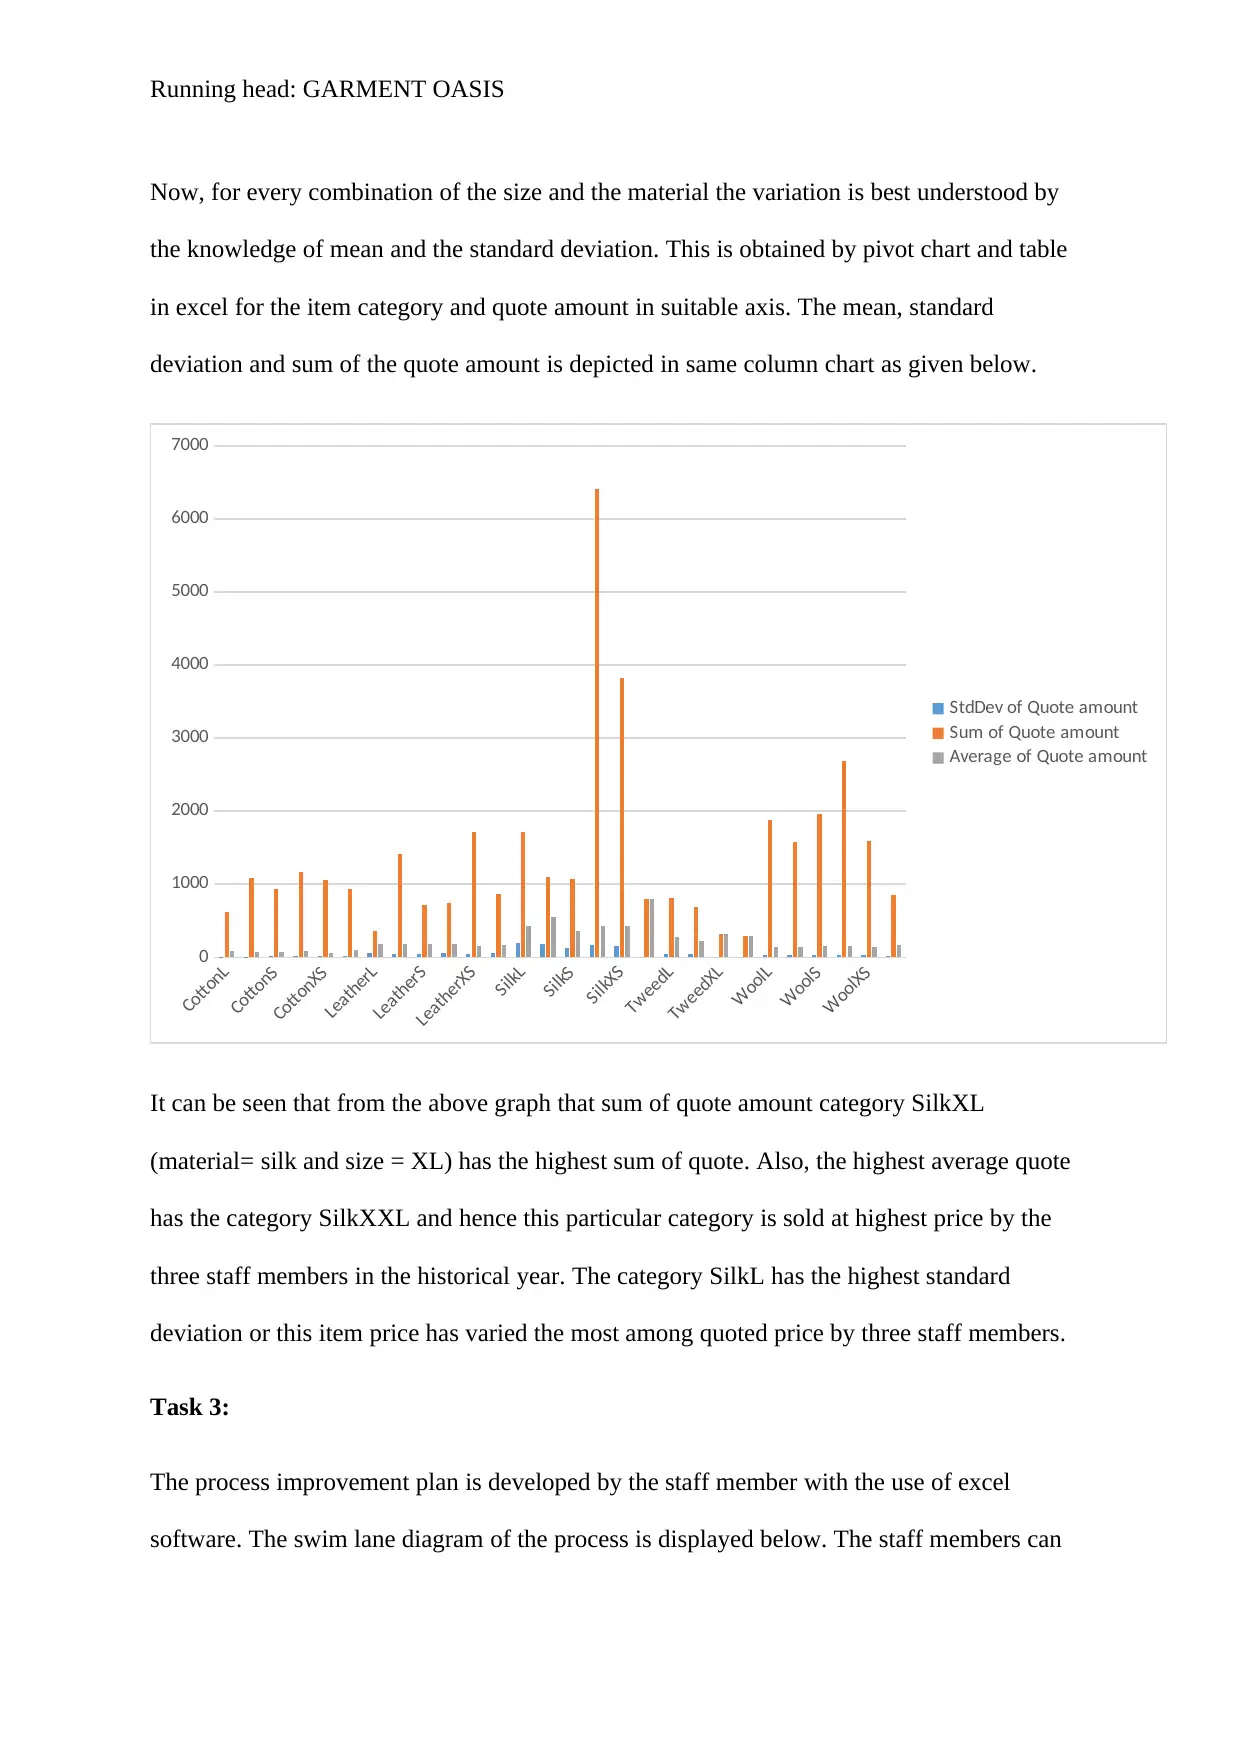
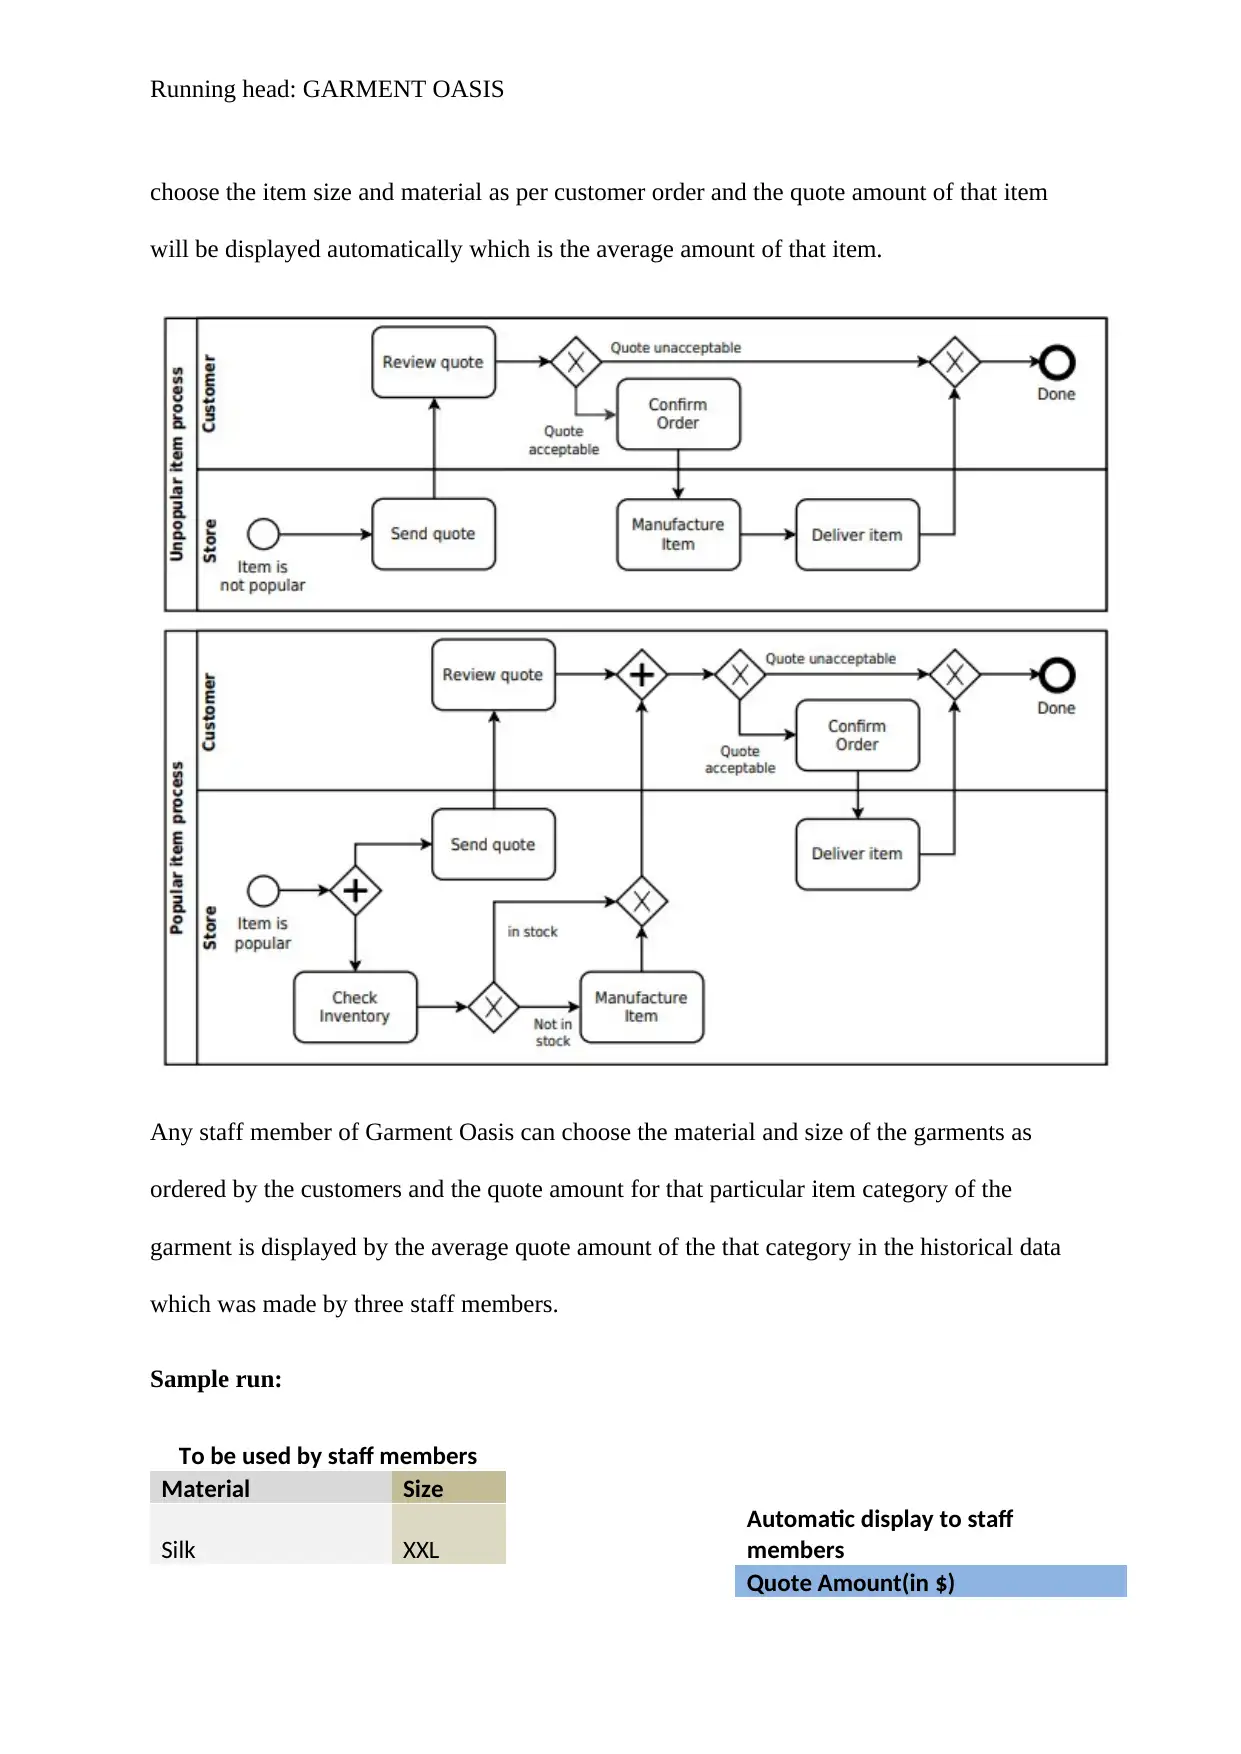
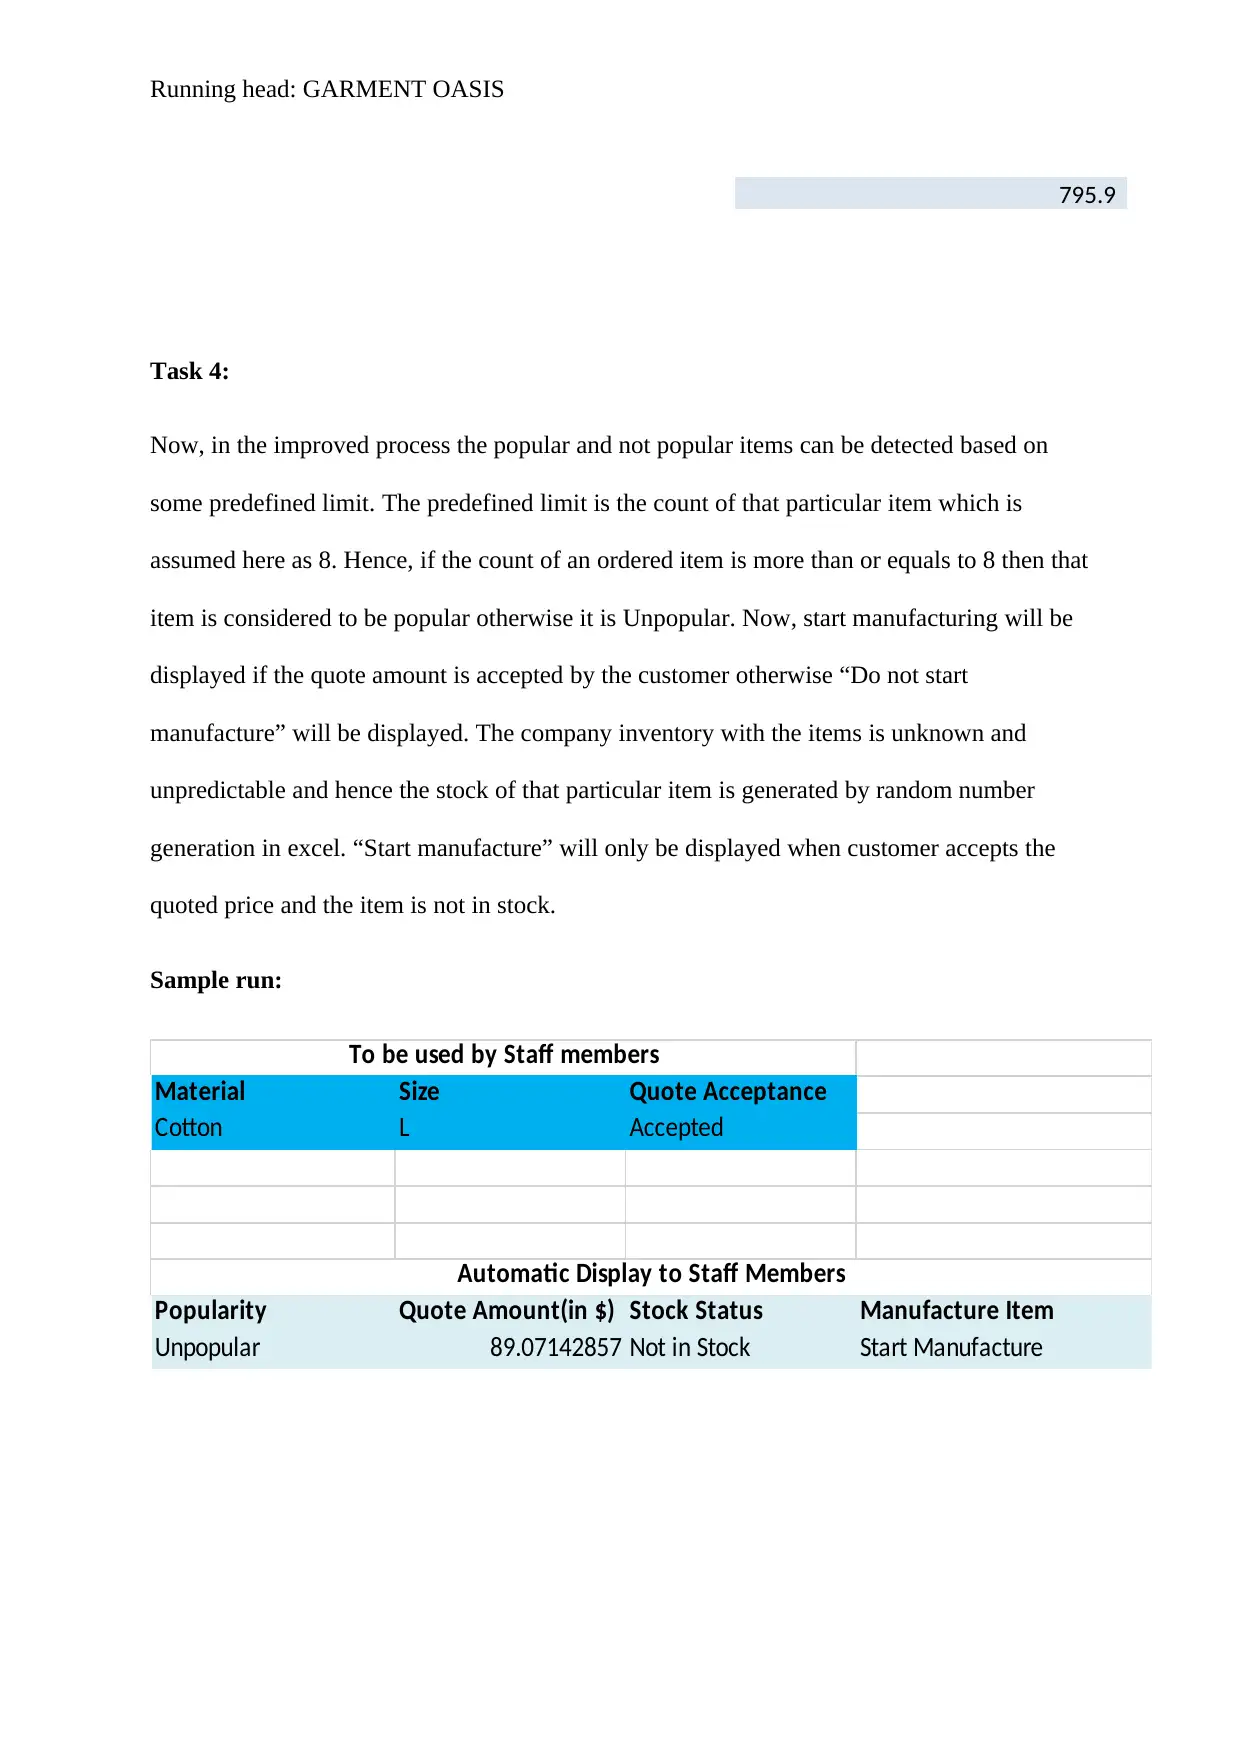
This assignment focuses on creating an Excel-based solution for Garment Oasis, a small clothing manufacturer. The solution addresses various aspects of the business, including cost analysis, quote amount and manufacturing cost variations, and process improvement. Task 1 calculates the total outgoing cost, including employee salaries, fixed costs, and utility expenses. Task 2 analyzes quote amount and manufacturing cost variations over time using charts and pivot tables. The analysis includes calculating mean, standard deviation, and sum of quote amounts for different item categories. Task 3 develops a process improvement plan using a swim lane diagram, allowing staff members to select item sizes and materials, with quote amounts displayed automatically. Task 4 introduces a system to identify popular and unpopular items based on order counts and determines whether to start manufacturing based on customer quote acceptance and stock availability. The assignment demonstrates the application of Excel for data analysis, process automation, and decision-making in a business context.
tabler-icon-diamond-filled.svg

Contribute Materials

Your contribution can guide someone’s learning journey. Share your documents today.
Document Page
Running head: GARMENT OASIS
GARMENT OASIS
Name of the Student
Name of the University
Author Note
tabler-icon-diamond-filled.svg

Secure Best Marks with AI Grader

Need help grading? Try our AI Grader for instant feedback on your assignments.
Document Page
Running head: GARMENT OASIS
Task 0:
This assignment deals with producing solutions for garment oasis by using the excel
software. In garment Oasis which is a small clothing manufacturer company that produces
one of a kind garment sells the manufactured product through a particular online store. The
three staff members of the company are Anna, Barnardo and Carrie. Anna has the task of
manufacturing garments and Barnardo also does the same. Where Clyde manages the sales,
orders and delivery. The typical working hours of the persons are shown in the following
table.
Name Working days in the week Working hours(on
weekly basis)
Additional Working
hours(in week)
Anna Monday, Tuesday and
Wednesday
22.5 3
Barnard
o
Thursday and Friday 15 0
Carrie Every weekday 22.5 3
Task 1:
The operation cost is calculated in excel and then the total outgoing cost is obtained as given
below. The total outgoing cost is the sum of the annual cost of all the employees, yearly fixed
cost and annual utility cost.
Name Specific
Working
Working
hours(pe
Additional
Working
Total
Working
Hourl
y
Annu
al
Document Page
Running head: GARMENT OASIS
days r week) hours(per
week)
hours (per
week)
rates(
in $)
cost(i
n $)
Anna Monday,
Tuesday and
Wednesday
22.5 3 25.5 26 34476
Barnardo Thursday and
Friday
15 0 15 26 20280
Carrie Every
weekday
22.5 3 25.5 24 31824
The
replacement
employee
66 39 10296
Yearly
Fixed
cost(in $)
9100
Annual
Utility
cost(in $)
3120
Annual
Total
Outgoing
cost(in $)
109096
Document Page
Running head: GARMENT OASIS
Thus as calculated by excel the total outgoing cost of the Garment Oasis is $109096.
Task 2:
The quote amount variation and the manufacturing cost variation over the time in the
historical year is depicted in the following chart.
2018-06-04 2018-06-18 2018-07-05 2018-07-24 2018-08-07 2018-08-20 2018-08-31 2018-09-12 2018-09-24
0
100
200
300
400
500
600
700
800
900
Quote amount Variation over time
Date
Quote amount(in $)
2018-06-04 2018-06-18 2018-07-05 2018-07-24 2018-08-07 2018-08-20 2018-08-31 2018-09-12 2018-09-24
0
20
40
60
80
100
120
140
160
180
Manufacturing cost ($)
Date
Manufacturing Cost(in $)
tabler-icon-diamond-filled.svg

Secure Best Marks with AI Grader

Need help grading? Try our AI Grader for instant feedback on your assignments.
Document Page
Running head: GARMENT OASIS
Now, for every combination of the size and the material the variation is best understood by
the knowledge of mean and the standard deviation. This is obtained by pivot chart and table
in excel for the item category and quote amount in suitable axis. The mean, standard
deviation and sum of the quote amount is depicted in same column chart as given below.
CottonL
CottonS
CottonXS
LeatherL
LeatherS
LeatherXS
SilkL
SilkS
SilkXS
TweedL
TweedXL
WoolL
WoolS
WoolXS
0
1000
2000
3000
4000
5000
6000
7000
StdDev of Quote amount
Sum of Quote amount
Average of Quote amount
It can be seen that from the above graph that sum of quote amount category SilkXL
(material= silk and size = XL) has the highest sum of quote. Also, the highest average quote
has the category SilkXXL and hence this particular category is sold at highest price by the
three staff members in the historical year. The category SilkL has the highest standard
deviation or this item price has varied the most among quoted price by three staff members.
Task 3:
The process improvement plan is developed by the staff member with the use of excel
software. The swim lane diagram of the process is displayed below. The staff members can
Document Page
Running head: GARMENT OASIS
choose the item size and material as per customer order and the quote amount of that item
will be displayed automatically which is the average amount of that item.
Any staff member of Garment Oasis can choose the material and size of the garments as
ordered by the customers and the quote amount for that particular item category of the
garment is displayed by the average quote amount of the that category in the historical data
which was made by three staff members.
Sample run:
To be used by staff members
Material Size
Silk XXL
Automatic display to staff
members
Quote Amount(in $)
Document Page
Running head: GARMENT OASIS
795.9
Task 4:
Now, in the improved process the popular and not popular items can be detected based on
some predefined limit. The predefined limit is the count of that particular item which is
assumed here as 8. Hence, if the count of an ordered item is more than or equals to 8 then that
item is considered to be popular otherwise it is Unpopular. Now, start manufacturing will be
displayed if the quote amount is accepted by the customer otherwise “Do not start
manufacture” will be displayed. The company inventory with the items is unknown and
unpredictable and hence the stock of that particular item is generated by random number
generation in excel. “Start manufacture” will only be displayed when customer accepts the
quoted price and the item is not in stock.
Sample run:
Material Size Quote Acceptance
Cotton L Accepted
Popularity Quote Amount(in $) Stock Status Manufacture Item
Unpopular 89.07142857 Not in Stock Start Manufacture
To be used by Staff members
Automatic Display to Staff Members
chevron_up_icon
1 out of 7
circle_padding
hide_on_mobile
zoom_out_icon
logo.png

Your All-in-One AI-Powered Toolkit for Academic Success.

Available 24*7 on WhatsApp / Email

[object Object]