Data Analysis and Automation for Sock Spike Business (ITECH1100)

Verified

Added on  2023/01/20

|8
|996
|80
Homework Assignment
AI Summary
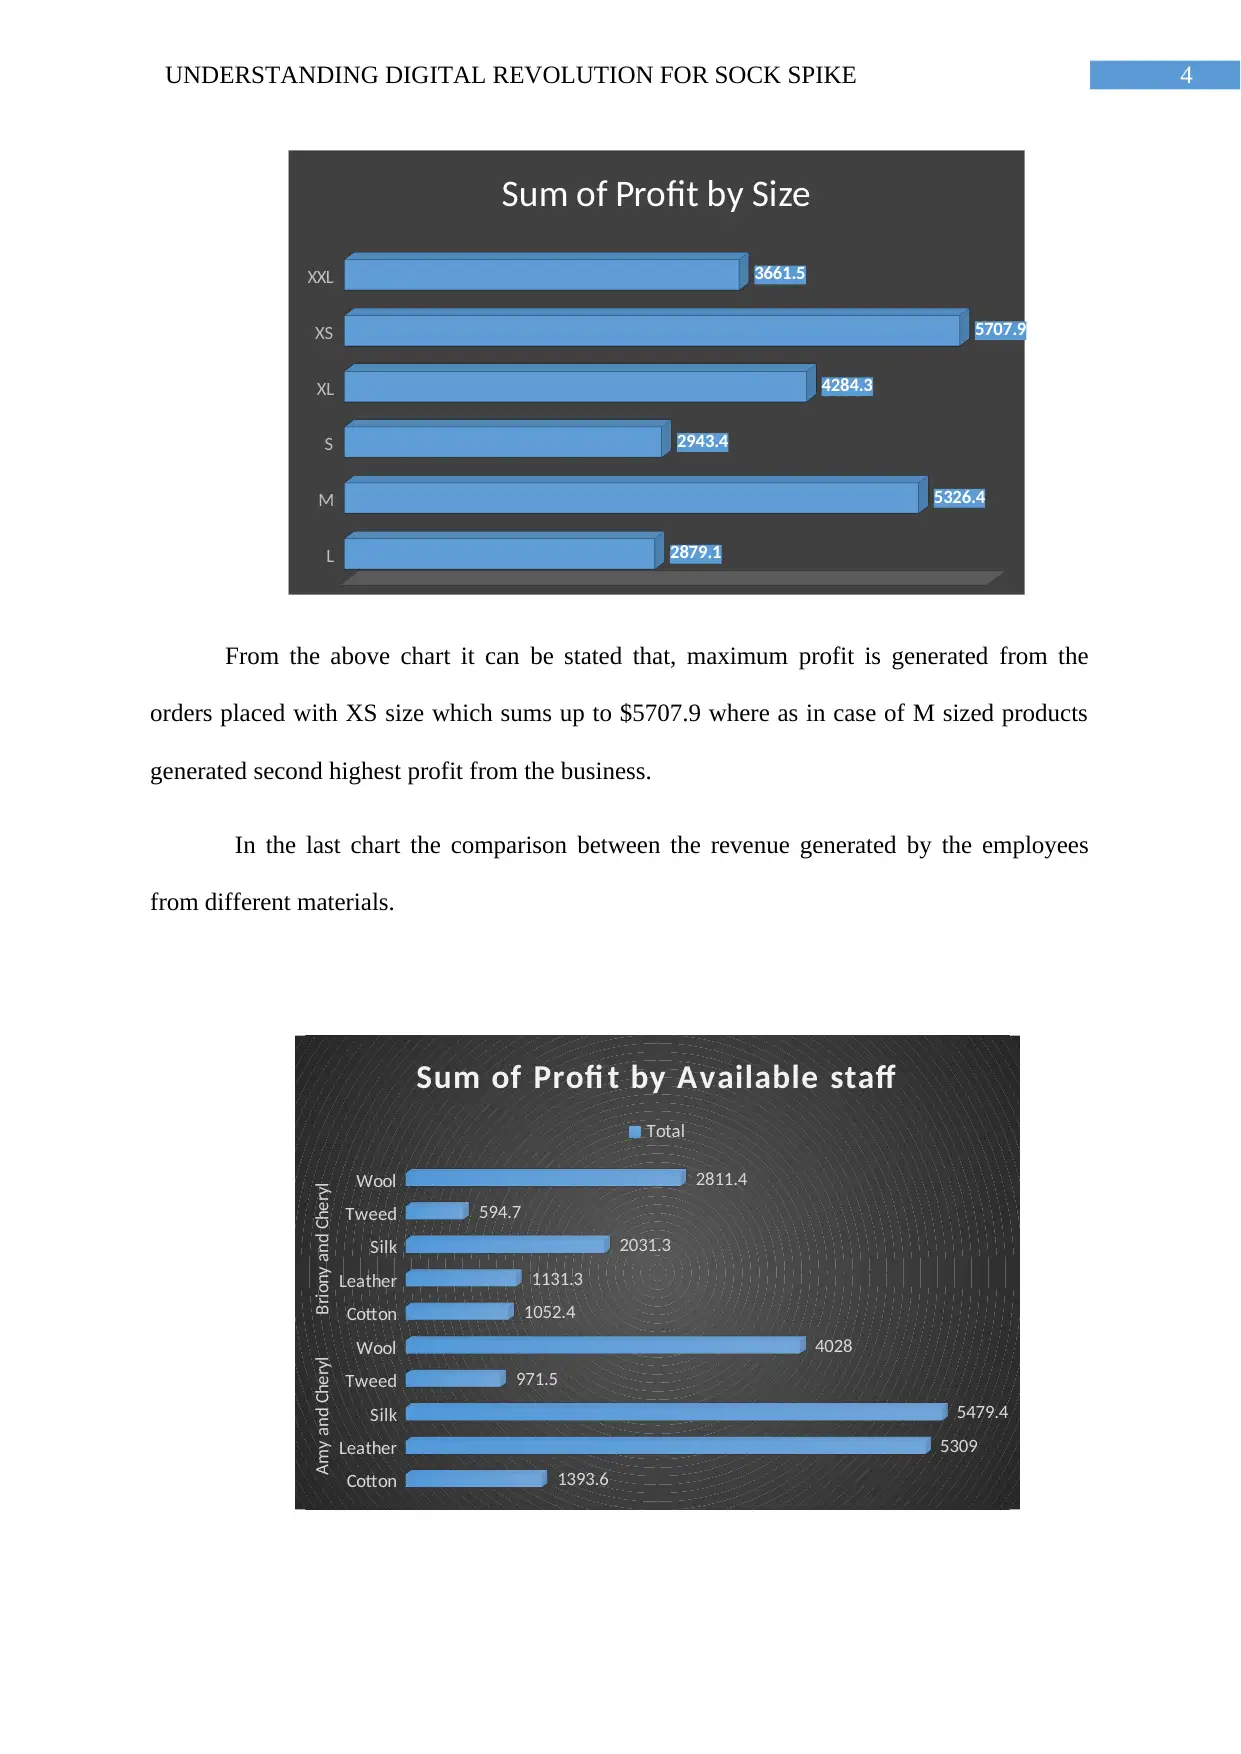
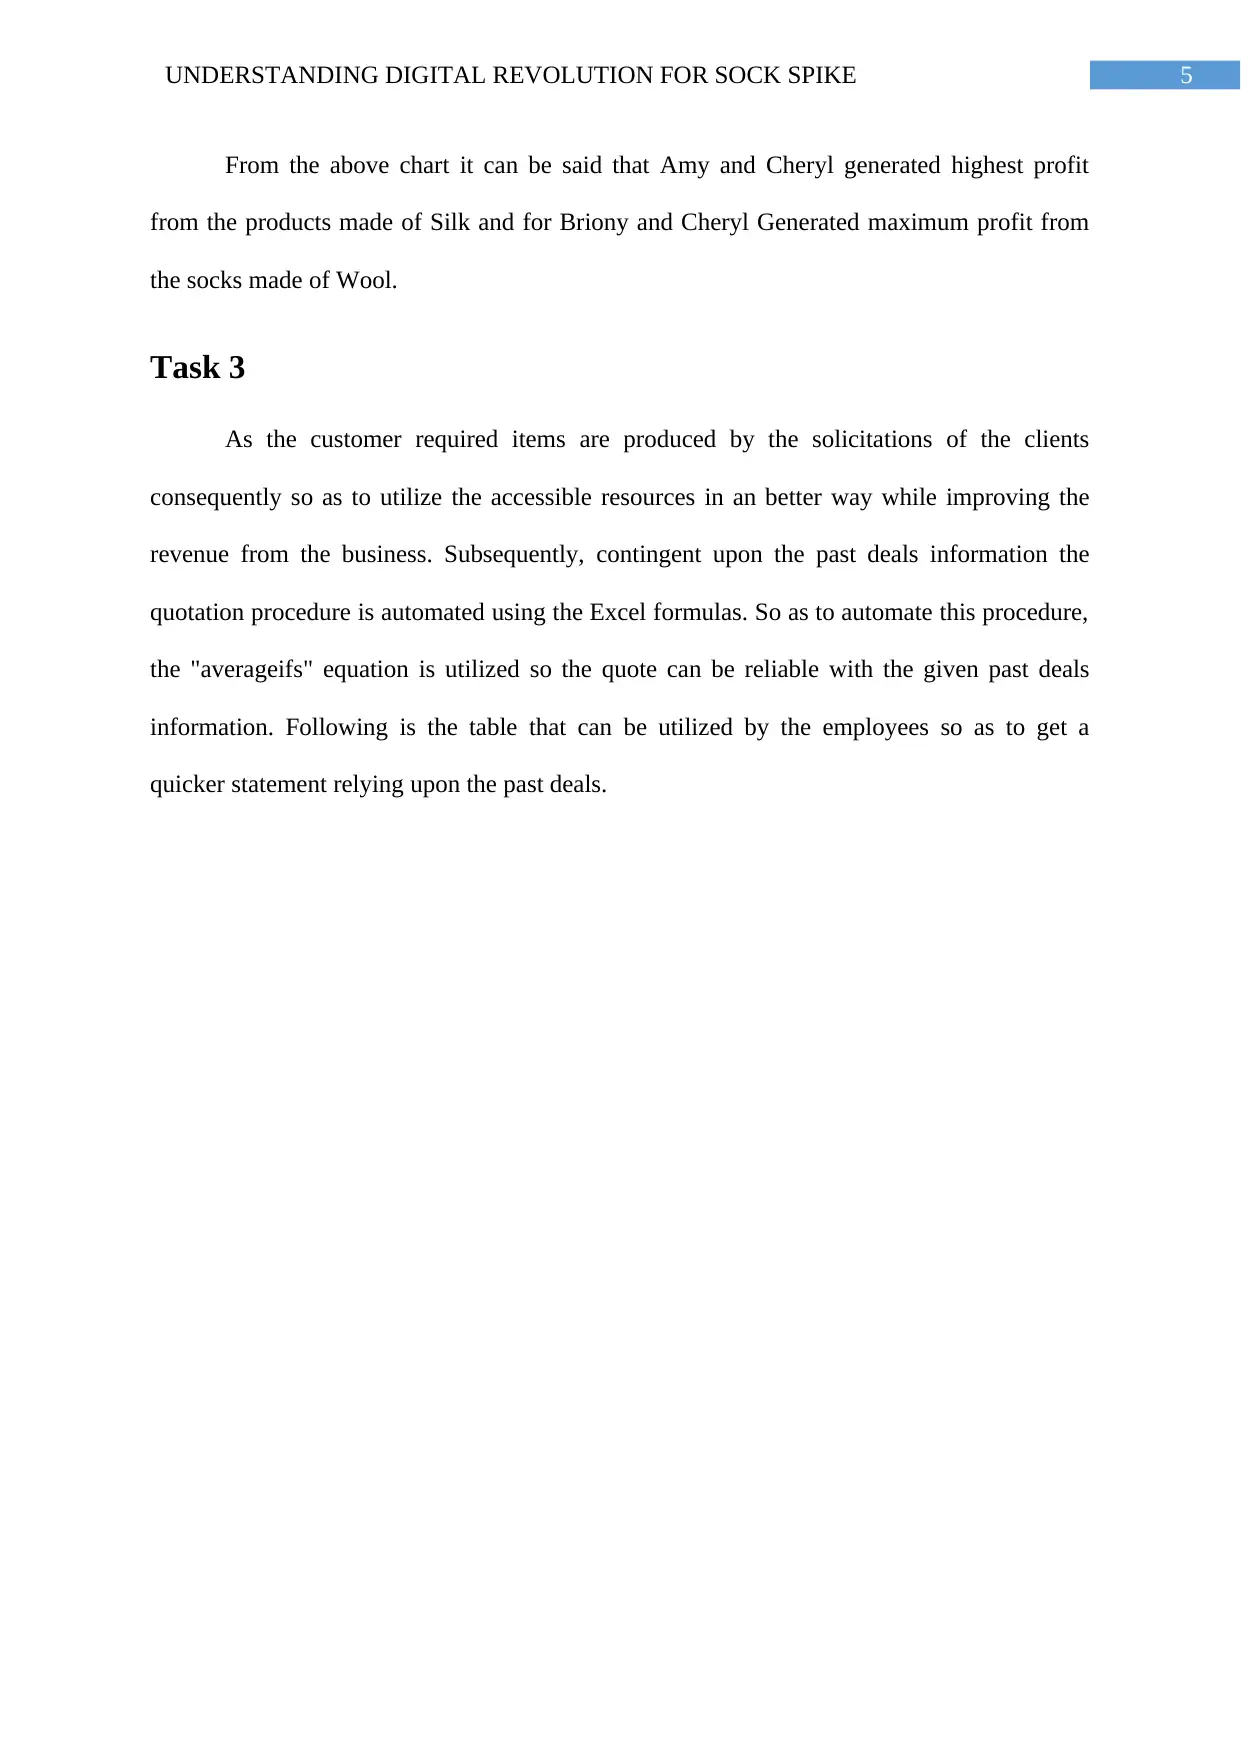
This assignment analyzes the business operations of Sock Spike, a company that manufactures socks. The analysis begins with calculating the total operational costs, including employee salaries, insurance, and utilities. The assignment then delves into sales data, generating charts to visualize the count of quotes in different price ranges, manufacturing costs by size, profit by size, and revenue generated by employees based on material type. Excel formulas are used to automate the quoting process, enabling employees to quickly provide quotes based on past sales data. Finally, the assignment extends the data analysis to include decision-making processes related to sock popularity and stock availability, expanding the existing tables in Excel to incorporate these factors. The analysis covers various aspects of the business, from cost analysis to sales insights and process automation, providing a comprehensive understanding of Sock Spike's operations and potential improvements. The assignment uses Microsoft Excel to perform the analysis and visualization tasks, demonstrating the application of data analysis techniques in a practical business context. The student has used the skills acquired through practical laboratory exercises to automate a business process and visualize the impact of the automation.
tabler-icon-diamond-filled.svg

Contribute Materials

Your contribution can guide someone’s learning journey. Share your documents today.
Document Page
Running head: UNDERSTANDING DIGITAL REVOLUTION FOR SOCK SPIKE
Understanding Digital revolution for Sock Spike
Name of the Student
Name of the University
Authors note
tabler-icon-diamond-filled.svg

Secure Best Marks with AI Grader

Need help grading? Try our AI Grader for instant feedback on your assignments.
Document Page
1UNDERSTANDING DIGITAL REVOLUTION FOR SOCK SPIKE
Task 0
Sock Spike manages its online business with the help of three employees Amy,
Briony, and Cheryl. Out of this three employees Amy and Briony are skilled employees and
work together in order to manufacture socks ordered by the customers. On the other hand,
Cheryl is responsible for handling the orders, sales and delivery of the produced products.
Following table shows the weekly and annual working shifts for the employees.
Task 1
In order to find out total operational cost thus it is important to consider all the cost
that are required in the operations of the business. This includes, payable to employees,
payable to replacement worker, insurance and utility cost. For this part, the standard 5
working days are considered in order find the total operational cost that includes the payable
to the employees.
Sock
Spik
e
Staff Days
D
ay
C
ou
nt
Sh
ift
H
ou
rs
Total
workin
g
hours
weekly
Extra
Hours
working
every
week
Tot
al
Shif
t
Hou
rs
H
ou
rly
Pa
y
W
ee
kly
Pa
y
Annu
al
Paya
ble
Amy
Monday
,Tuesda
y and
Wednes
day 3 7.5 22.5 3 25.5
$
26.
00
$
663.
00
$
34,476.
00
Brion
y
Thursda
y,
Friday 2 7.5 15 0 15
$
26.
00
$
390.
00
$
20,280.
00
Chery Monday 5 4.5 22.5 3 25.5 $ $ $
Document Page
2UNDERSTANDING DIGITAL REVOLUTION FOR SOCK SPIKE
l
to
Friday
24.
00 612.
00
31,824.
00
Annua
l Cost
for
Insura
nce
$
9,100.0
0
Repla
cemen
t
Work
er 66
$
39.
00
$
2,57
4.00
$
10,296.
00
Utility
Cost
$
3,120.0
0
Annual
Operati
ng Cost
$
1,09,09
6.00
Task 2
In order to find out the different insights from the available past sales data, following
a charts are generated after generating three columns which are profit, weekdays (Generating
from the date column using the “TEXT” formula in excel) and lastly the employees for the
given day.
For the first chart the count of quotes in different price ranges are plotted. Here it can
be stated that maximum number of orders are placed in the quote range $110-190.
Document Page
3UNDERSTANDING DIGITAL REVOLUTION FOR SOCK SPIKE
30-110
110-190
190-270
270-350
350-430
430-510
510-590
590-670
670-750
750-830
0 10 20 30 40 50 60 70 80 90
Count of Quotes
In the next chart the manufacturing cost is calculated for products with different sizes.
L
M
S
XL
XS
XXL
0 500 1000 1500 2000 2500
1425.9 2323.2
1441.5 2186.1
2010
1964.2
Sum of Manufacturing cost ($) by
Size
From the above chart it can be stated that, maximum manufacturing cost is recorded
for the M sized products.
In this chart the profit from different sizes are calculated and plotted in chart.
tabler-icon-diamond-filled.svg

Secure Best Marks with AI Grader

Need help grading? Try our AI Grader for instant feedback on your assignments.
Document Page
4UNDERSTANDING DIGITAL REVOLUTION FOR SOCK SPIKE
L
M
S
XL
XS
XXL
2879.1
5326.4
2943.4
4284.3
5707.9
3661.5
Sum of Profit by Size
From the above chart it can be stated that, maximum profit is generated from the
orders placed with XS size which sums up to $5707.9 where as in case of M sized products
generated second highest profit from the business.
In the last chart the comparison between the revenue generated by the employees
from different materials.
Cotton
Leather
Silk
Tweed
Wool
Cotton
Leather
Silk
Tweed
Wool
Amy and Cheryl Briony and Cheryl
1393.6
5309
5479.4
971.5
4028
1052.4
1131.3
2031.3
594.7
2811.4
Sum of Profi t by Available staff
Total
Document Page
5UNDERSTANDING DIGITAL REVOLUTION FOR SOCK SPIKE
From the above chart it can be said that Amy and Cheryl generated highest profit
from the products made of Silk and for Briony and Cheryl Generated maximum profit from
the socks made of Wool.
Task 3
As the customer required items are produced by the solicitations of the clients
consequently so as to utilize the accessible resources in an better way while improving the
revenue from the business. Subsequently, contingent upon the past deals information the
quotation procedure is automated using the Excel formulas. So as to automate this procedure,
the "averageifs" equation is utilized so the quote can be reliable with the given past deals
information. Following is the table that can be utilized by the employees so as to get a
quicker statement relying upon the past deals.
Document Page
6UNDERSTANDING DIGITAL REVOLUTION FOR SOCK SPIKE
Task 4
In the following part the decision making process for the sock spike relying upon the
of the popularity and stock accessibility of a particular sort of sock. Along these lines,
expanding the recently made table (for the task 3), two new rows are included for the
employees as appeared in the accompanying tables in the excel file.
tabler-icon-diamond-filled.svg

Paraphrase This Document

Need a fresh take? Get an instant paraphrase of this document with our AI Paraphraser
Document Page
7UNDERSTANDING DIGITAL REVOLUTION FOR SOCK SPIKE
Bibliography
Frye, C. (2018). Microsoft Excel 2019 Step by Step. Microsoft Press.
Jelen, B. (2018). Microsoft Excel 2019 Inside Out. Microsoft Press.
McFedries, P. (2019). Microsoft Excel 2019 Formulas and Functions. Microsoft Press.
Sroka, J., Panasiuk, A., Stencel, K., & Tyszkiewicz, J. (2015). Translating relational queries
into spreadsheets. IEEE Transactions on Knowledge and Data Engineering, 27(8),
2291-2303.
Winston, W. (2016). Microsoft Excel data analysis and business modeling. Microsoft press.
chevron_up_icon
1 out of 8
circle_padding
hide_on_mobile
zoom_out_icon
logo.png

Your All-in-One AI-Powered Toolkit for Academic Success.

Available 24*7 on WhatsApp / Email

[object Object]