ITECH1103 Big Data Analytics: Comprehensive YouTube Analysis
VerifiedAdded on 2023/05/27
|24
|2106
|175
Report
AI Summary
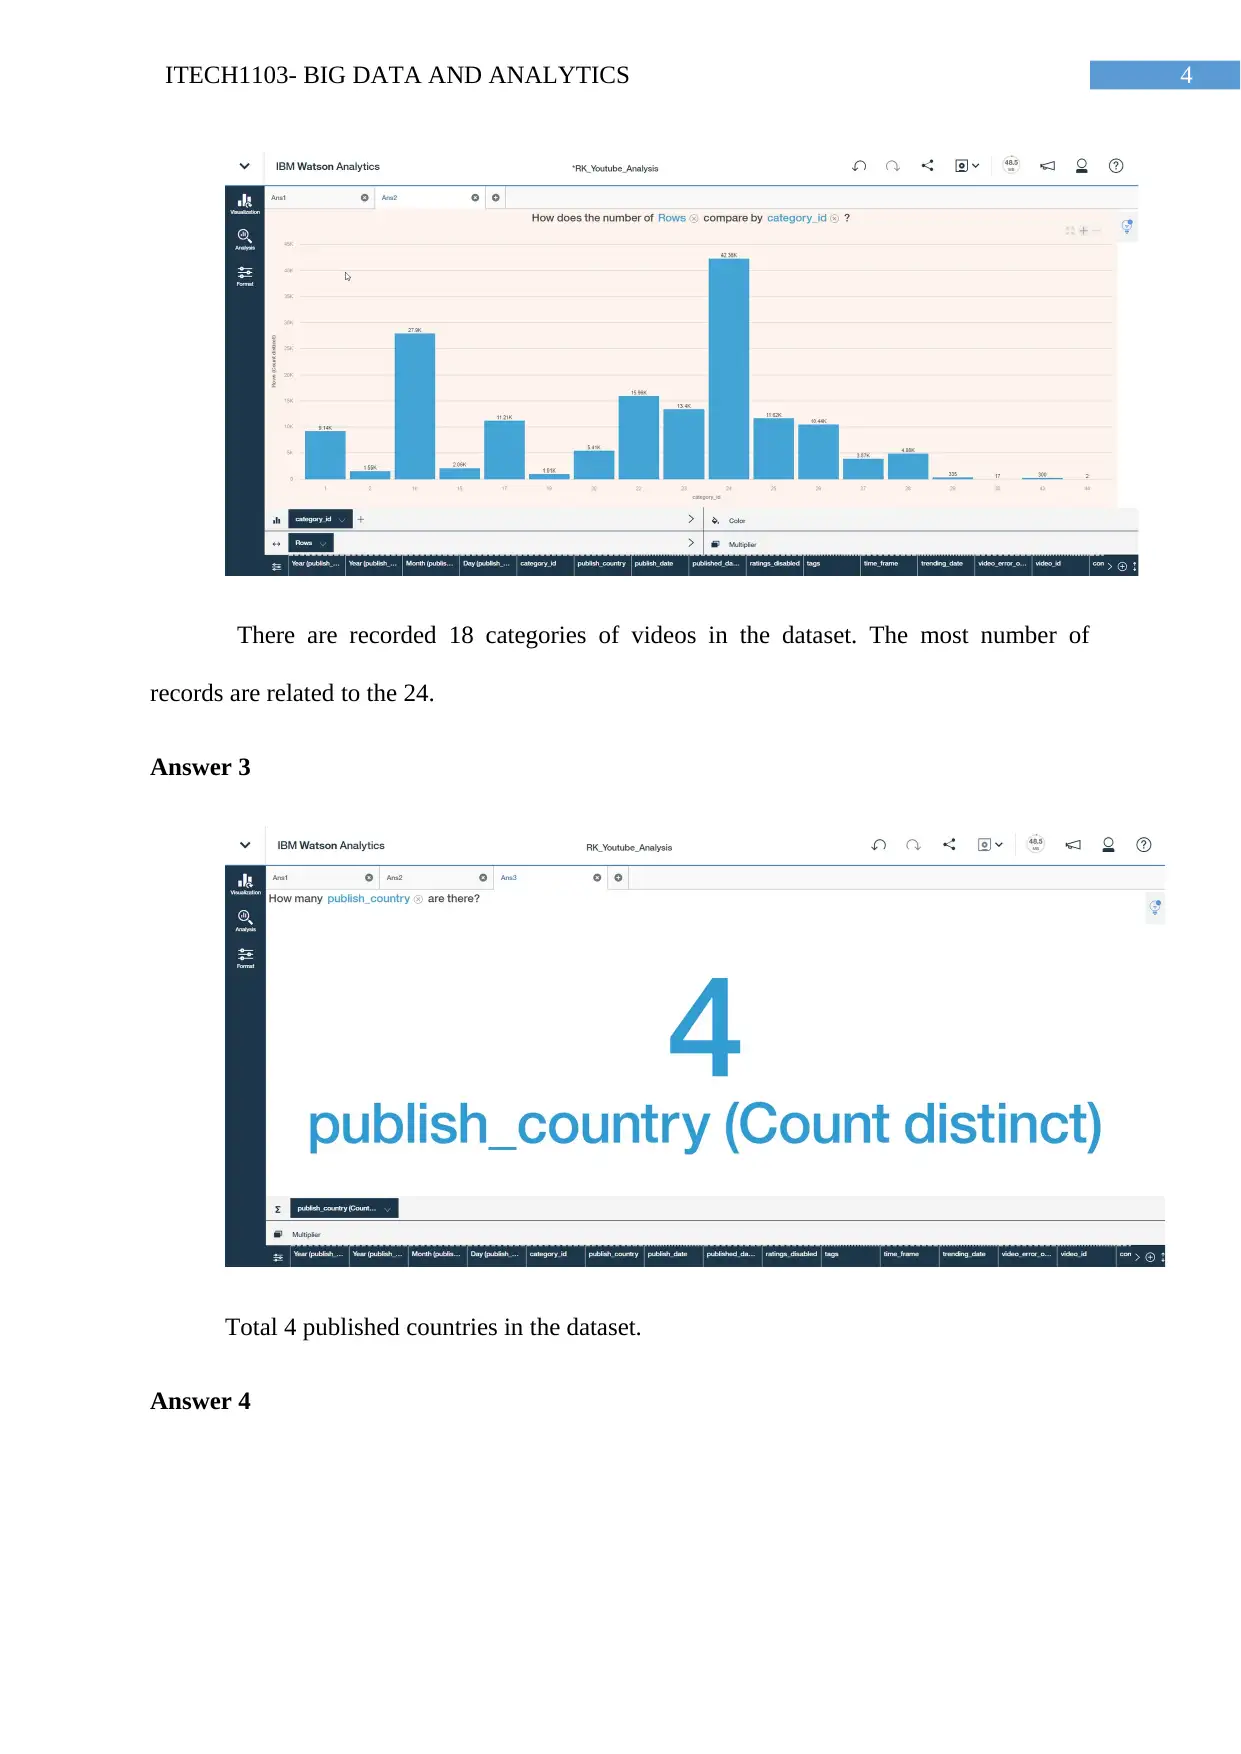
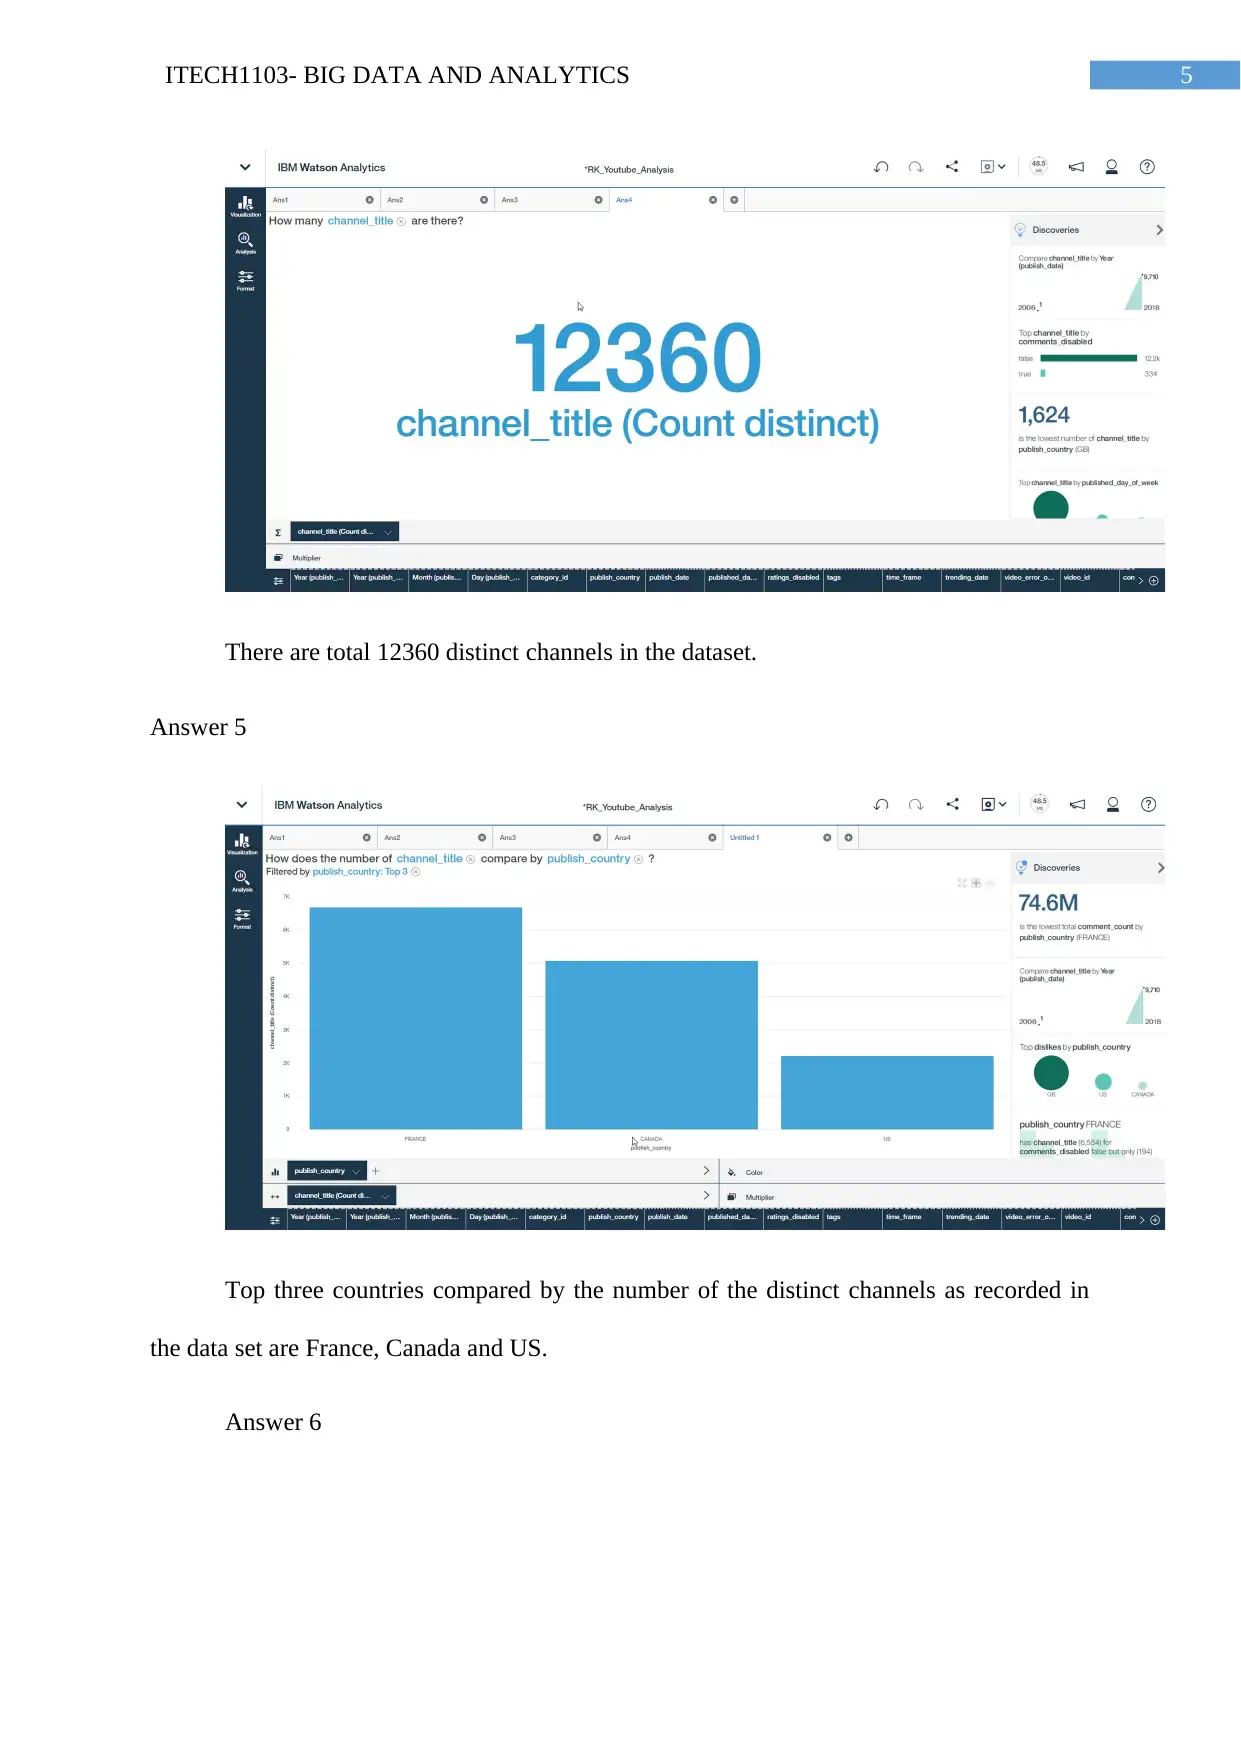
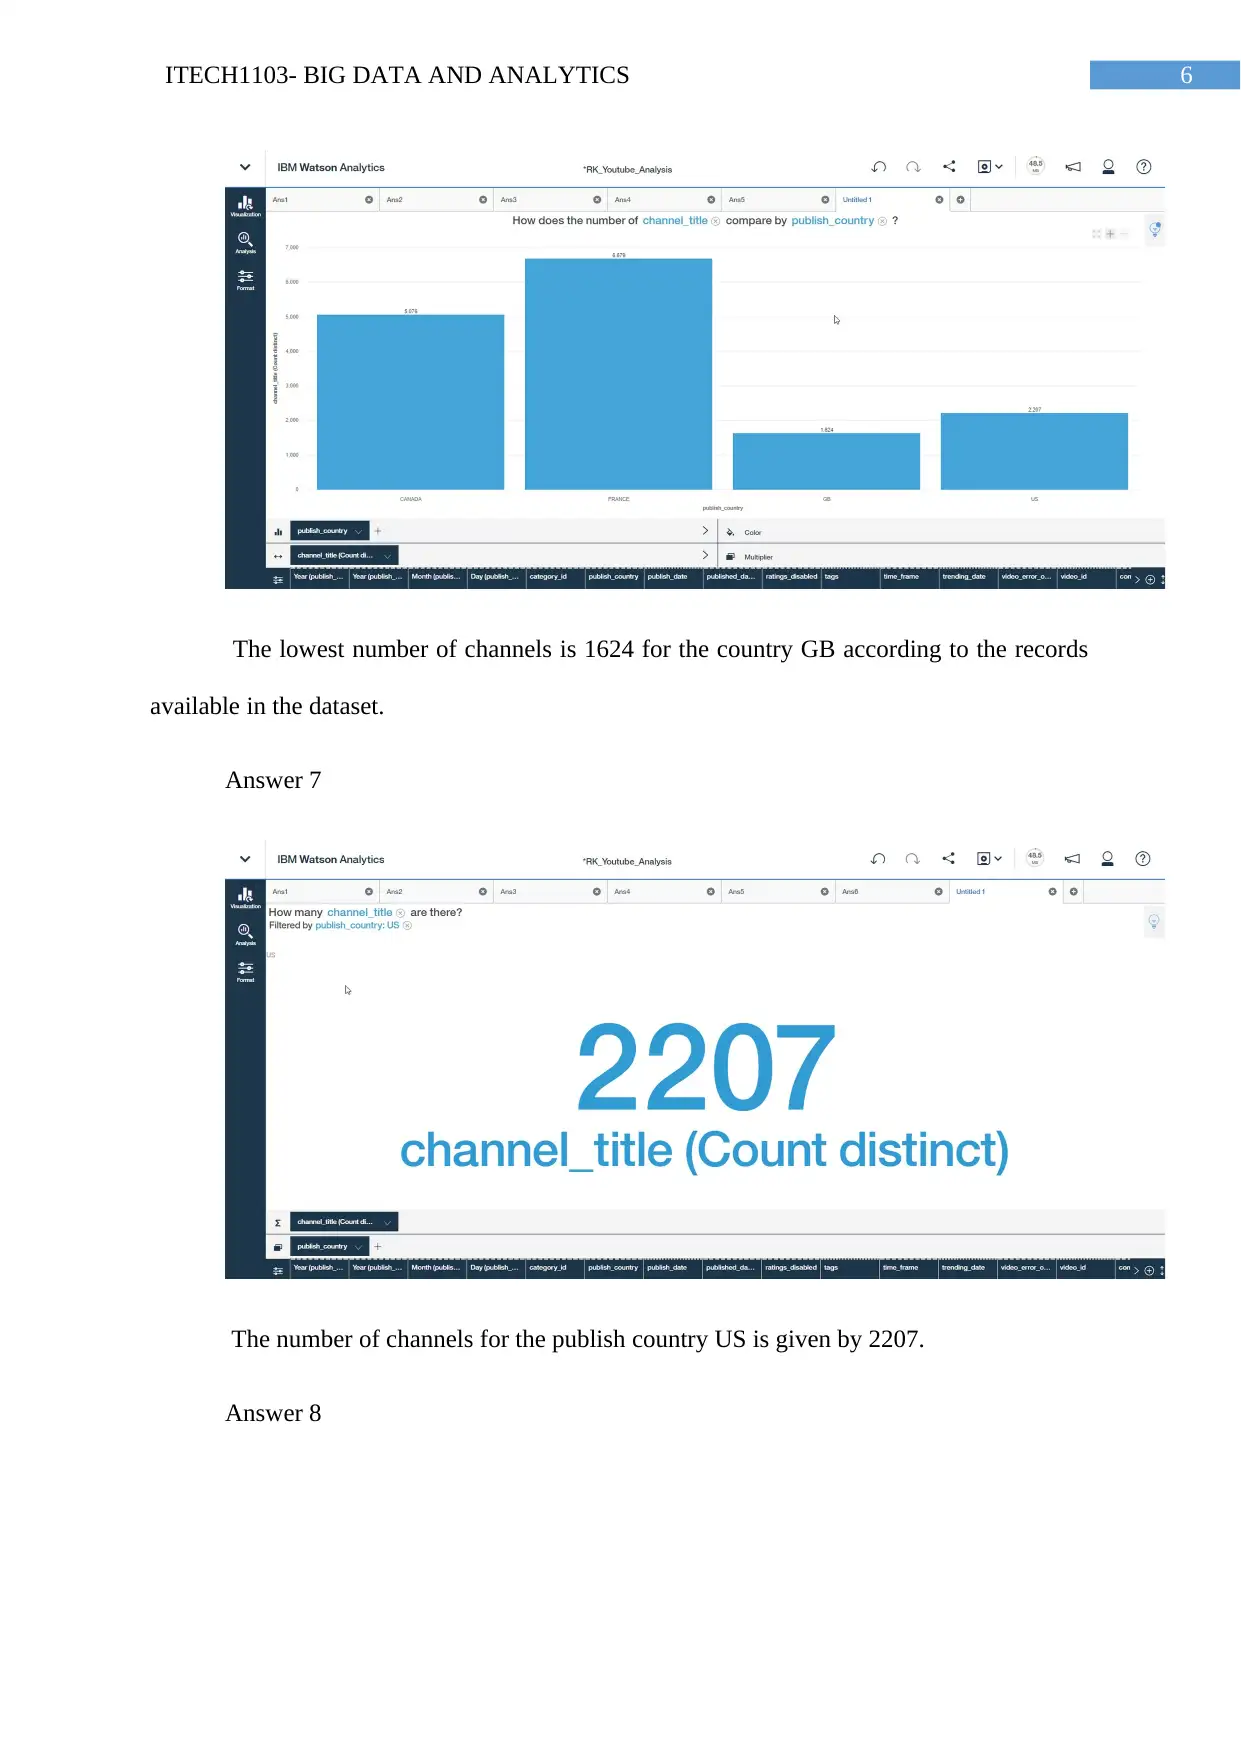
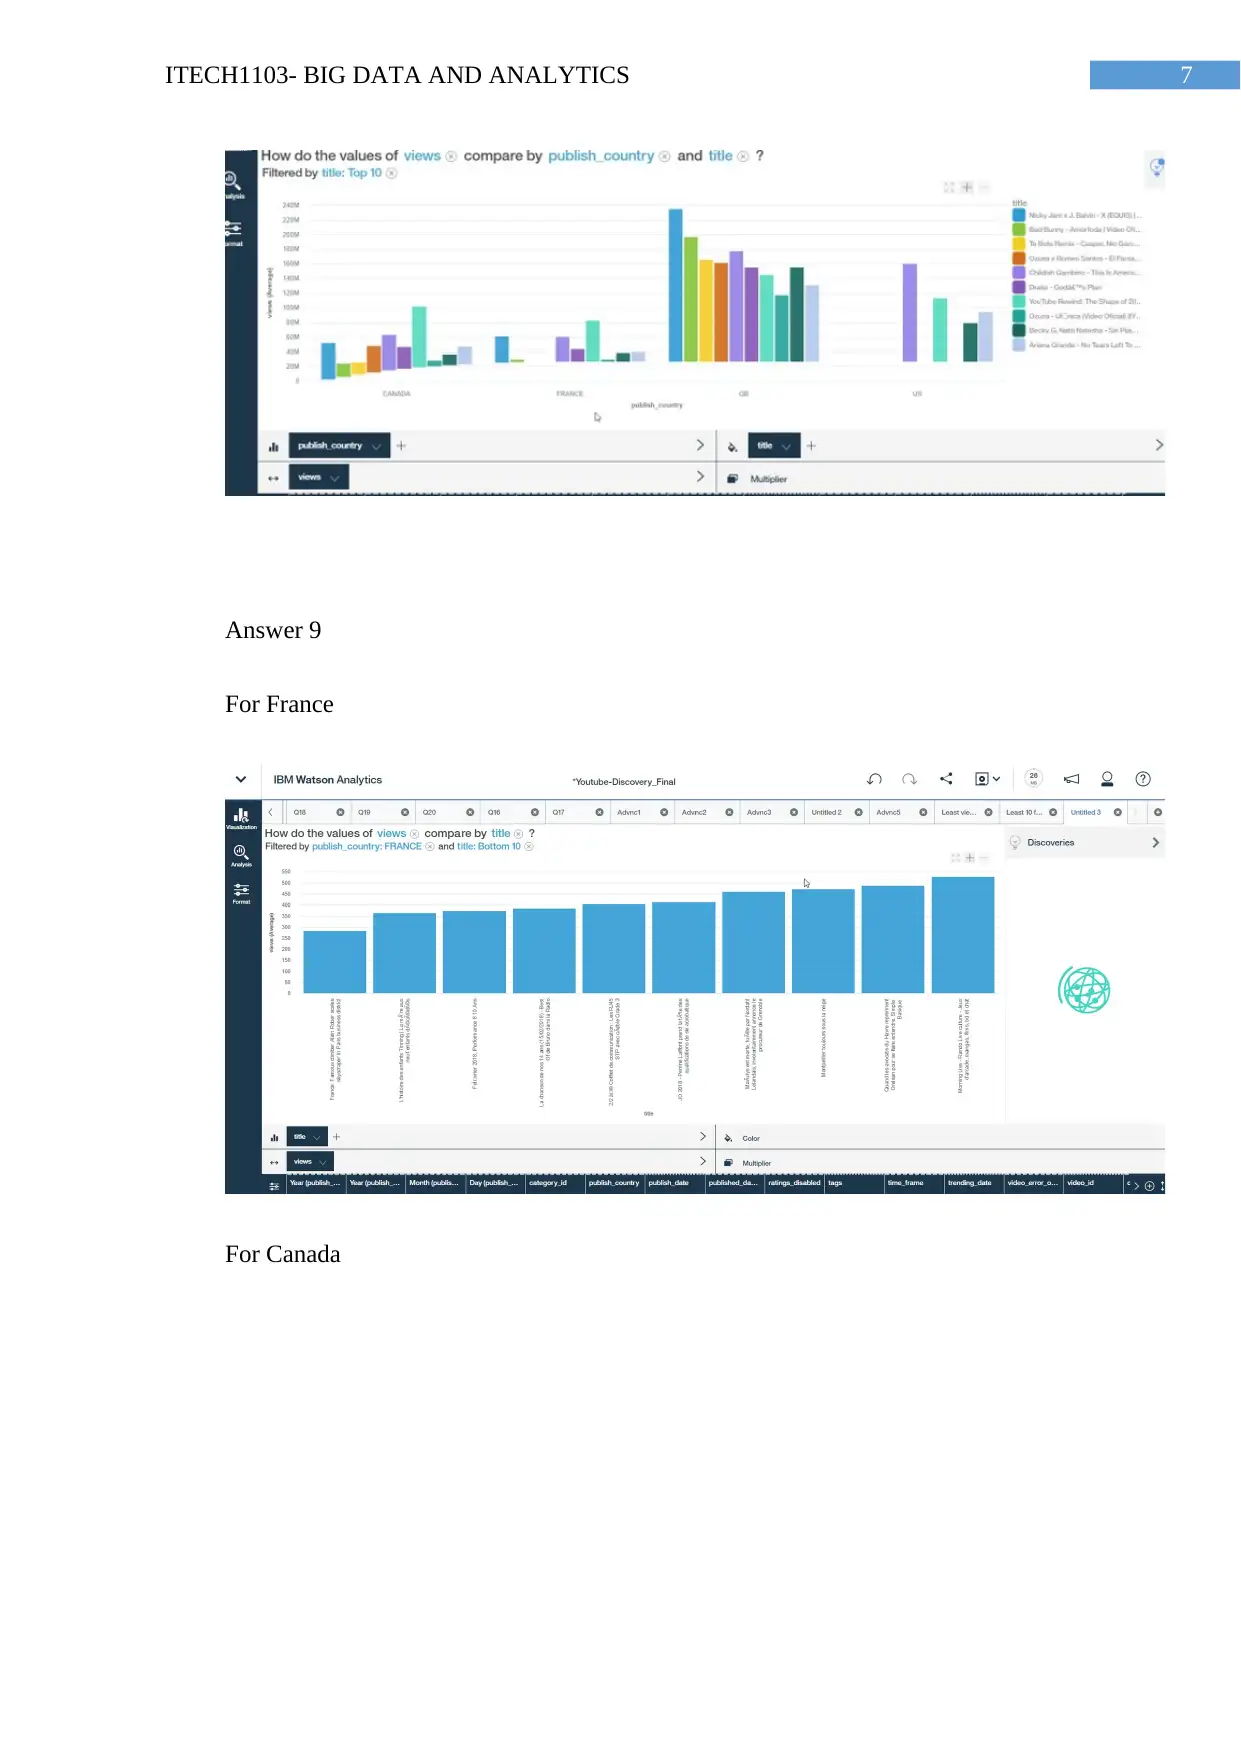
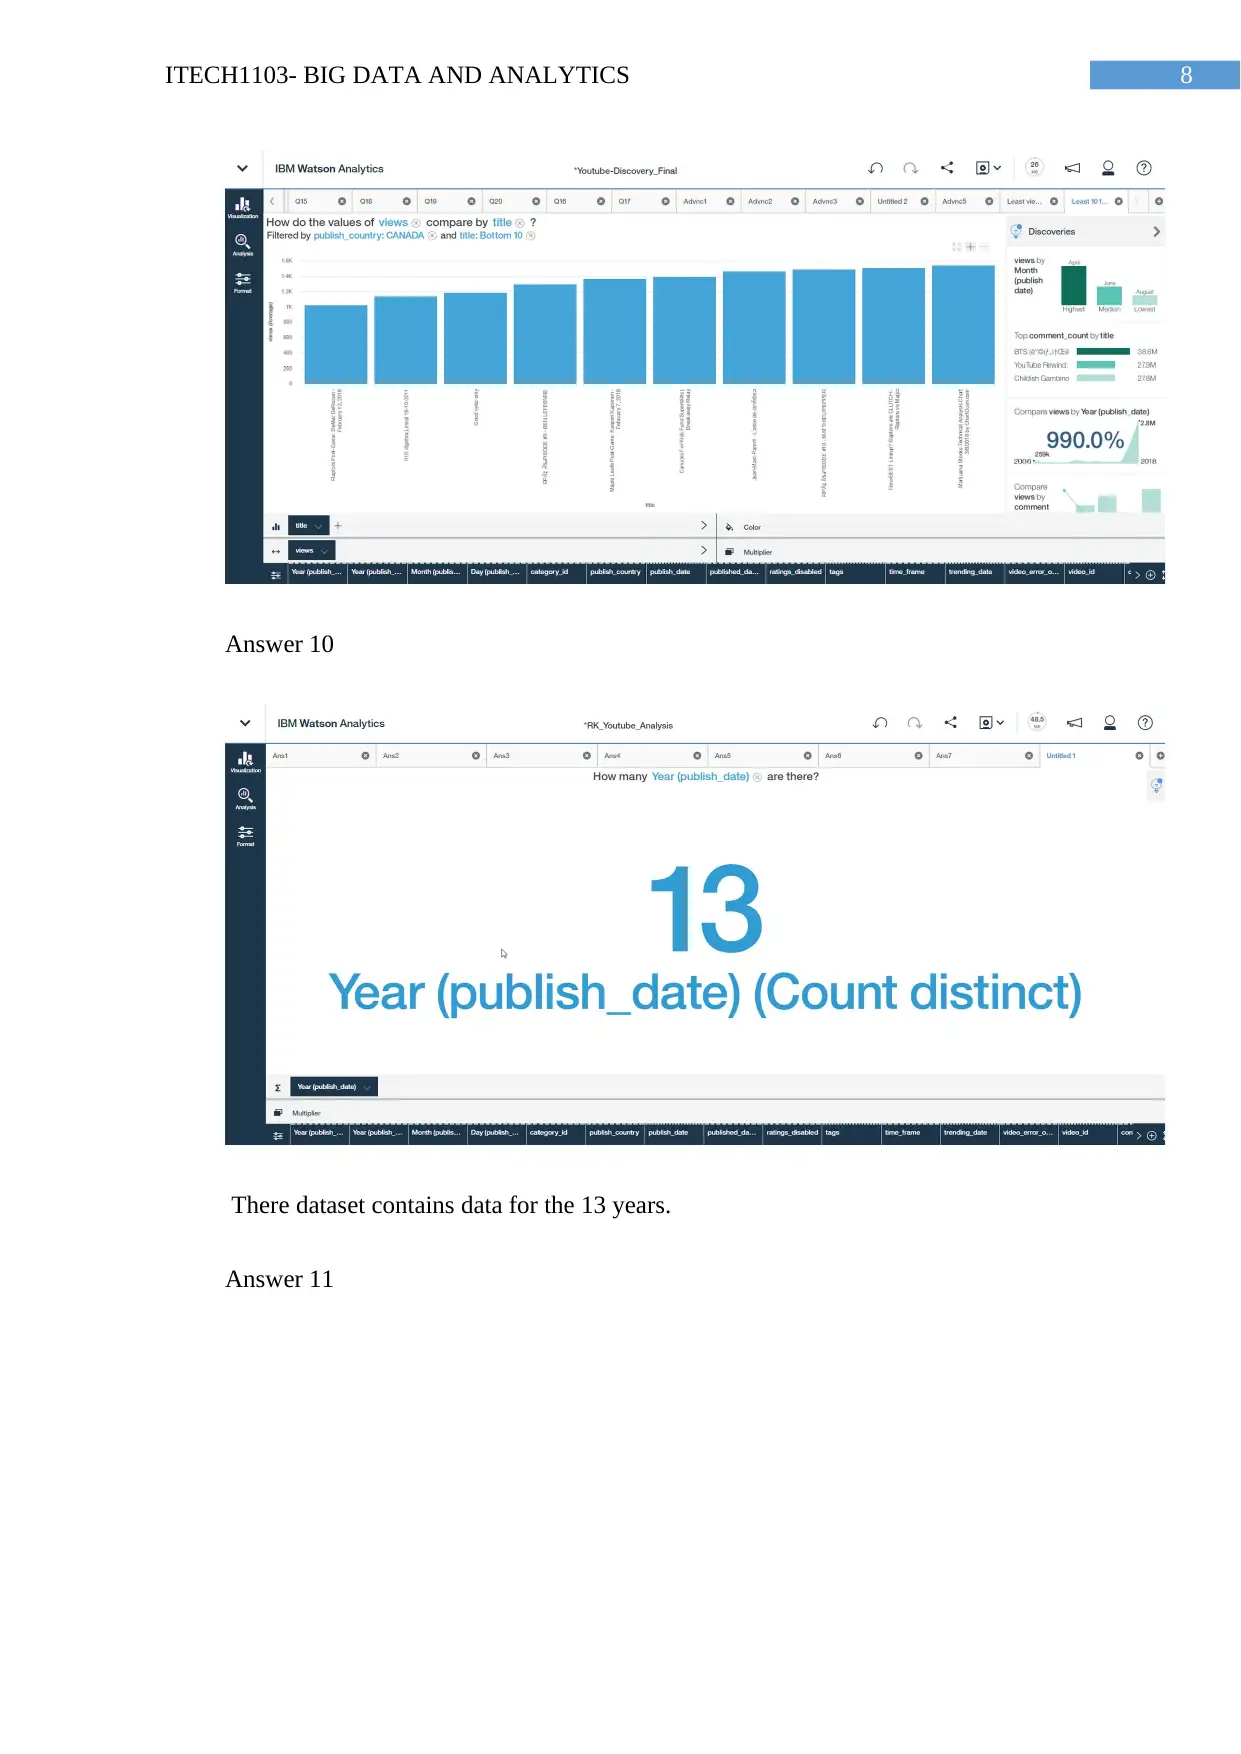
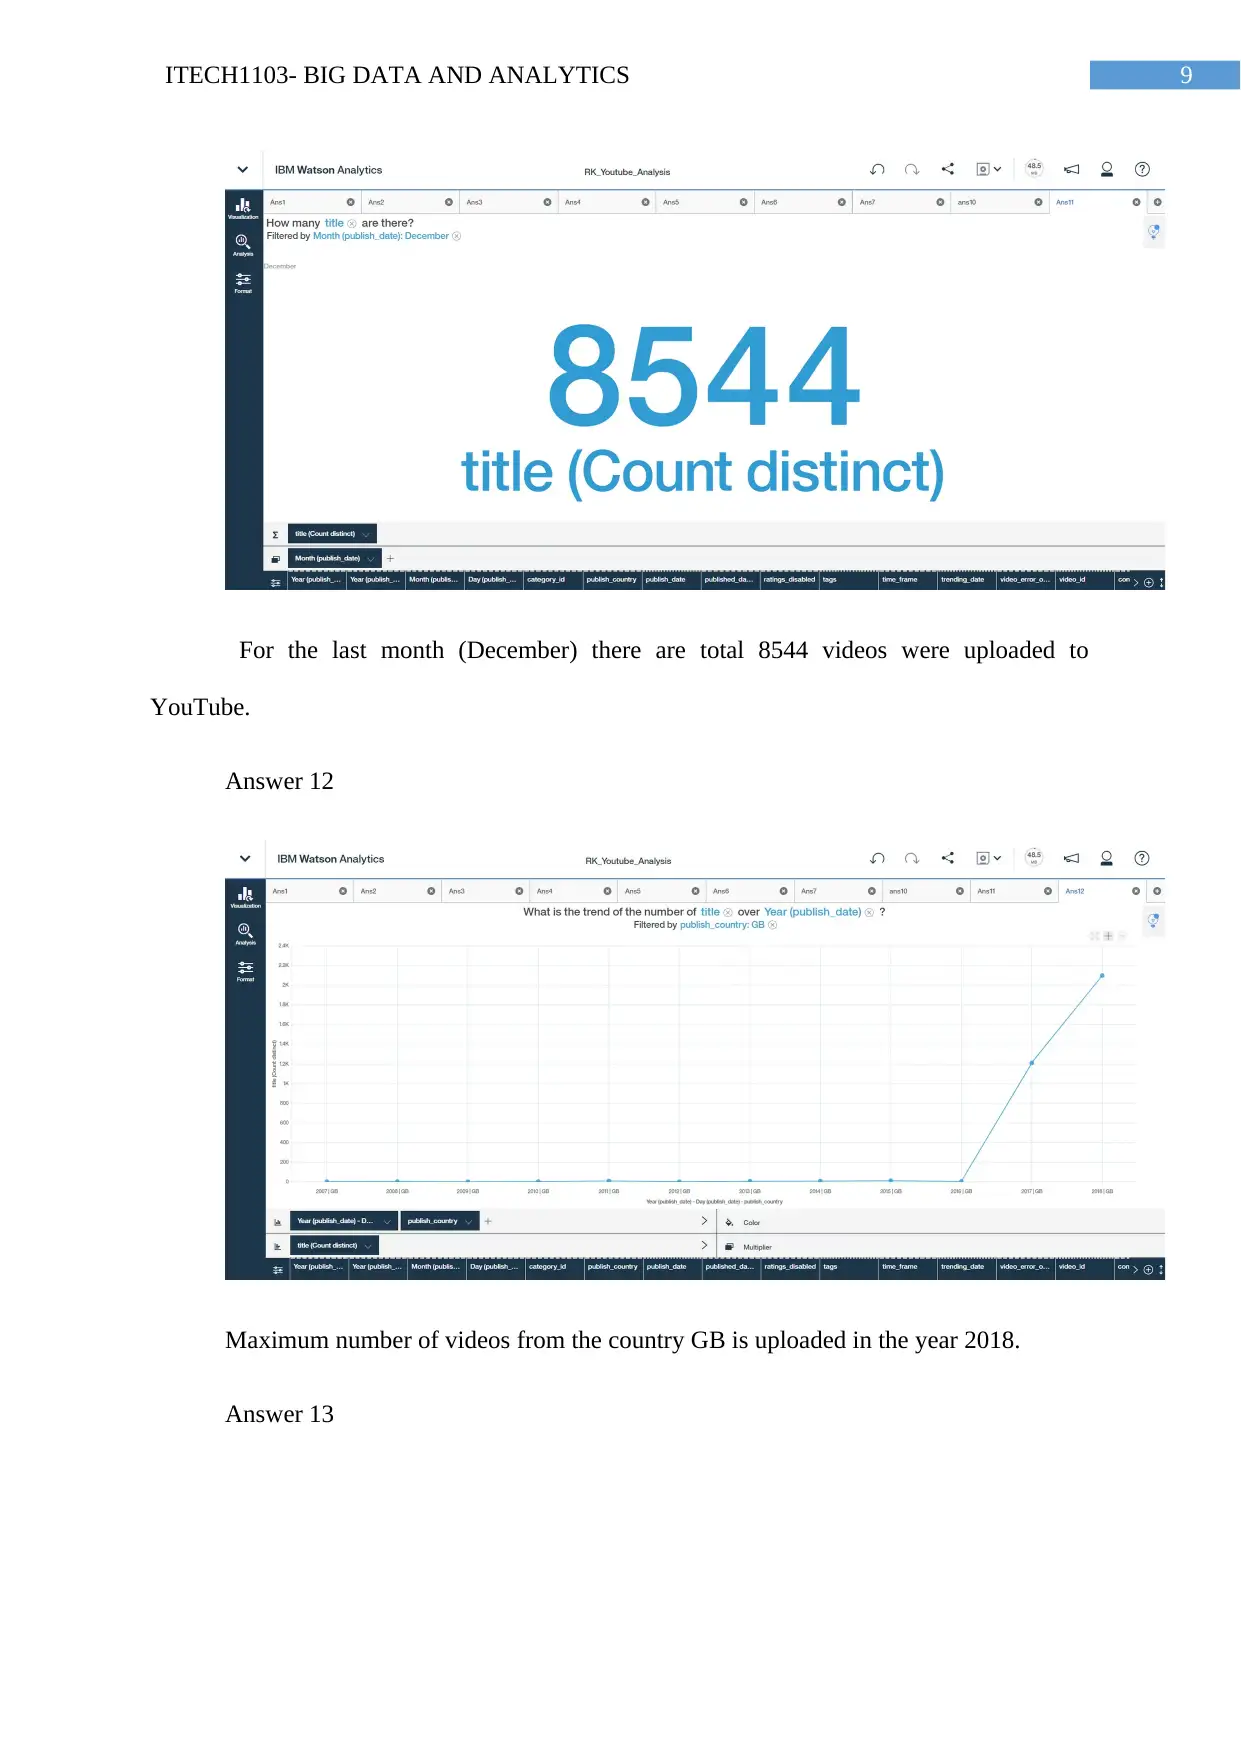
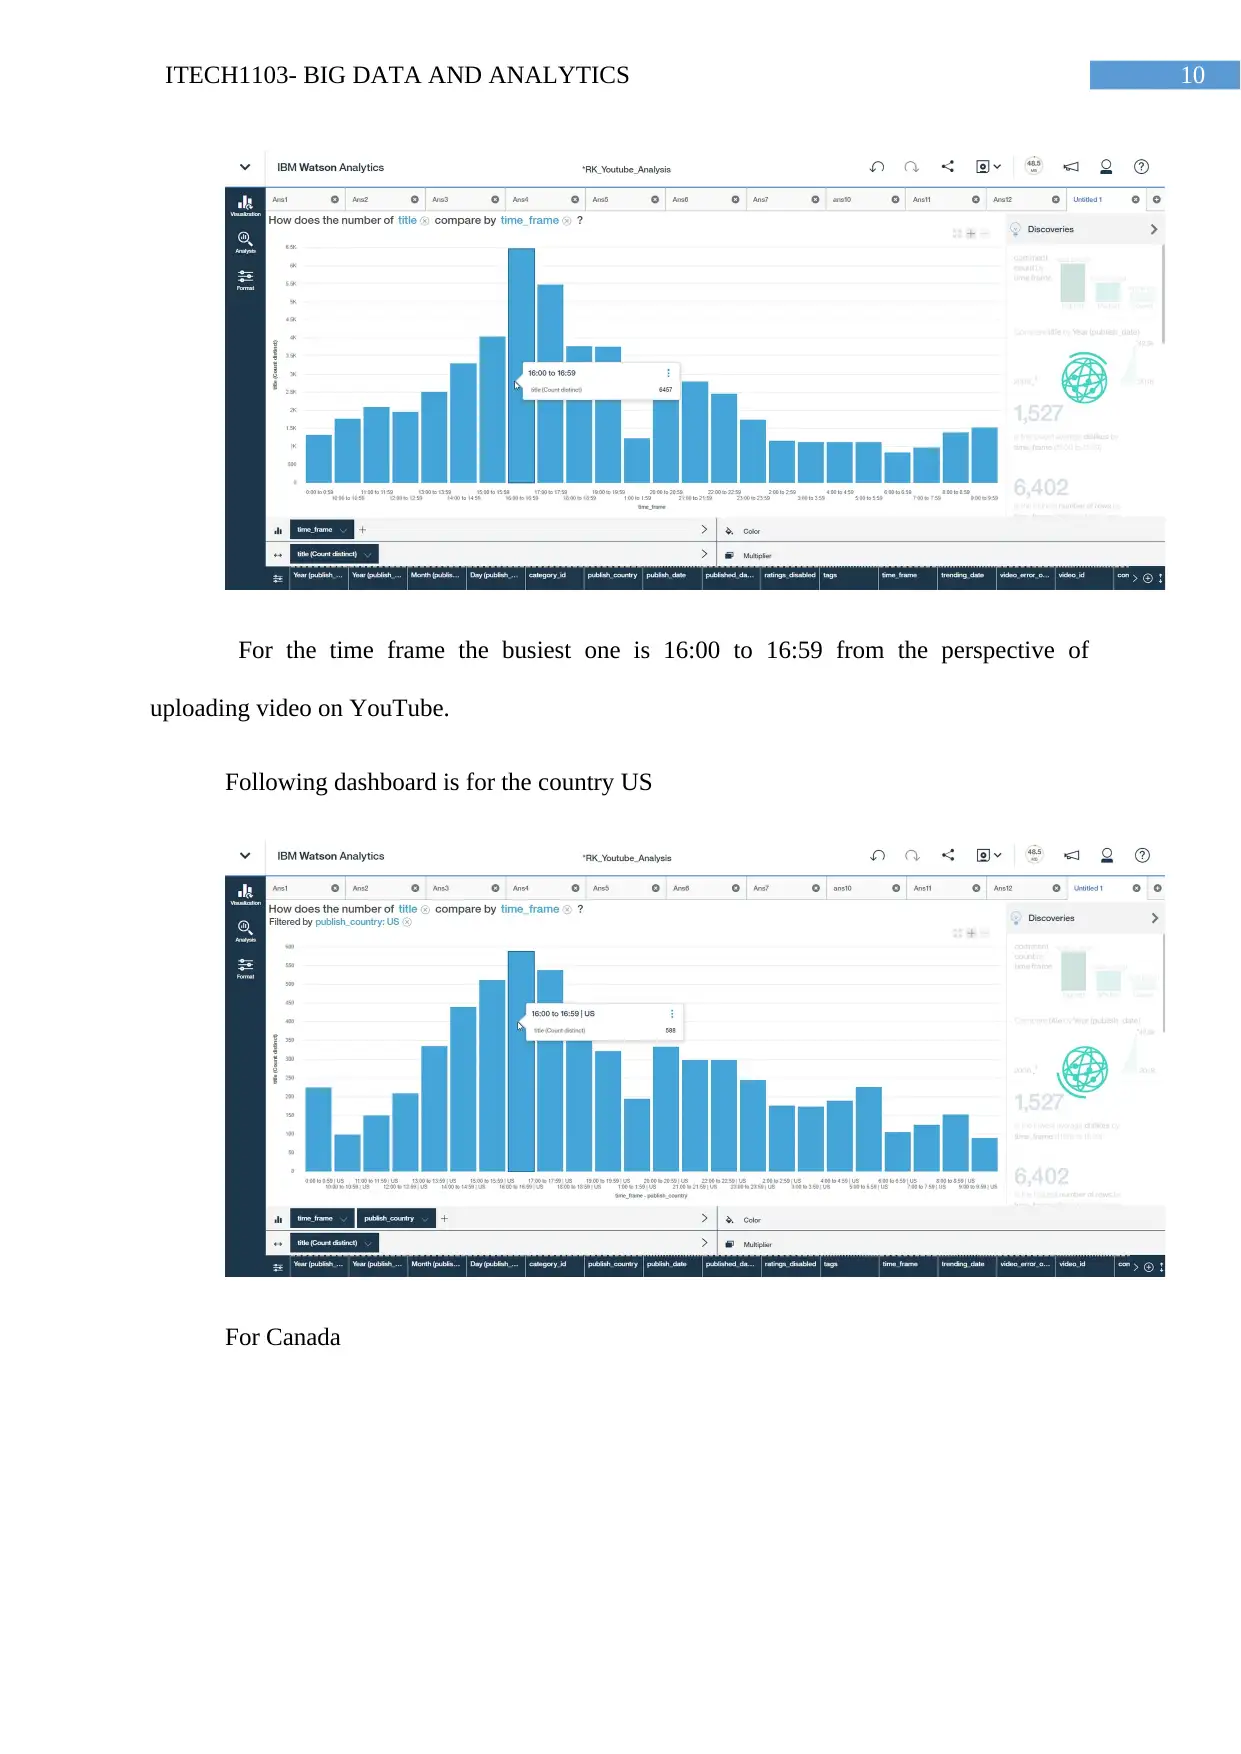
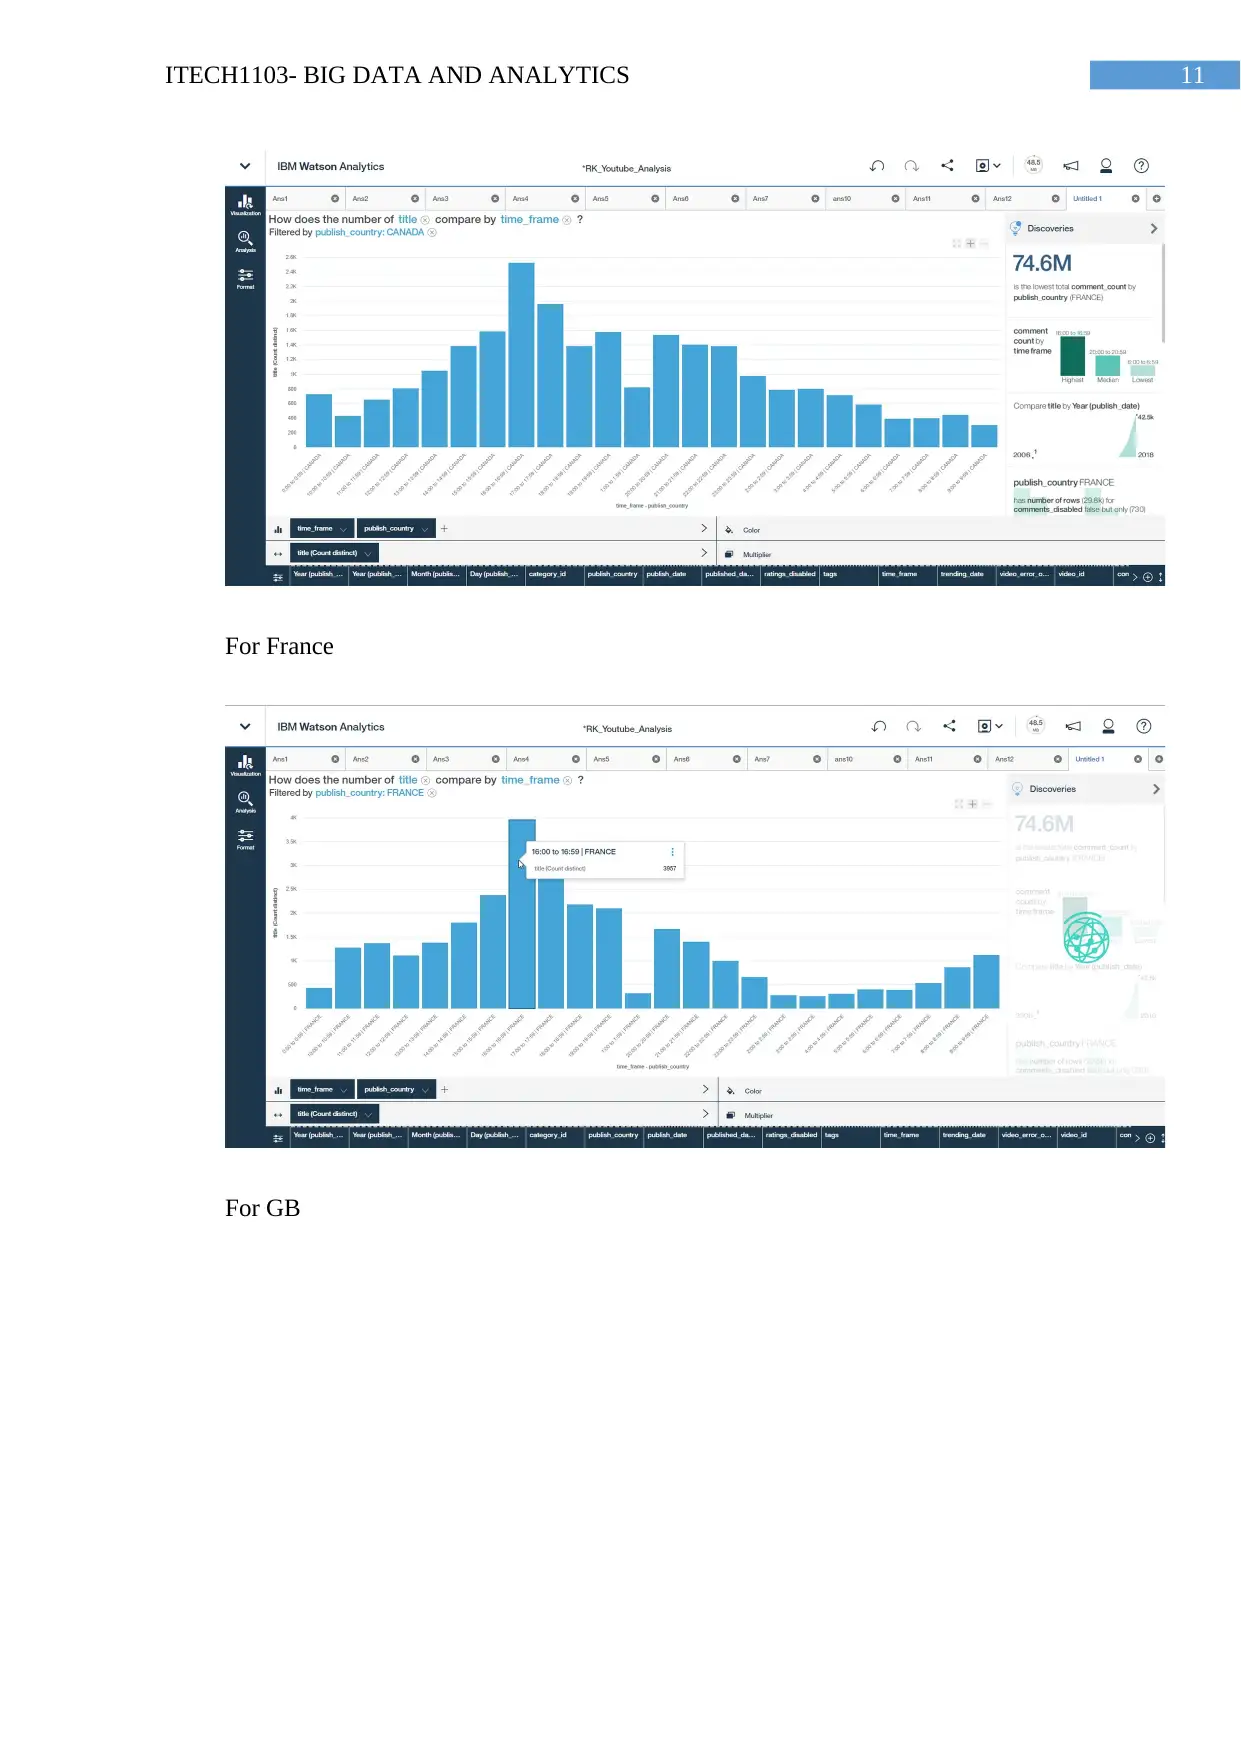
This report presents an analysis of a YouTube dataset using Watson Analytics to extract meaningful insights. The analysis covers various aspects such as video categories, upload times, views, likes, dislikes, and comments across different countries. Key findings include identifying the most popular video categories, busiest upload times, and correlations between dislikes and disabled comments. The report also offers recommendations for content managers based on the identified trends, particularly focusing on improving content quality and tailoring video releases to specific regions to maximize viewership. The analysis employs various visualization techniques, including bar charts, heat maps, and packed bubbles, to effectively communicate the findings to both technical and non-technical audiences. This document is available on Desklib, a platform offering a wealth of academic resources including past papers and solved assignments for students.
Contribute Materials
Your contribution can guide someone’s learning journey. Share your
documents today.

Running head: ITECH1103- BIG DATA AND ANALYTICS
ITECH1103- Big Data and Analytics
Name of the Student
Name of the University
Authors note
ITECH1103- Big Data and Analytics
Name of the Student
Name of the University
Authors note
Secure Best Marks with AI Grader
Need help grading? Try our AI Grader for instant feedback on your assignments.

1ITECH1103- BIG DATA AND ANALYTICS
Table of Contents
Introduction................................................................................................................................2
Background information............................................................................................................2
Dashboards.................................................................................................................................3
Advanced Insights....................................................................................................................16
Research...................................................................................................................................20
Recommendations for Content Manager.................................................................................20
Cover letter...............................................................................................................................21
Reflection.................................................................................................................................21
Conclusion................................................................................................................................22
Bibliography.............................................................................................................................23

2ITECH1103- BIG DATA AND ANALYTICS
Introduction
In the present era, YouTube is considered as most popular website that is used by the
users in order to view videos, upload videos on the respective channels. In addition to that, on
these platform users can respond against the videos by providing comments for different
videos, like or dislike the video according to their contents. Through storing the responses
for videos YouTube collects a range data points about the viewers as well as about the video
and uploader of the videos. This data point including View Counts of the videos, Likes,
Comments, dislikes, any error that occurred or if the video was deleted. Through the analysis
of the above mentioned attributes it is possible to find out or extract implicit
knowledge/patterns for the different user’s community interests in certain regions.
The following report contributes to the different insights that are available from the
analysis of the selected data set using the Watson analytics tool. In addition to that, the paper
also contributes to the recommendation that can be used by the managers in order to improve
the scenario.
Background information
Selected dataset is collected from the URL https://data.world/iamdilan/youtube-
dataset which contains the total 161471 rows along with the 17 attributes for each of the
records in the rows. Some of this attributes includes id of the video, trending date, title of
the video, channel title for the specific video, category, publish date or the upload date,
timeframe for the upload, count of likes and dislikes as well as count of the comments.

3ITECH1103- BIG DATA AND ANALYTICS
Dashboards
Following are the dashboards that are developed for the guided questions that are
enquired on Watson analytics tool.
Answer1
The dataset contains total 55885 distinct uploaded video titles. The Distinct titles are
considered as there are multiple duplicates in the selected dataset which are recorded
whenever viewers viewed the specific video.
Answer2
Secure Best Marks with AI Grader
Need help grading? Try our AI Grader for instant feedback on your assignments.

4ITECH1103- BIG DATA AND ANALYTICS
There are recorded 18 categories of videos in the dataset. The most number of
records are related to the 24.
Answer 3
Total 4 published countries in the dataset.
Answer 4
There are recorded 18 categories of videos in the dataset. The most number of
records are related to the 24.
Answer 3
Total 4 published countries in the dataset.
Answer 4

5ITECH1103- BIG DATA AND ANALYTICS
There are total 12360 distinct channels in the dataset.
Answer 5
Top three countries compared by the number of the distinct channels as recorded in
the data set are France, Canada and US.
Answer 6
There are total 12360 distinct channels in the dataset.
Answer 5
Top three countries compared by the number of the distinct channels as recorded in
the data set are France, Canada and US.
Answer 6

6ITECH1103- BIG DATA AND ANALYTICS
The lowest number of channels is 1624 for the country GB according to the records
available in the dataset.
Answer 7
The number of channels for the publish country US is given by 2207.
Answer 8
The lowest number of channels is 1624 for the country GB according to the records
available in the dataset.
Answer 7
The number of channels for the publish country US is given by 2207.
Answer 8
Paraphrase This Document
Need a fresh take? Get an instant paraphrase of this document with our AI Paraphraser

7ITECH1103- BIG DATA AND ANALYTICS
Answer 9
For France
For Canada
Answer 9
For France
For Canada

8ITECH1103- BIG DATA AND ANALYTICS
Answer 10
There dataset contains data for the 13 years.
Answer 11
Answer 10
There dataset contains data for the 13 years.
Answer 11

9ITECH1103- BIG DATA AND ANALYTICS
For the last month (December) there are total 8544 videos were uploaded to
YouTube.
Answer 12
Maximum number of videos from the country GB is uploaded in the year 2018.
Answer 13
For the last month (December) there are total 8544 videos were uploaded to
YouTube.
Answer 12
Maximum number of videos from the country GB is uploaded in the year 2018.
Answer 13
Secure Best Marks with AI Grader
Need help grading? Try our AI Grader for instant feedback on your assignments.

10ITECH1103- BIG DATA AND ANALYTICS
For the time frame the busiest one is 16:00 to 16:59 from the perspective of
uploading video on YouTube.
Following dashboard is for the country US
For Canada
For the time frame the busiest one is 16:00 to 16:59 from the perspective of
uploading video on YouTube.
Following dashboard is for the country US
For Canada

11ITECH1103- BIG DATA AND ANALYTICS
For France
For GB
For France
For GB

12ITECH1103- BIG DATA AND ANALYTICS
From the comparison of the above all the dashboards it is visible that only for the
country GB the time frame is changed and for this country the busiest time frame is 17:00 to
17:59.
Answer 14
From the comparison of the above all the dashboards it is visible that only for the
country GB the time frame is changed and for this country the busiest time frame is 17:00 to
17:59.
Answer 14
Paraphrase This Document
Need a fresh take? Get an instant paraphrase of this document with our AI Paraphraser

13ITECH1103- BIG DATA AND ANALYTICS
Top three categories compared by the views is given by 10 (Music), 29 (Non-profits
and Activism) and 1 (Film and Animation).
Answer 15
The bottom three categories compared by the views are 27 (Education), 25 (News
and Politics) and 44 (Trailers of the movies).
Answer 16
Top three categories compared by the views is given by 10 (Music), 29 (Non-profits
and Activism) and 1 (Film and Animation).
Answer 15
The bottom three categories compared by the views are 27 (Education), 25 (News
and Politics) and 44 (Trailers of the movies).
Answer 16

14ITECH1103- BIG DATA AND ANALYTICS
Following are the top 3 video titles compared by the views according to the dataset
are
Childish Gambino - This Is America (Official Video)
Ariana Grande - No Tears Left To Cry (Live From The Billboard Music Awards /
2018)
BTS (방탄소년단) 'FAKE LOVE' Official
Answer 17
Following are the top 3 video titles compared by the views according to the dataset
are
Childish Gambino - This Is America (Official Video)
Ariana Grande - No Tears Left To Cry (Live From The Billboard Music Awards /
2018)
BTS (방탄소년단) 'FAKE LOVE' Official
Answer 17

15ITECH1103- BIG DATA AND ANALYTICS
The least three video titles compared by the views are given by
So sorry.
YouTube Rewind
Suicide: Be here tomorrow
Answer 18
The week day on which the number of the uploaded video is Friday.
Answer 19
The least three video titles compared by the views are given by
So sorry.
YouTube Rewind
Suicide: Be here tomorrow
Answer 18
The week day on which the number of the uploaded video is Friday.
Answer 19
Secure Best Marks with AI Grader
Need help grading? Try our AI Grader for instant feedback on your assignments.

16ITECH1103- BIG DATA AND ANALYTICS
Saturday is the week day on which least number of videos were uploaded on the
YouTube platform.
Answer 20
Above dashboard shows the monthly break down of the uploaded videos on
YouTube. Here it can be observed that the number of uploaded videos has a sudden increase
from the month November 2017 and the rate decreased in the month in June 2018.
Advanced Insights
Advance insight 1
In the next insight we tried to find out the views compared by countries as recorded in
the dataset.

17ITECH1103- BIG DATA AND ANALYTICS
Here it can be said that, the maximum number of views for different countries is from
the GB even though the number of channels is lowest among the countries. The second
highest number of the views is from US. This view is from the highest number channels in
the US country.
Advance insight 2
The number of top viewed category for country GB is analysed in this dashboard.
Here for the country GB, the top viewed categories are 10, 24,29,1,22,23,28.

18ITECH1103- BIG DATA AND ANALYTICS
Advance insight 3
Relation between likes, views and along the year as been analysed for the videos in
the selected dataset. Here it is clear that, the likes for the videos have been increased from the
year 2016 and continued to 2018.
The likes for the videos remained parallel with the number of videos.
Advance insight 4
In this insight the relation between the dislikes and disabled comments are discovered. Here,
it is clearly visible that with increased number of dislikes the comments are most probably
disabled for the concerned video title.
Paraphrase This Document
Need a fresh take? Get an instant paraphrase of this document with our AI Paraphraser

19ITECH1103- BIG DATA AND ANALYTICS
The huge number of true values for the dislikes for the videos lead to the disabling
the comments for the videos.
Advance insight 5
For this insight the dislikes for the different videos are increased by 2259% when compared
by the dislikes for the videos on YouTube platform.
The huge number of true values for the dislikes for the videos lead to the disabling
the comments for the videos.
Advance insight 5
For this insight the dislikes for the different videos are increased by 2259% when compared
by the dislikes for the videos on YouTube platform.

20ITECH1103- BIG DATA AND ANALYTICS
From here it can be said that with the increased number of dislikes the removal of the
videos got increased with time.
Research
In this analysis for the guided questions the bar charts, Heat map, Packed bubbles are
used in order to visualize the results in such a way that the results can be easily interpreted to
the managers of the organization as well as any other non-technical user.
Again for the advanced insights, the number of the likes compared to the overall
views for the videos on the YouTube channel the combination of the bar and line graph is
used so that the values for them can be compared. In this way, it can be clearly visualized
that, the amount of likes had a sudden jump compared to the views from the year 2017 and
continued in 2018.
Recommendations for Content Manager
From the analysis it is evident that most number of views as well as dislikes are from
GB. Therefore, following are some suggestions that can help in improving the scenario.

21ITECH1103- BIG DATA AND ANALYTICS
It is important to improve quality of the contents for the channels in GB so that
viewership in that country can be maintained.
The release of the of music related videos and trailer contents should be encouraged
in order to attract larger number of viewers in US, CANADA and FRANCE.
Comments are disliked are correlated therefore the videos accumulating a certain
number of dislikes must be restricted in the regions and other type of videos should be
encouraged.
Cover letter
To
The Content Manager
ABC online Multimedia Company
Respected Sir/Madam,
This letter is intended to convey the insights that are gathered after
the analysis of the dataset about YouTube. From the analysis it is evident that, the number of
uploaded videos increased in 2018 and the most number of viewers are from the GB along
with the highest number of audience when compared to the countries US, FRANCE and
CANADA. From the different insights it was evident that the most viewed video category is
10 or the music related videos on the YouTube channels.
In addition to that, when the total views are analysed then it is found that the most
viewed category is 10 i.e. the music related videos on the YouTube channels. The next two
Secure Best Marks with AI Grader
Need help grading? Try our AI Grader for instant feedback on your assignments.

22ITECH1103- BIG DATA AND ANALYTICS
categories are 29,1. Furthermore the most liked titles were Childish Gambino - This Is
America (Official Video) and among all the records “So sorry” is the most disliked video.
Thanking You,
[Fill your name]
Reflection
As the AI based cognitive tool helps in analysing the associations and patterns in the
chosen dataset it makes the analysis process much more easy compared to other tools. In this
project the only issue I faced is to understand how this cloud based tool breaks the provided
question and the choosing the right starting points to proceed further.
In addition to that different types of visualization also helpful in providing some easy
interpretation of the insights through the use of the tool.
Conclusion
The Watson Analytics tool is a cloud based intelligent, self-service data analysis tool
that helps in the visualization of the hidden patterns in a large amount of data for discovering
insights from it. This tool guides the users through the process of discovery of the insights
while automating the process of predictive analysis on the selected dataset.
With the NLP (natural language processing) capability this tools helps in interacting
with the data in a versatile way in order to find out the desired insight. In this way it helps in
the extraction of the answers from unstructured as well as structured information with ease
from the dataset.

23ITECH1103- BIG DATA AND ANALYTICS
Bibliography
Chen, Y., Argentinis, J. E., & Weber, G. (2016). IBM Watson: how cognitive computing can
be applied to big data challenges in life sciences research. Clinical
therapeutics, 38(4), 688-701.
Mehta, N., & Devarakonda, M. V. (2018). Machine learning, natural language programming,
and electronic health records: The next step in the artificial intelligence journey?.
Trivedi, H., Mesterhazy, J., Laguna, B., Vu, T., & Sohn, J. H. (2018). Automatic
determination of the need for intravenous contrast in musculoskeletal MRI
examinations using IBM Watson’s natural language processing algorithm. Journal of
digital imaging, 31(2), 245-251.
Tsoi, K. K., Chan, F. C., Hirai, H. W., Leung, G. K., Kuo, Y. H., Tai, S., & Meng, H. M.
(2017). Data visualization on global trends on cancer incidence an application of IBM
Watson Analytics.
1 out of 24
Related Documents

Your All-in-One AI-Powered Toolkit for Academic Success.
+13062052269
info@desklib.com
Available 24*7 on WhatsApp / Email
Unlock your academic potential
© 2024 | Zucol Services PVT LTD | All rights reserved.