ITECH1103 Big Data: Crime Analysis and Reporting with Watson Analytics
VerifiedAdded on 2023/06/08
|13
|2364
|86
Report
AI Summary
This report analyzes crime data in Chicago from 2014 to 2017 using IBM Watson Analytics as part of the ITECH1103 Big Data and Analytics assignment. The analysis identifies trends in crime types, locations, and arrests, highlighting key findings such as the prevalence of theft, battery, and criminal damage, as well as the high incidence of street crimes. The report also examines domestic violence incidents and provides recommendations for the Chicago Police Department, including increased street patrols and a culturally sensitive approach to addressing domestic crimes. The reflection discusses the experience of using Watson Analytics and its NLP capabilities. Desklib provides access to similar solved assignments and past papers for students.
Running Head: BIG DATA AND ANALYTICS
Big Data and Analytics
Name of the Student:
Name of the University:
Course ID:
Big Data and Analytics
Name of the Student:
Name of the University:
Course ID:
Paraphrase This Document
Need a fresh take? Get an instant paraphrase of this document with our AI Paraphraser
1BIG DATA AND ANALYTICS
Table of Contents
Background Information...............................................................................................1
Reporting / Dashboards................................................................................................1
Advanced Insights........................................................................................................2
Research.......................................................................................................................4
Recommendations for POLICE CHIEF........................................................................6
Cover letter...................................................................................................................7
The Reflection...............................................................................................................9
Reference...................................................................................................................10
Running Head: BIG DATA AND ANALYTICS
Background Information
Citizen Law Enforcement Analysis and Reporting (CLEAR) was an initiative
creative by Chicago police in order to keep a track on the crimes (Kieltyka, Kucybala
& Crandall, 2016). The initiative of the police has enabled the department to study
crime occurrences.
Reporting / Dashboards
In order to investigate crimes in Chicago dataset2 was used. The dataset of
crimes was retrieved from data.world (Data.world, 2018). The dataset contains
information of crimes in Chicago for the period of 2014 to 2017. In addition, data for
the year 2017 pertains to only the first year.
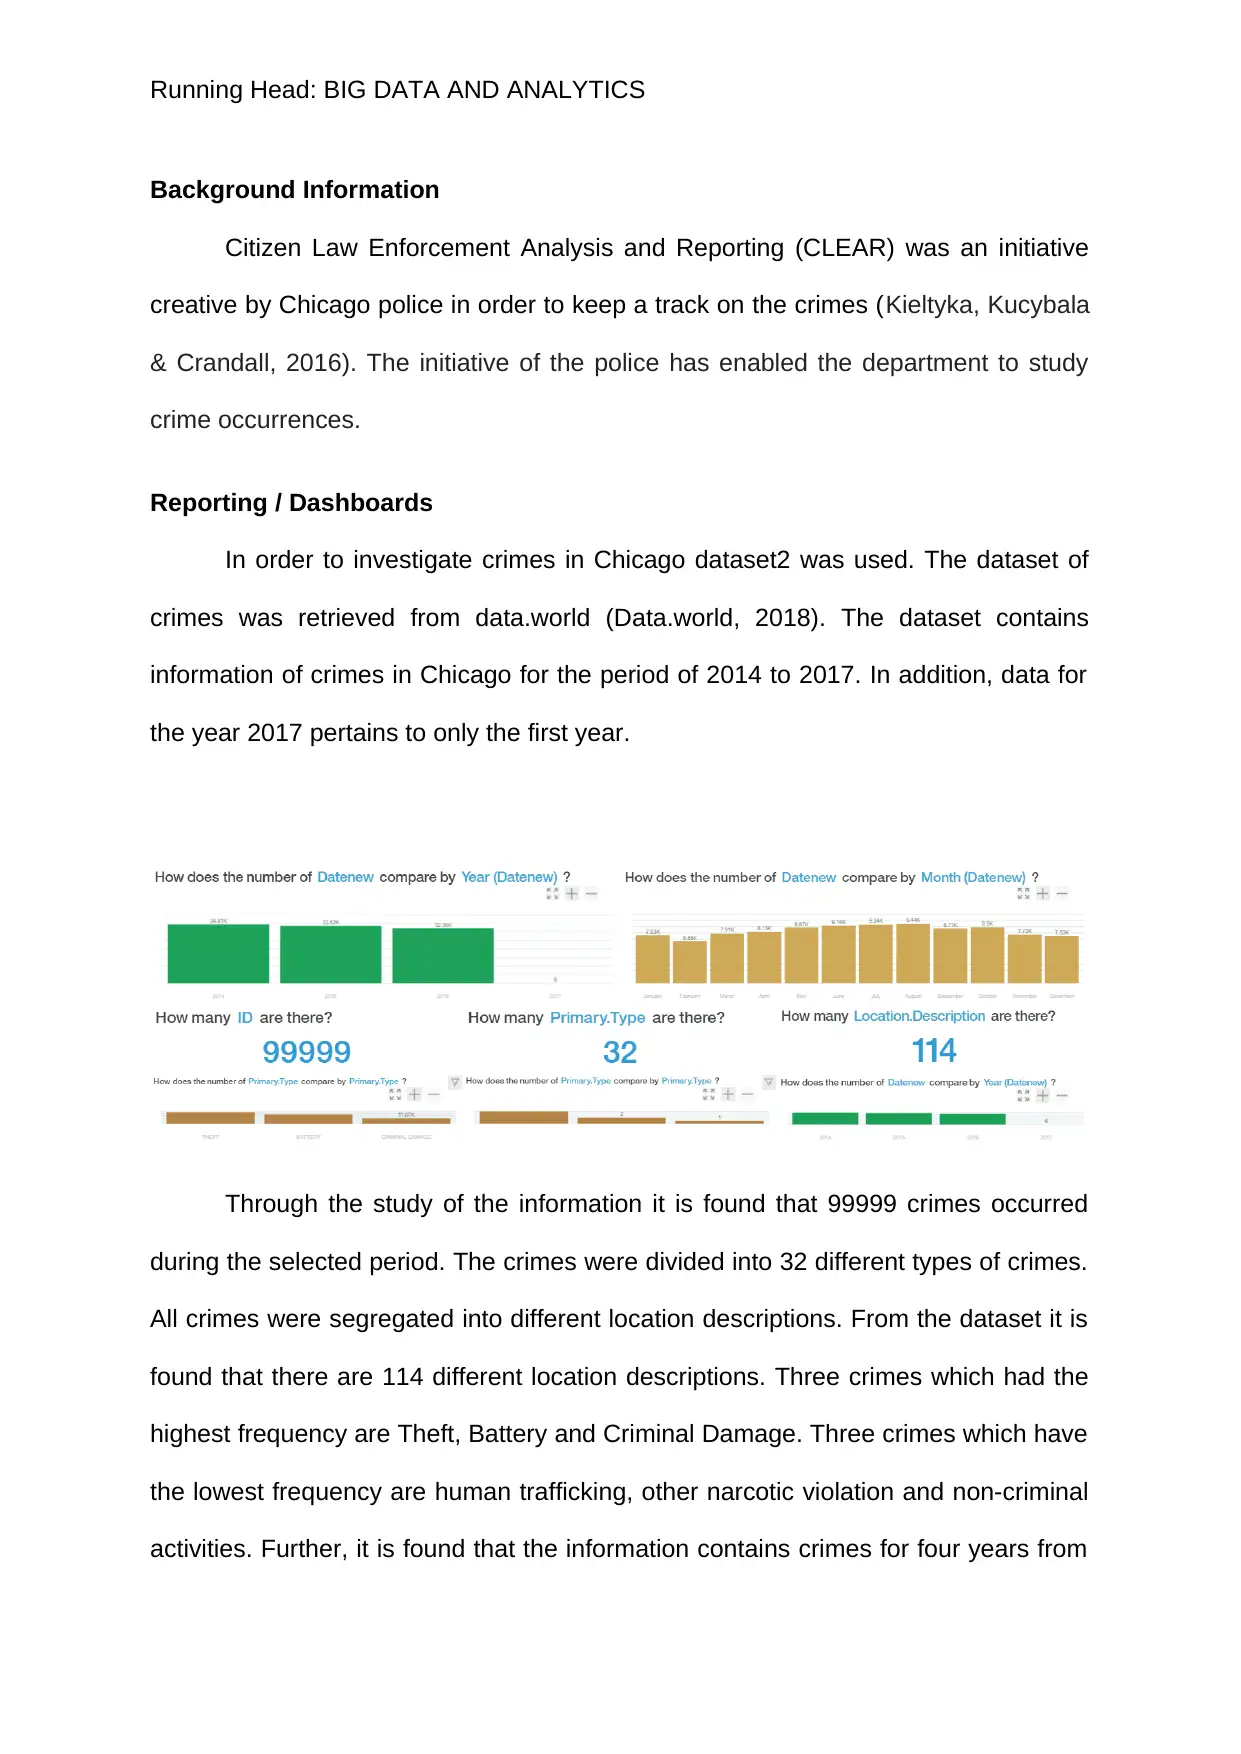
Through the study of the information it is found that 99999 crimes occurred
during the selected period. The crimes were divided into 32 different types of crimes.
All crimes were segregated into different location descriptions. From the dataset it is
found that there are 114 different location descriptions. Three crimes which had the
highest frequency are Theft, Battery and Criminal Damage. Three crimes which have
the lowest frequency are human trafficking, other narcotic violation and non-criminal
activities. Further, it is found that the information contains crimes for four years from
Background Information
Citizen Law Enforcement Analysis and Reporting (CLEAR) was an initiative
creative by Chicago police in order to keep a track on the crimes (Kieltyka, Kucybala
& Crandall, 2016). The initiative of the police has enabled the department to study
crime occurrences.
Reporting / Dashboards
In order to investigate crimes in Chicago dataset2 was used. The dataset of
crimes was retrieved from data.world (Data.world, 2018). The dataset contains
information of crimes in Chicago for the period of 2014 to 2017. In addition, data for
the year 2017 pertains to only the first year.
Through the study of the information it is found that 99999 crimes occurred
during the selected period. The crimes were divided into 32 different types of crimes.
All crimes were segregated into different location descriptions. From the dataset it is
found that there are 114 different location descriptions. Three crimes which had the
highest frequency are Theft, Battery and Criminal Damage. Three crimes which have
the lowest frequency are human trafficking, other narcotic violation and non-criminal
activities. Further, it is found that the information contains crimes for four years from
⊘ This is a preview!⊘
Do you want full access?
Subscribe today to unlock all pages.
Trusted by 1+ million students worldwide
2BIG DATA AND ANALYTICS
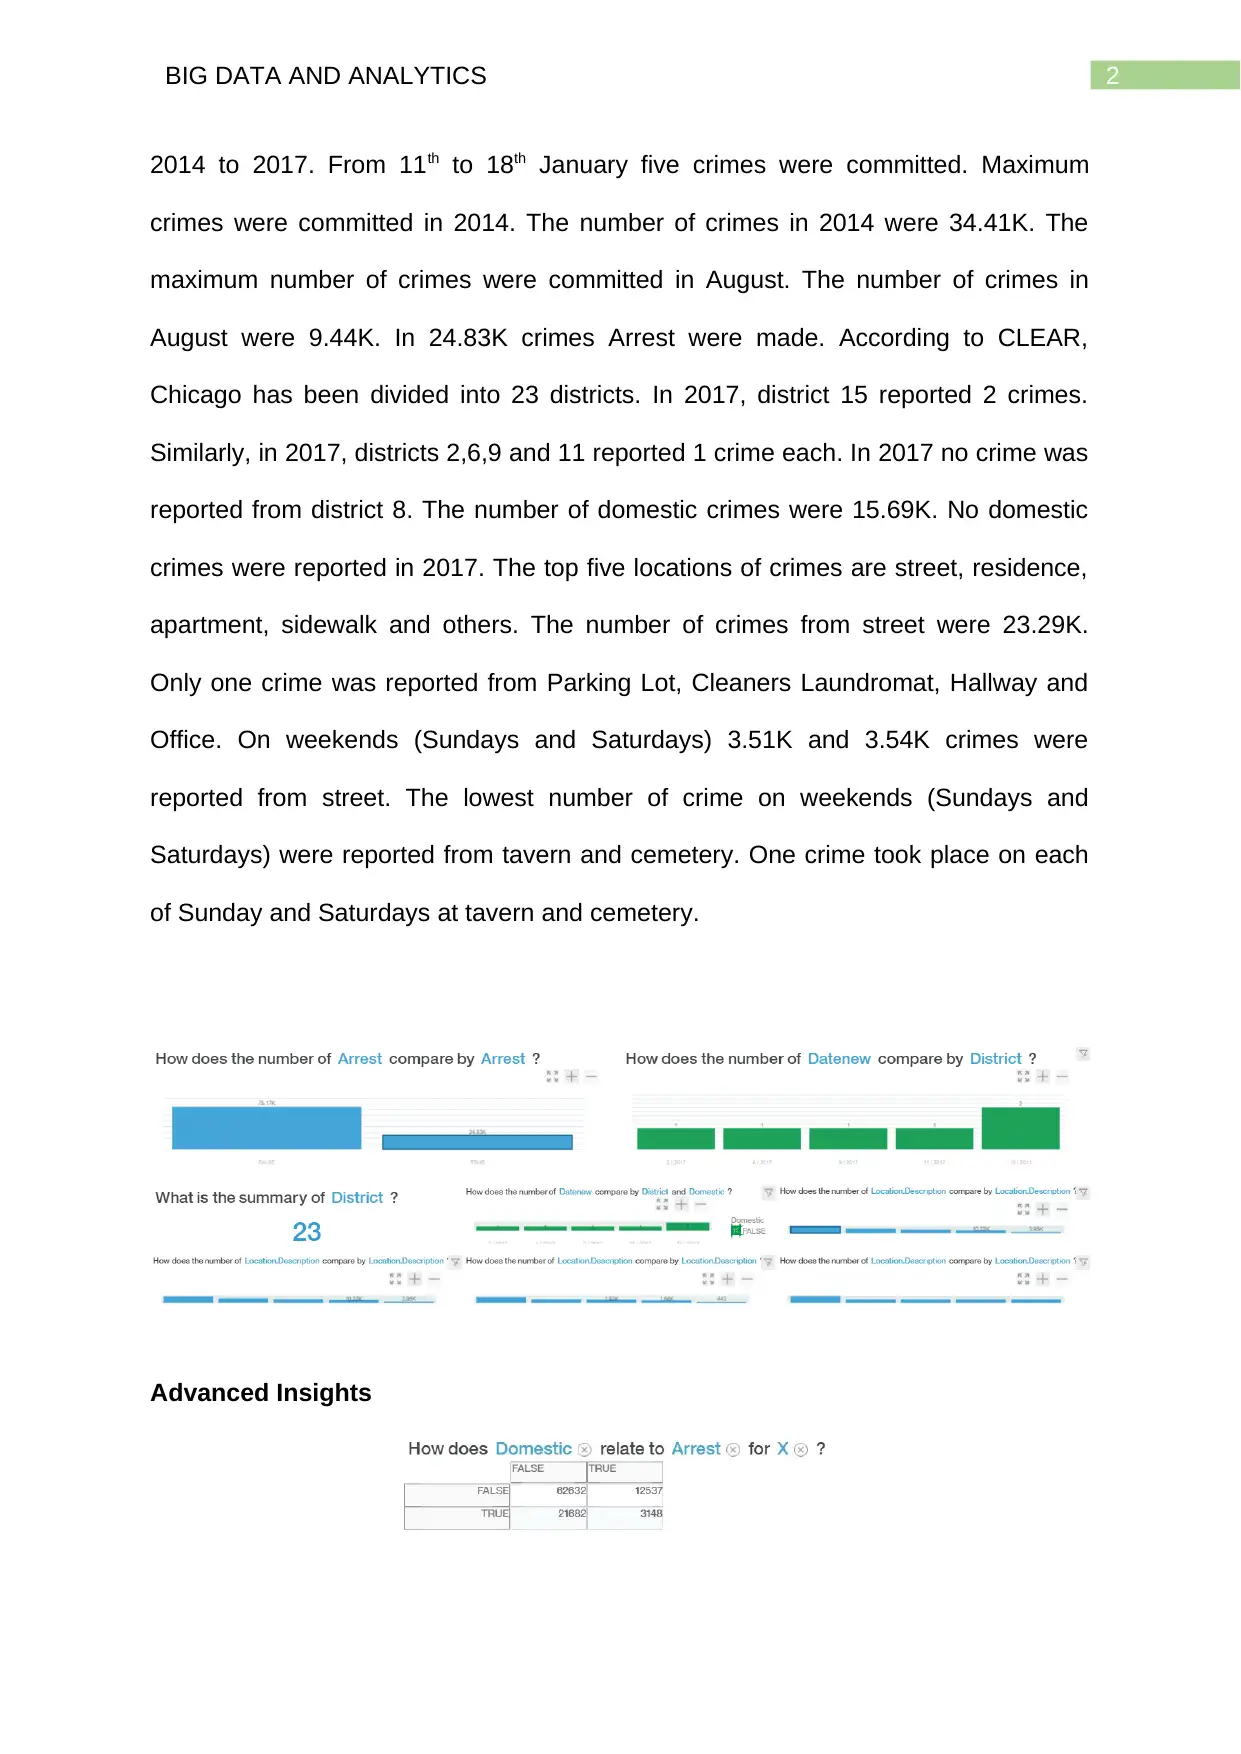
2014 to 2017. From 11th to 18th January five crimes were committed. Maximum
crimes were committed in 2014. The number of crimes in 2014 were 34.41K. The
maximum number of crimes were committed in August. The number of crimes in
August were 9.44K. In 24.83K crimes Arrest were made. According to CLEAR,
Chicago has been divided into 23 districts. In 2017, district 15 reported 2 crimes.
Similarly, in 2017, districts 2,6,9 and 11 reported 1 crime each. In 2017 no crime was
reported from district 8. The number of domestic crimes were 15.69K. No domestic
crimes were reported in 2017. The top five locations of crimes are street, residence,
apartment, sidewalk and others. The number of crimes from street were 23.29K.
Only one crime was reported from Parking Lot, Cleaners Laundromat, Hallway and
Office. On weekends (Sundays and Saturdays) 3.51K and 3.54K crimes were
reported from street. The lowest number of crime on weekends (Sundays and
Saturdays) were reported from tavern and cemetery. One crime took place on each
of Sunday and Saturdays at tavern and cemetery.
Advanced Insights
Paraphrase This Document
Need a fresh take? Get an instant paraphrase of this document with our AI Paraphraser
3BIG DATA AND ANALYTICS
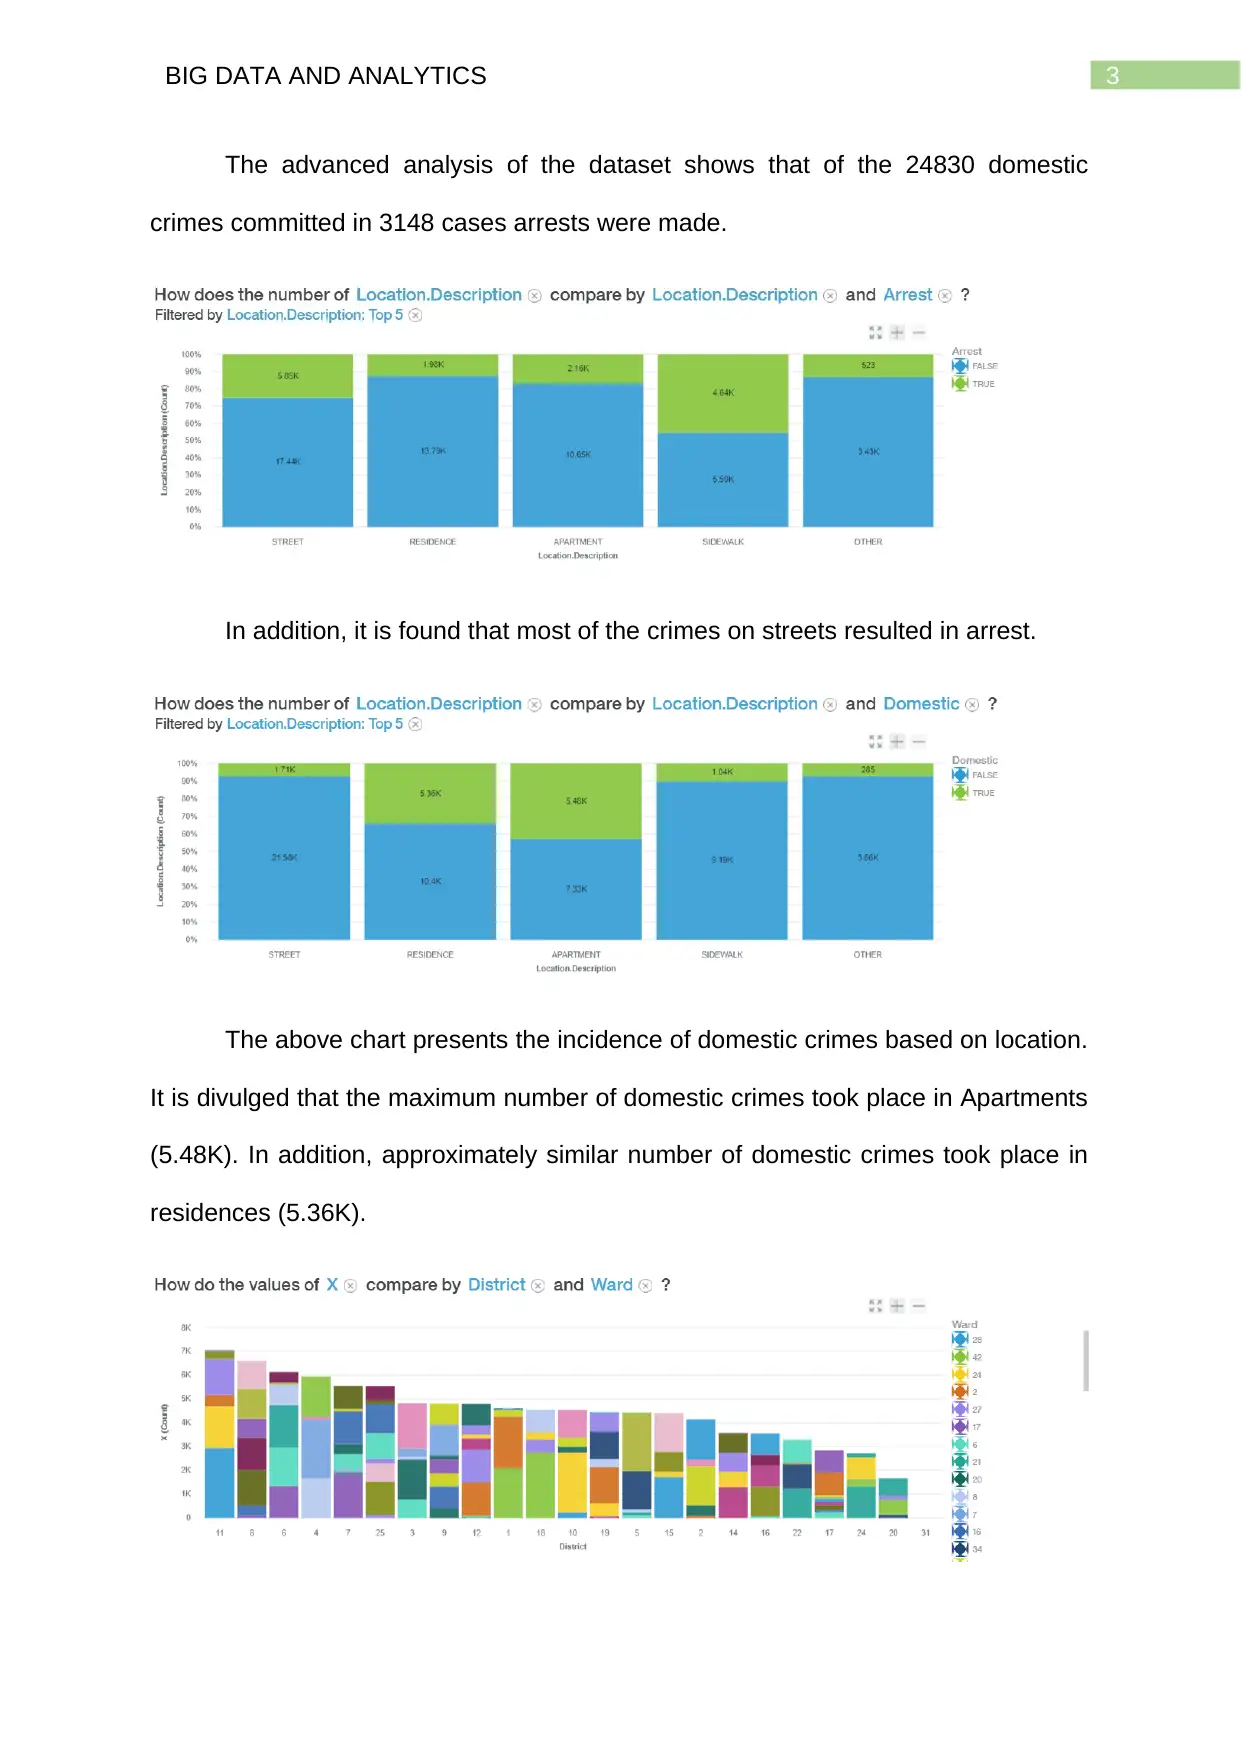
The advanced analysis of the dataset shows that of the 24830 domestic
crimes committed in 3148 cases arrests were made.
In addition, it is found that most of the crimes on streets resulted in arrest.
The above chart presents the incidence of domestic crimes based on location.
It is divulged that the maximum number of domestic crimes took place in Apartments
(5.48K). In addition, approximately similar number of domestic crimes took place in
residences (5.36K).
4BIG DATA AND ANALYTICS
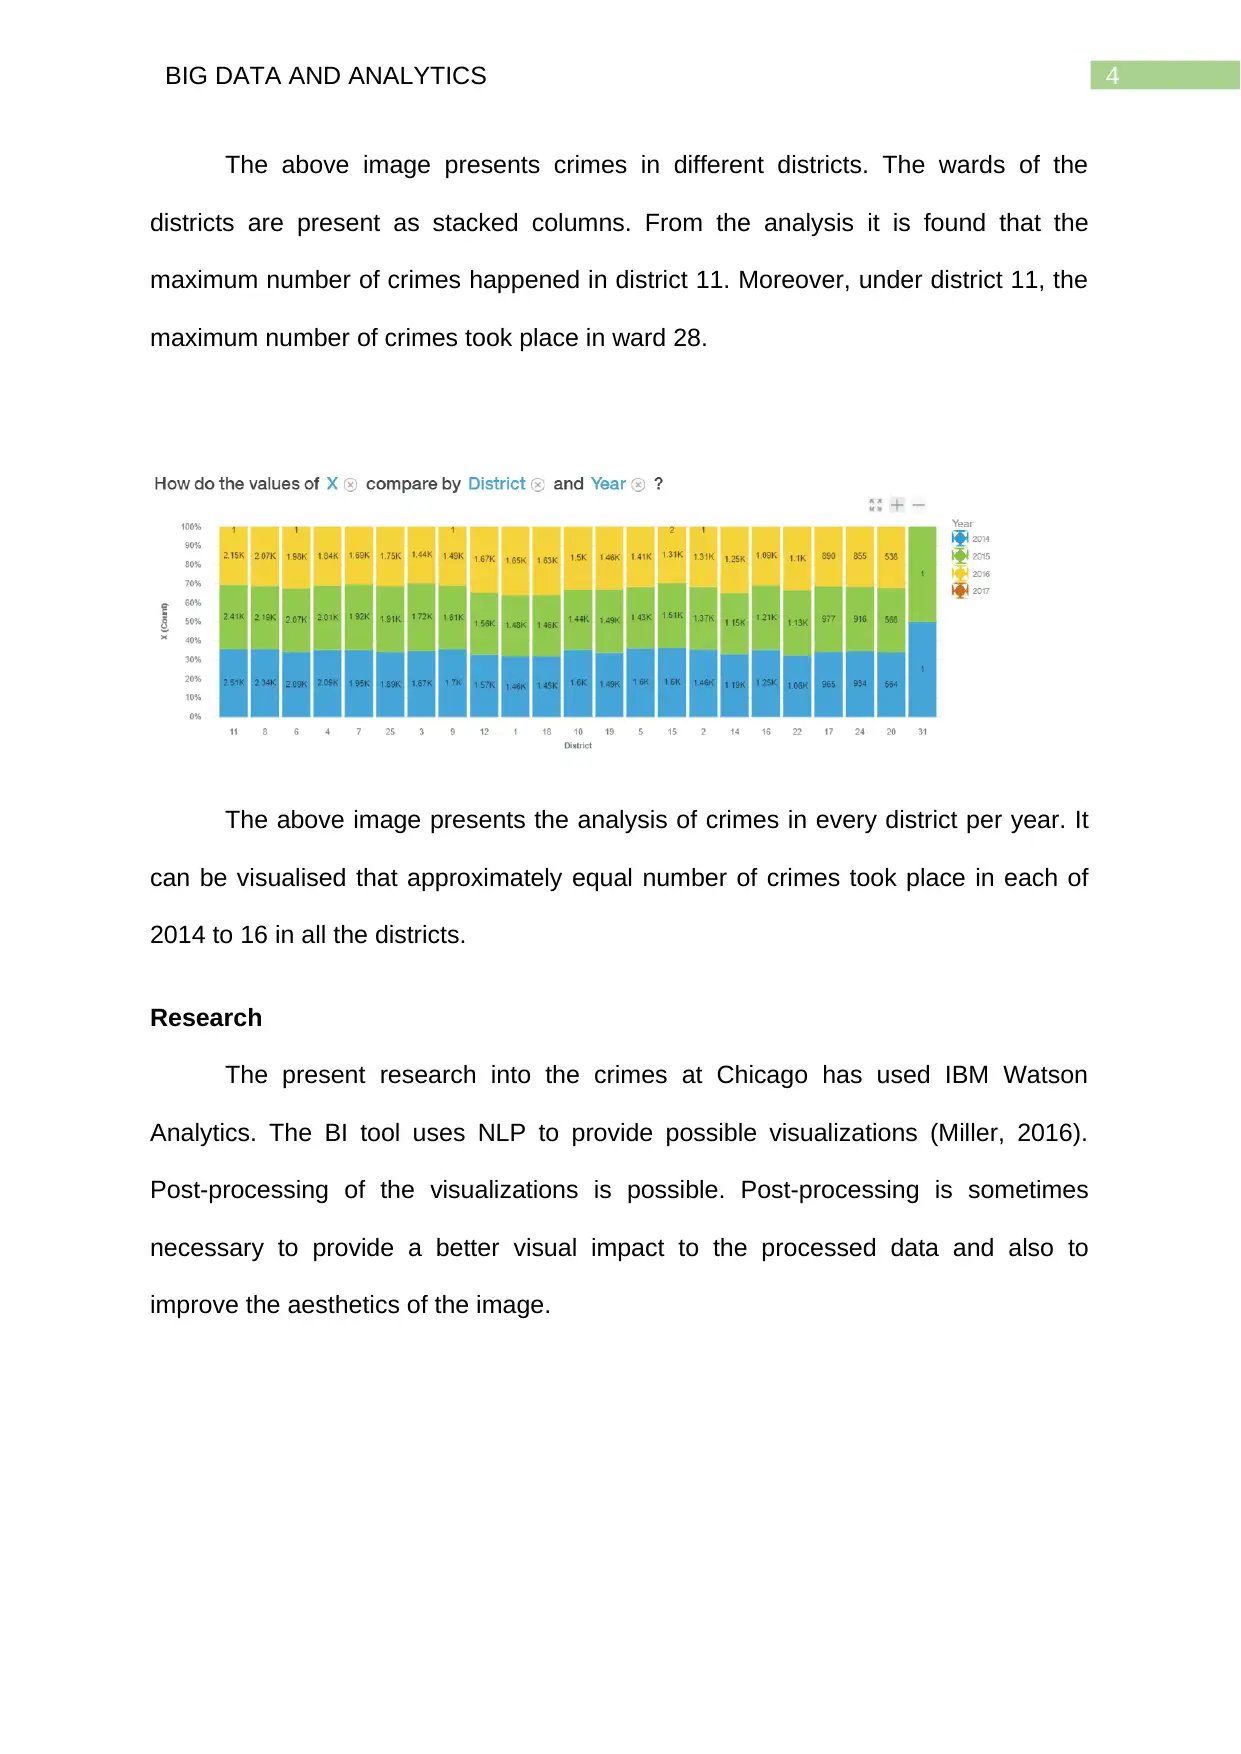
The above image presents crimes in different districts. The wards of the
districts are present as stacked columns. From the analysis it is found that the
maximum number of crimes happened in district 11. Moreover, under district 11, the
maximum number of crimes took place in ward 28.
The above image presents the analysis of crimes in every district per year. It
can be visualised that approximately equal number of crimes took place in each of
2014 to 16 in all the districts.
Research
The present research into the crimes at Chicago has used IBM Watson
Analytics. The BI tool uses NLP to provide possible visualizations (Miller, 2016).
Post-processing of the visualizations is possible. Post-processing is sometimes
necessary to provide a better visual impact to the processed data and also to
improve the aesthetics of the image.
⊘ This is a preview!⊘
Do you want full access?
Subscribe today to unlock all pages.
Trusted by 1+ million students worldwide
5BIG DATA AND ANALYTICS
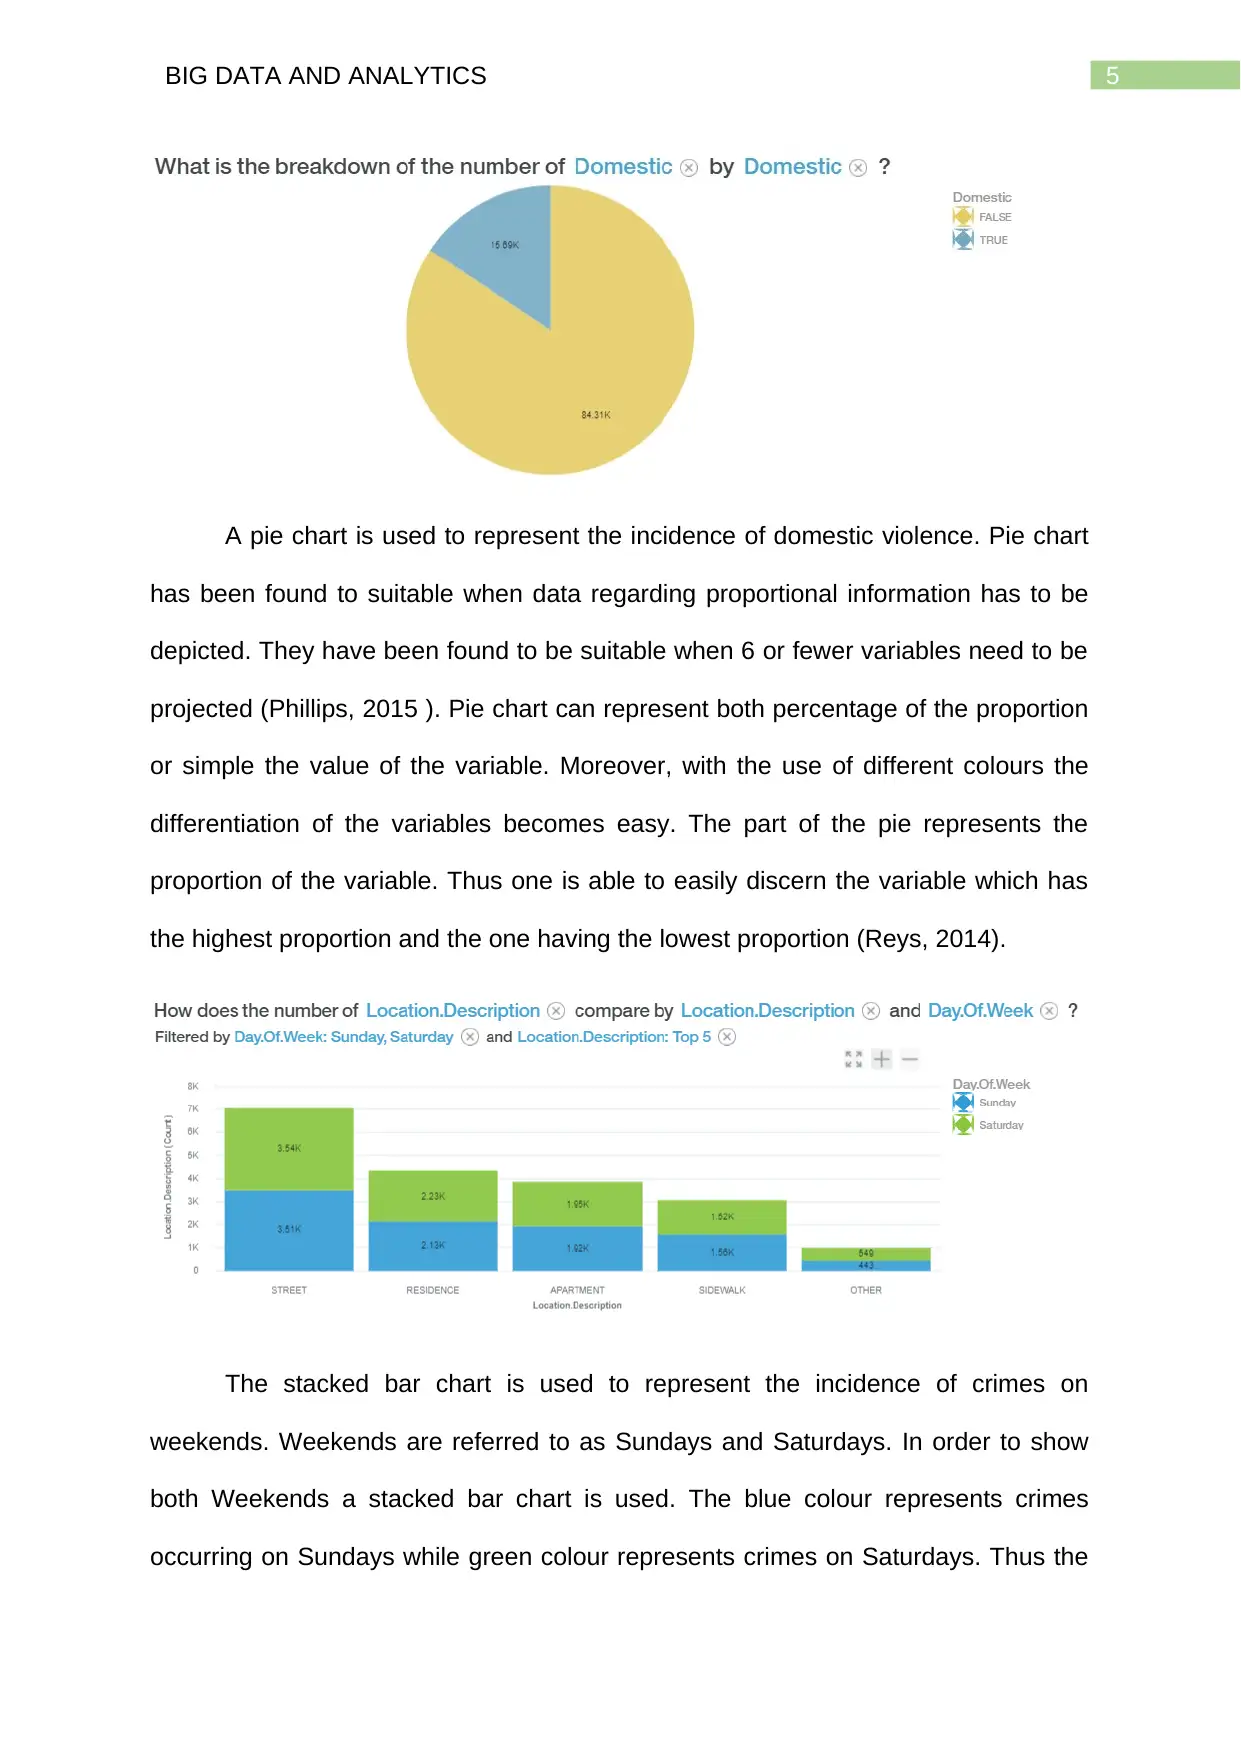
A pie chart is used to represent the incidence of domestic violence. Pie chart
has been found to suitable when data regarding proportional information has to be
depicted. They have been found to be suitable when 6 or fewer variables need to be
projected (Phillips, 2015 ). Pie chart can represent both percentage of the proportion
or simple the value of the variable. Moreover, with the use of different colours the
differentiation of the variables becomes easy. The part of the pie represents the
proportion of the variable. Thus one is able to easily discern the variable which has
the highest proportion and the one having the lowest proportion (Reys, 2014).
The stacked bar chart is used to represent the incidence of crimes on
weekends. Weekends are referred to as Sundays and Saturdays. In order to show
both Weekends a stacked bar chart is used. The blue colour represents crimes
occurring on Sundays while green colour represents crimes on Saturdays. Thus the
Paraphrase This Document
Need a fresh take? Get an instant paraphrase of this document with our AI Paraphraser
6BIG DATA AND ANALYTICS
stacked bar has been used to show individual number of crimes as part of whole
crimes on weekends (Vlamis & Vlamis, 2015). We could have transformed the
stacked bar chart into percentage proportions to show the percentage as part of
100% (Munzner, 2014).
Recommendations for POLICE CHIEF
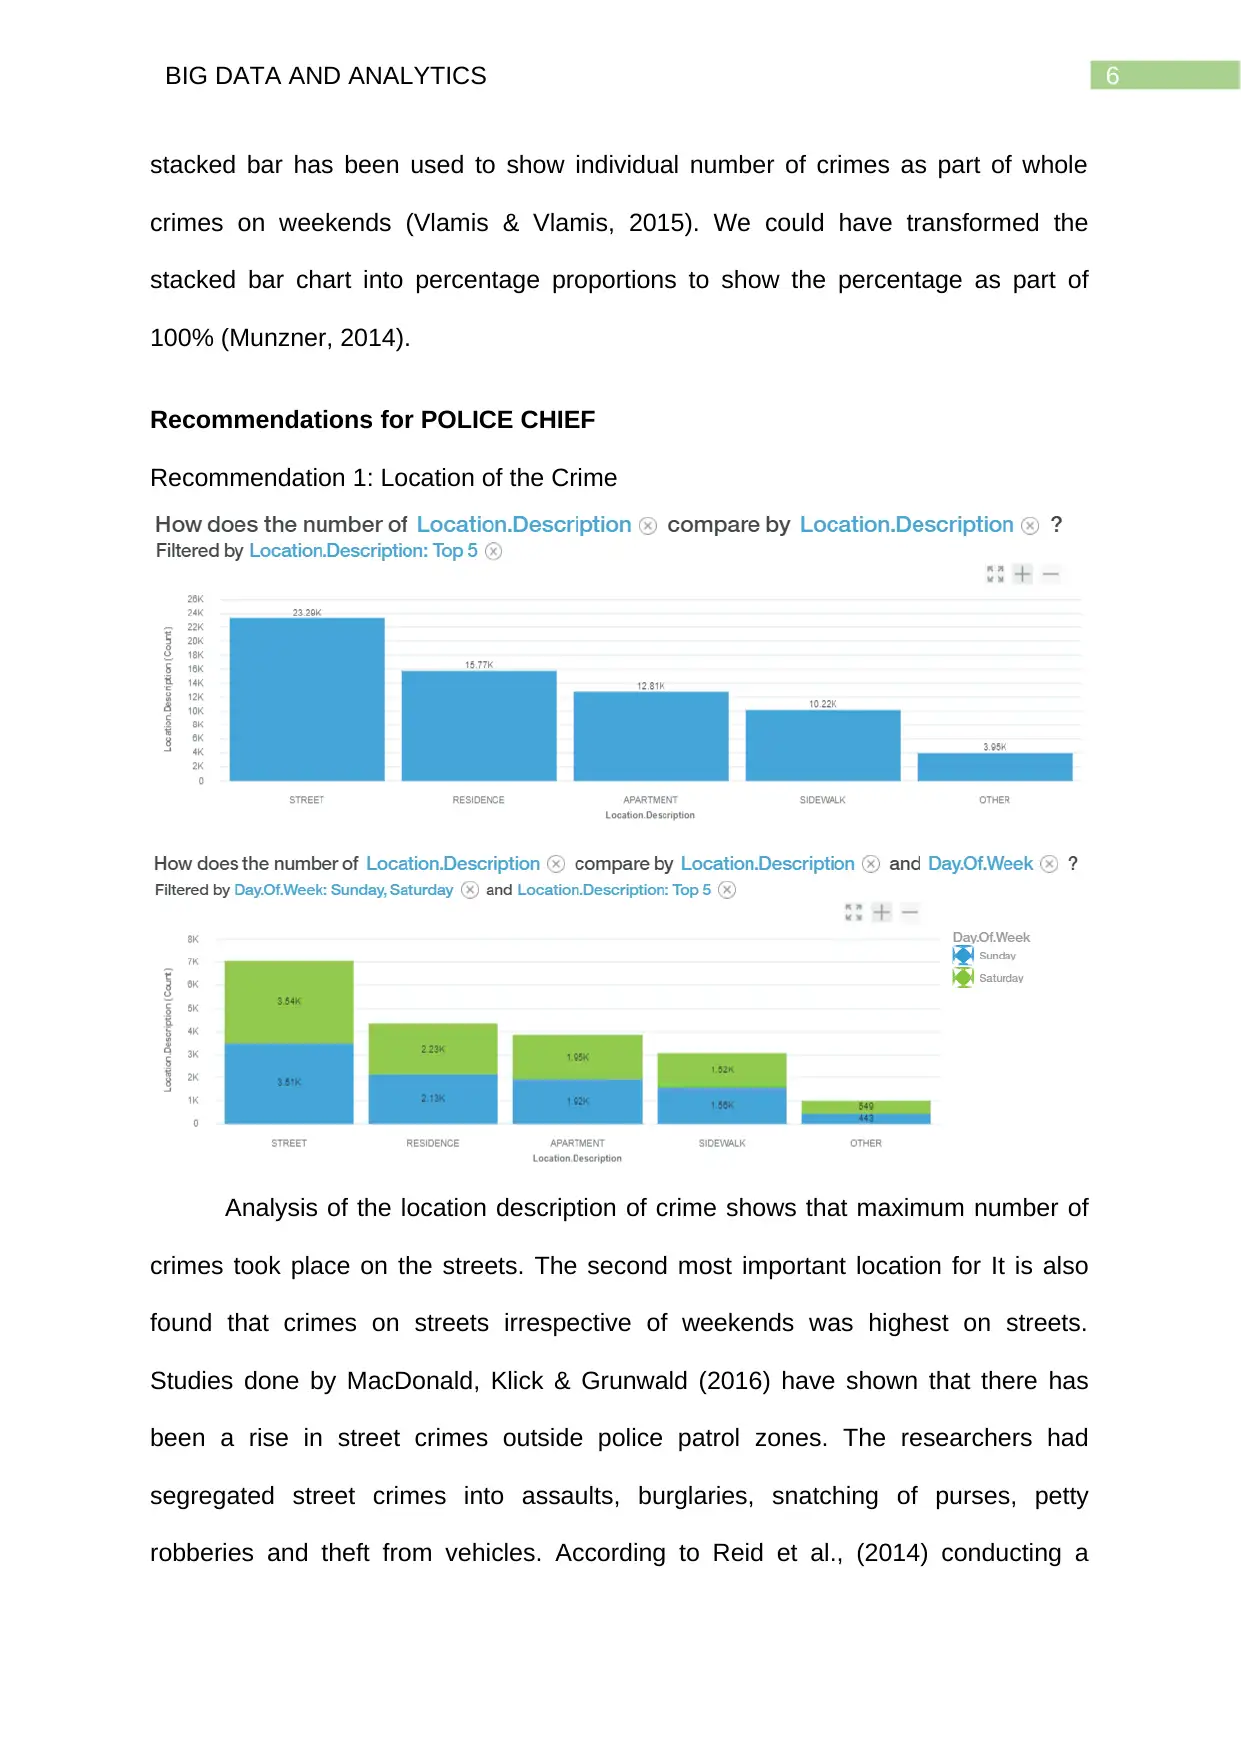
Recommendation 1: Location of the Crime
Analysis of the location description of crime shows that maximum number of
crimes took place on the streets. The second most important location for It is also
found that crimes on streets irrespective of weekends was highest on streets.
Studies done by MacDonald, Klick & Grunwald (2016) have shown that there has
been a rise in street crimes outside police patrol zones. The researchers had
segregated street crimes into assaults, burglaries, snatching of purses, petty
robberies and theft from vehicles. According to Reid et al., (2014) conducting a
stacked bar has been used to show individual number of crimes as part of whole
crimes on weekends (Vlamis & Vlamis, 2015). We could have transformed the
stacked bar chart into percentage proportions to show the percentage as part of
100% (Munzner, 2014).
Recommendations for POLICE CHIEF
Recommendation 1: Location of the Crime
Analysis of the location description of crime shows that maximum number of
crimes took place on the streets. The second most important location for It is also
found that crimes on streets irrespective of weekends was highest on streets.
Studies done by MacDonald, Klick & Grunwald (2016) have shown that there has
been a rise in street crimes outside police patrol zones. The researchers had
segregated street crimes into assaults, burglaries, snatching of purses, petty
robberies and theft from vehicles. According to Reid et al., (2014) conducting a
7BIG DATA AND ANALYTICS
spatial pattern of crimes occurring in the city would show that street is most
vulnerable for crimes. Thus it can be suggested that Chicago police should patrol
streets more often. This could reduce the incidence of street crimes at Chicago.
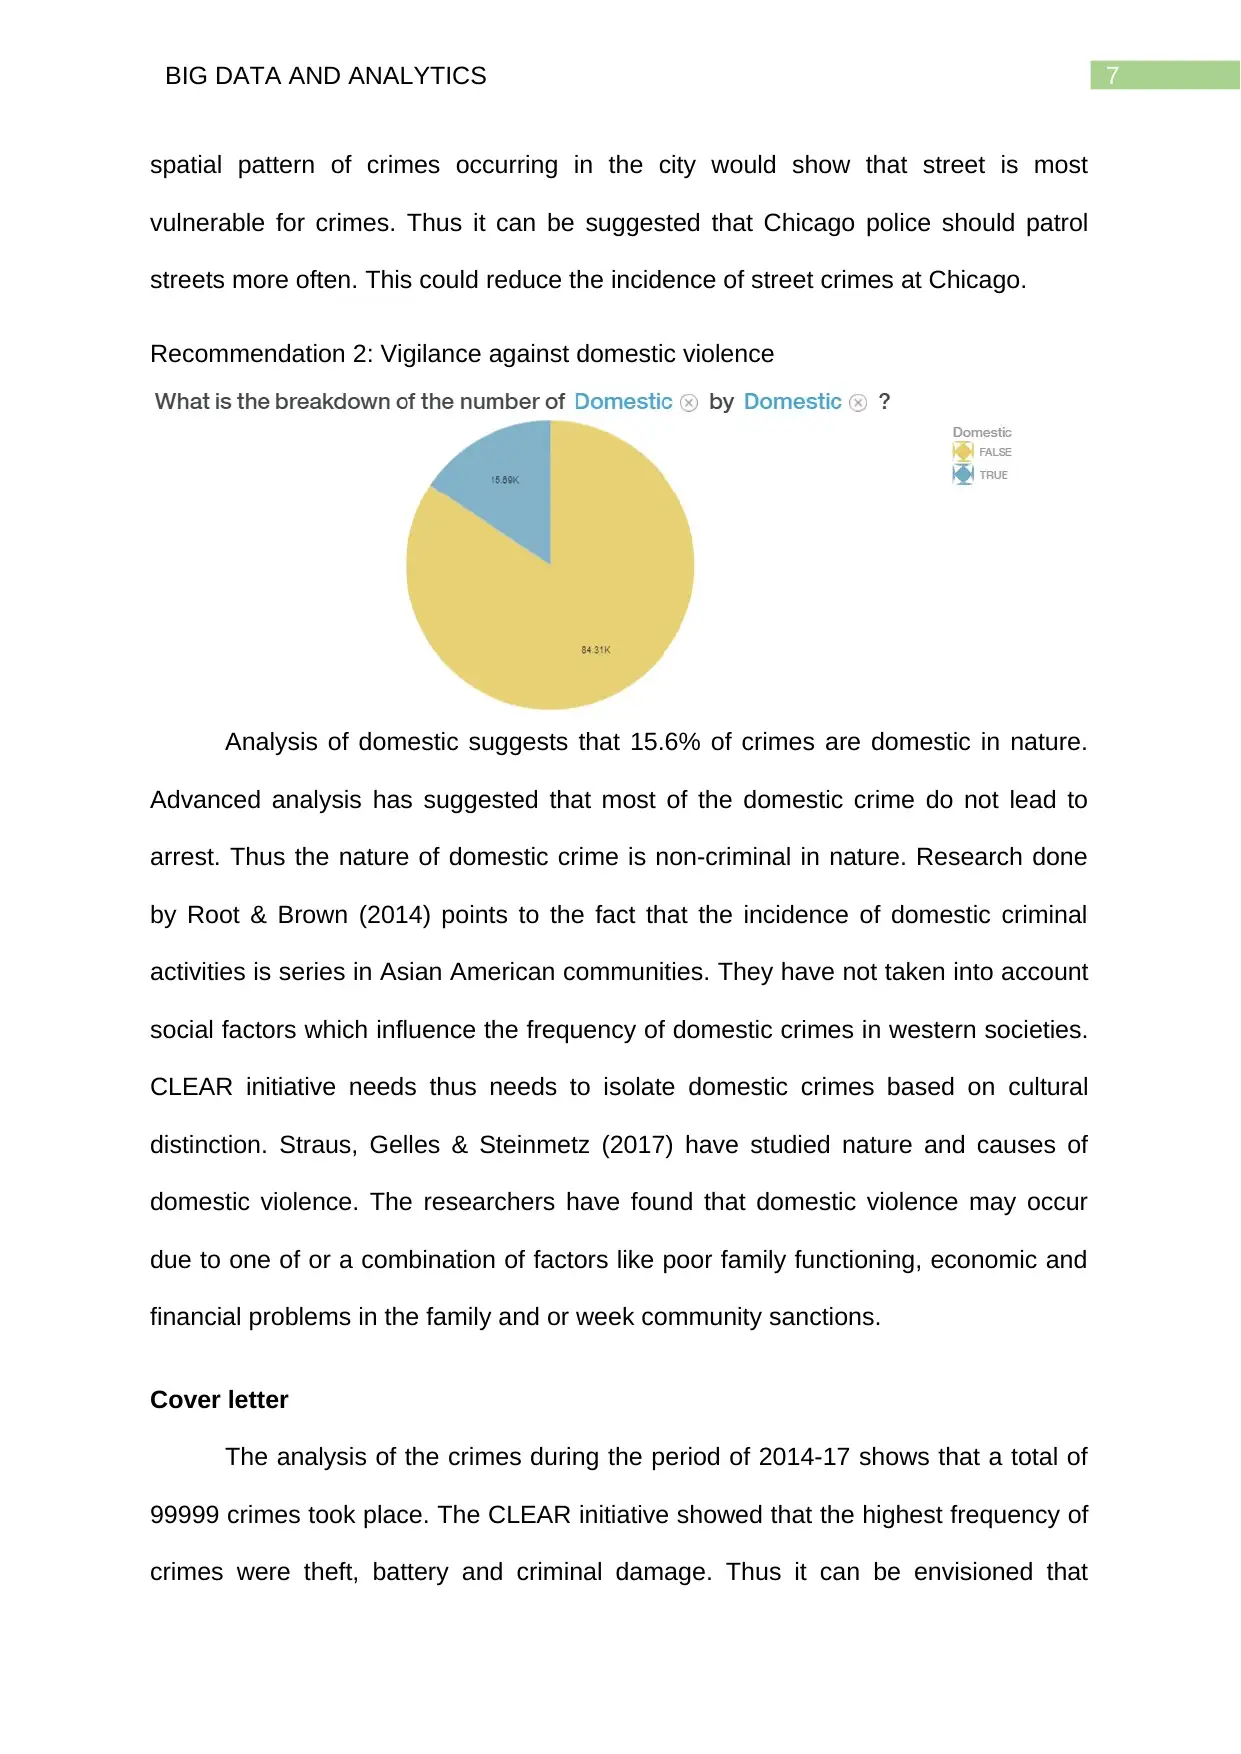
Recommendation 2: Vigilance against domestic violence
Analysis of domestic suggests that 15.6% of crimes are domestic in nature.
Advanced analysis has suggested that most of the domestic crime do not lead to
arrest. Thus the nature of domestic crime is non-criminal in nature. Research done
by Root & Brown (2014) points to the fact that the incidence of domestic criminal
activities is series in Asian American communities. They have not taken into account
social factors which influence the frequency of domestic crimes in western societies.
CLEAR initiative needs thus needs to isolate domestic crimes based on cultural
distinction. Straus, Gelles & Steinmetz (2017) have studied nature and causes of
domestic violence. The researchers have found that domestic violence may occur
due to one of or a combination of factors like poor family functioning, economic and
financial problems in the family and or week community sanctions.
Cover letter
The analysis of the crimes during the period of 2014-17 shows that a total of
99999 crimes took place. The CLEAR initiative showed that the highest frequency of
crimes were theft, battery and criminal damage. Thus it can be envisioned that
spatial pattern of crimes occurring in the city would show that street is most
vulnerable for crimes. Thus it can be suggested that Chicago police should patrol
streets more often. This could reduce the incidence of street crimes at Chicago.
Recommendation 2: Vigilance against domestic violence
Analysis of domestic suggests that 15.6% of crimes are domestic in nature.
Advanced analysis has suggested that most of the domestic crime do not lead to
arrest. Thus the nature of domestic crime is non-criminal in nature. Research done
by Root & Brown (2014) points to the fact that the incidence of domestic criminal
activities is series in Asian American communities. They have not taken into account
social factors which influence the frequency of domestic crimes in western societies.
CLEAR initiative needs thus needs to isolate domestic crimes based on cultural
distinction. Straus, Gelles & Steinmetz (2017) have studied nature and causes of
domestic violence. The researchers have found that domestic violence may occur
due to one of or a combination of factors like poor family functioning, economic and
financial problems in the family and or week community sanctions.
Cover letter
The analysis of the crimes during the period of 2014-17 shows that a total of
99999 crimes took place. The CLEAR initiative showed that the highest frequency of
crimes were theft, battery and criminal damage. Thus it can be envisioned that
⊘ This is a preview!⊘
Do you want full access?
Subscribe today to unlock all pages.
Trusted by 1+ million students worldwide
8BIG DATA AND ANALYTICS
Chicago police should concentrate most on theft and battery crimes. The analysis
showed that the incidence of crime has decreased from 2014 to 16. Thus it suggests
that CLEAR initiative of Chicago police is showing results. There has been a
decrease in incidence of crimes.
Moreover, it is found that the highest incidence of crimes takes place in the
months of July and August. the incidence of crimes increases from February and
peaks in August. it then reduces till February. Thus it is found that there is a cyclic
pattern in crimes at Chicago.
The analysis of the data elucidates that the incidence of domestic crimes is
only 15.6%. Moreover, the advanced analysis has shown that arrests in domestic
crimes is low. Further research needs to be carried out to investigate the cultural
background of crimes. This is more relevant since research has shown that domestic
crimes change with cultural background of the person (Montoya & Rolandsen
Agustín, 2013).
We found that on weekends also the incidence of crimes on streets does not
reduce. In fact, frequency of crimes on weekends on streets, residences, apartments
and sidewalks are similar for both the days. CLEAR program should look into the
occurrences of crimes on weekends. Further research needs to be done to extract
information on crimes on weekends and weekdays. Further research would provide
into cultural, financial background of people committing crimes. This would help
CLEAR program to provide rehabilitation services since most of the population of
America prefers rehabilitation to a certain extent (Santana et al., 2013).
Paraphrase This Document
Need a fresh take? Get an instant paraphrase of this document with our AI Paraphraser
9BIG DATA AND ANALYTICS
The Reflection
This was really an exhilarating experience to use an online business
intelligence tool. The natural language processing (NLP) used by IBM Watson
Analytics was a new experience (Hoyt et al., 2014). The online tool uses NLP
through which suitable questions only needs to be asked. It was a challenge to find
the suitable questions (Zhu et al., 2014). However, since the assignment had already
provided a set of questions hence the wording of the questions was the only difficult
job. Once the questions were asked the BI tool immediately provided a set of
suitable visualizations. From the many probable visualisations the one which was
most suitable had to be selected. The use of the BI tool was a beautiful experience.
We could change the colour of the bars. We could also input the data on the bars.
Moreover, we could use stacked bar charts also.
10BIG DATA AND ANALYTICS
Reference
Data.world. (2018). Data.world. Retrieved from https://data.world/mchadhar/dataset-
2-chicago-crime
Hoyt, R. E., Snider, D., Thompson, C., & Mantravadi, S. (2016). IBM Watson
analytics: automating visualization, descriptive, and predictive statistics. JMIR
public health and surveillance, 2(2).
Kieltyka, J., Kucybala, K., & Crandall, M. (2016). Ecologic factors relating to firearm
injuries and gun violence in Chicago. Journal of forensic and legal medicine,
37, 87-90.
MacDonald, J. M., Klick, J., & Grunwald, B. (2016). The effect of private police on
crime: evidence from a geographic regression discontinuity design. Journal of
the Royal Statistical Society: Series A (Statistics in Society), 179(3), 831-846.
Miller, J. D. (2016). Learning IBM Watson Analytics. Packt Publishing Ltd.
Montoya, C., & Rolandsen Agustín, L. (2013). The othering of domestic violence:
The EU and cultural framings of violence against women. Social Politics,
20(4), 534-557.
Munzner, T. (2014). Visualization analysis and design. AK Peters/CRC Press.
Phillips, M. (2015). TIBCO Spotfire–A Comprehensive Primer. Packt Publishing Ltd.
Reid, A. A., Frank, R., Iwanski, N., Dabbaghian, V., & Brantingham, P. (2014).
Uncovering the spatial patterning of crimes: A criminal movement model
(CriMM). Journal of research in crime and delinquency, 51(2), 230-255.
Reys, R. E., Lindquist, M., Lambdin, D. V., & Smith, N. L. (2014). Helping children
learn mathematics. John Wiley & Sons.
⊘ This is a preview!⊘
Do you want full access?
Subscribe today to unlock all pages.
Trusted by 1+ million students worldwide
1 out of 13
Related Documents


Your All-in-One AI-Powered Toolkit for Academic Success.
+13062052269
info@desklib.com
Available 24*7 on WhatsApp / Email
![[object Object]](/_next/static/media/star-bottom.7253800d.svg)
Unlock your academic potential
Copyright © 2020–2026 A2Z Services. All Rights Reserved. Developed and managed by ZUCOL.