ITECH7406: Air Pollution Analysis with Big Data & IBM Watson
VerifiedAdded on 2023/04/24
|22
|4193
|57
Project
AI Summary
This project report explores air pollution analysis using IBM Watson analytics on a provided dataset, focusing on air quality in different regions of the United States. It identifies key pollutants like Carbon Dioxide, Sulphur Dioxide, Nitrogen Dioxide, Carbon Monoxide, Particulate Matter, and Ozone, detailing their origins and impacts. The analysis uses dashboards to compare NO2 levels by state and year, revealing trends and AQI values. The report also examines SO2 and O3 levels, providing insights into air quality variations and predictions. The findings highlight pollution trends and the effectiveness of air quality control measures. Desklib offers a platform for students to access similar solved assignments and project reports.
Running head: BIG DATA ANALYSIS PROJECT ON AIR POLLUTION
Big data analysis Project on Air Pollution
Name of the Student
Name of the University
Authors note
Big data analysis Project on Air Pollution
Name of the Student
Name of the University
Authors note
Paraphrase This Document
Need a fresh take? Get an instant paraphrase of this document with our AI Paraphraser
1BIG DATA ANALYSIS PROJECT ON AIR POLLUTION
Abstract
A substance or the element present in the environment possess adverse impact on different
human beings and environment are known as air pollutant. This are mainly liquid droplets,
solid particles or unnecessary gases. Furthermore, they may be man-made or naturally
induced. Commonly it is seen that the primary pollutants have been generated from the
events like the volcanic eruption, CO coming out from the exhaust of motor vehicle exhaust
or SO2 that is been released from factories. The following report contributes to the
exploration of the air pollution using IBM Watson analytics on an available dataset. In
addition to that, the main reasons and impact of air pollution are also discussed in the
different section of this report
2BIG DATA ANALYSIS PROJECT ON AIR POLLUTION
Table of Contents
Introduction................................................................................................................................3
Problem statement......................................................................................................................3
Analysis......................................................................................................................................4
Data Description and Preparation..............................................................................................6
Dashboards.................................................................................................................................6
Impact of the Pollution.............................................................................................................14
Recommendation......................................................................................................................16
Conclusion................................................................................................................................19
Bibliography.............................................................................................................................20
⊘ This is a preview!⊘
Do you want full access?
Subscribe today to unlock all pages.
Trusted by 1+ million students worldwide
3BIG DATA ANALYSIS PROJECT ON AIR POLLUTION
Introduction
Air consist of breathable oxygen which is the most important factors for the
existence of life on earth and continuously supports life on Earth. With the industrial
revolution the fresh and pure air has been contaminated due to the excessive amount of
increase pollutants. The presence of any substance in the air over the natural concentration
level potentially impacts the effect.
Air pollution is mainly caused by the release of the harmful substances in atmosphere
by the use of the fossil fuel and emissions from the different industries. This released
substances becomes the reasons for diseases and even death. This pollution also harms
animals, food crops and in turn impacts to the food chain as well as other living organisms in
the environment. This has a hostile effect on our environment. For the urban areas root causes
of air pollution is traffic, industrial factories. As this releases substances/pollutants in air that
damages the ecosystem.
Excessive pollutants are one of the leading reasons for the death
throughout world as this causes stroke, lung cancer, and other
respiratory related diseases for the humans. In this data analysis
project the main objective is to explore air quality in the different
regions of the united states. For the analysis of the selected dataset,
the IBM Watson is used.
Problem statement
In this industrial age, air contamination/pollution cannot be wiped out totally,
however steps can be taken to diminish it. The administration has to created, and keeps on
creating, rules for air quality and statutes to limit discharges with an end goal to control air
Paraphrase This Document
Need a fresh take? Get an instant paraphrase of this document with our AI Paraphraser
4BIG DATA ANALYSIS PROJECT ON AIR POLLUTION
contamination. On a singular dimension, we can diminish our commitment to the
contamination issue via carpooling or utilizing open transportation. Also, purchasing vitality
proficient lights and machines or generally lessening our power use will diminish the
contaminations discharged in the generation of power, which makes most of modern air
contamination
In this project it is assumed that, if a thorough analysis of the selected dataset can be
carried out then, it is possible to identify patterns in the air pollution levels as well as
correlating factors that has been putting effect on Air Pollution in the overall nation.
Additionally, this part of this project has been intended to study the impact or trend in the
different days of the weeks, in different states, or the numerous pollutants as well as their
intensity in the air.
Analysis
For the selected dataset, the following are the pollutant elements that are used and
analysed in the analysis. Following are the details such as origin, impact of these pollutants
are provided.
Carbon Dioxide or CO2 - This element is considered as the most emitted air polluting
element. From the different analysis it is found that the amount of CO2 is increase every day
in the earth's atmosphere due to the deforestation as well as use of fossil fuel.
SO2 (Sulphur Dioxide) - This pollutant is mainly produced from the volcano eruptions
as well as from different manufacturing industrial processes. In addition to that, Coal as well
as petroleum/fuels contains sulphur compound in them and the combustion of this products
generates excessive amount of sulphur dioxide.
5BIG DATA ANALYSIS PROJECT ON AIR POLLUTION
Furthermore, oxidation of SO2 with the catalyst like NO2, different forms of H2SO4,
results in acid rain. For his is one of the causes for concern due to its adverse impacts on the
environment.
NO2 (Nitrogen Dioxide) – This pollutant is released from high temperature
combustion processes as well as due to the thunderstorms in storms by electric discharge. In
this case, this has been the most prominent kind of pollutant that has reddish-brown coloured
having a biting and sharp odour.
Carbon Monoxide or CO – This has been one of the colourless, toxin and odourless,
gas that contaminates the air. This is released due to the incomplete combustion of fuels like
coal, wood or natural gas, exhausted gas from the gases are considered as major source of this
monoxide.
Particulate Matter - Particulate matters (PM), atmospheric specific matter that has
been consisted of tiny liquid and solid particle that is suspended in the gas.
Some particulates naturally remain in the air due to the volcanic eruptions, dust
storms, wild and forest fires along with living vegetation and sea spray. Because of the fact
human activities has been like fuel o burning fossils, combustion at power plants as well as
various industrial processes are also responsible for generating significant amounts of
particles. The average value of anthropogenic aerosols due to human activities accounts. This
has been for about ten percent of the overall environment. The rise in levels of the pollutant
particles within the air has been leading various issues like health such as lung cancer, heart
disease and so on.
Ozone – ozone is a key gas for the troposphere. On the other hand, the Ground level
O3 is created from VOCs and NOx. Further, there is also element of particular regions of the
⊘ This is a preview!⊘
Do you want full access?
Subscribe today to unlock all pages.
Trusted by 1+ million students worldwide
6BIG DATA ANALYSIS PROJECT ON AIR POLLUTION
stratosphere that has been also known as the ozone layer. With the abnormal and high
concentrations due to the use of the CFC and combustion of fossil fuel and creates smog.
Other greenhouse Gases-Methane is one of the worst effective type of greenhouse gas
that has been found to be giving rise to global warming. Different kinds of hydrocarbons such
as VOC has also been regarded as the vital greenhouse gas. The reason is that these gases are
responsible for creating ozone gas in the lower atmosphere sections and prolonging the
methane in the lower sections of atmosphere.
Data Description and Preparation
The following are the column names that are recorded in the dataset. These are listed
below;
The State Code has been found to be allocated by the US EPA. This also involves the
County code of counties, Site Number that are been allocated by the US EPA, addressing of
the monitoring of site, State details, County of the monitoring site, City, various Local Date,
steps of four kinds of pollutants. These are O3, SO2, O3, NO2 measurements for NO2,
measurements for NO2, and different types of arithmetic mean of concentration of NO2. This
is for a particular day, measured as per air quality index. Besides, it has also included the
NO2 first Max Value that is retrieved for NO2 concentration for a given day, NO2 max Hour
for the highest value in a hour.
Dashboards
The edited dataset includes 4 years of data in it. Following dash board displaying the
same.
Paraphrase This Document
Need a fresh take? Get an instant paraphrase of this document with our AI Paraphraser
7BIG DATA ANALYSIS PROJECT ON AIR POLLUTION
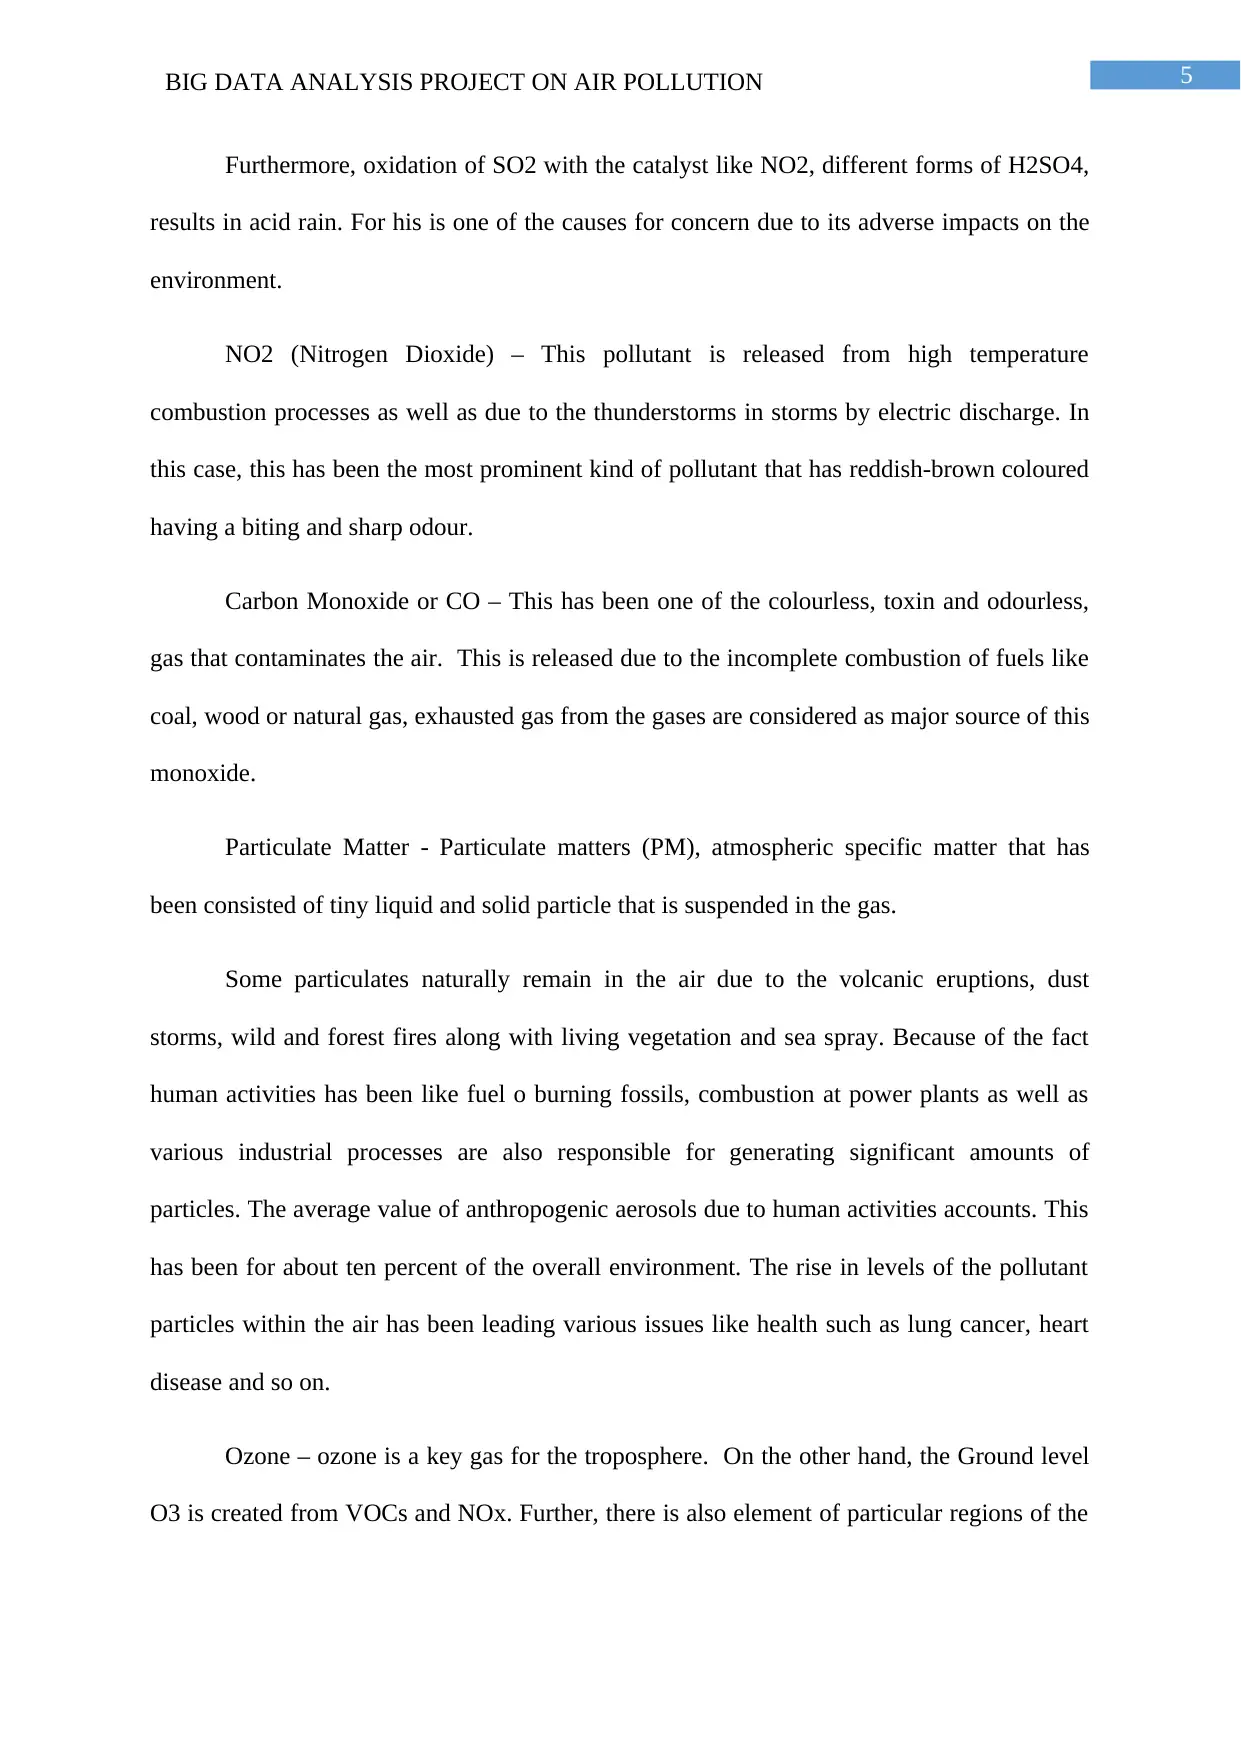
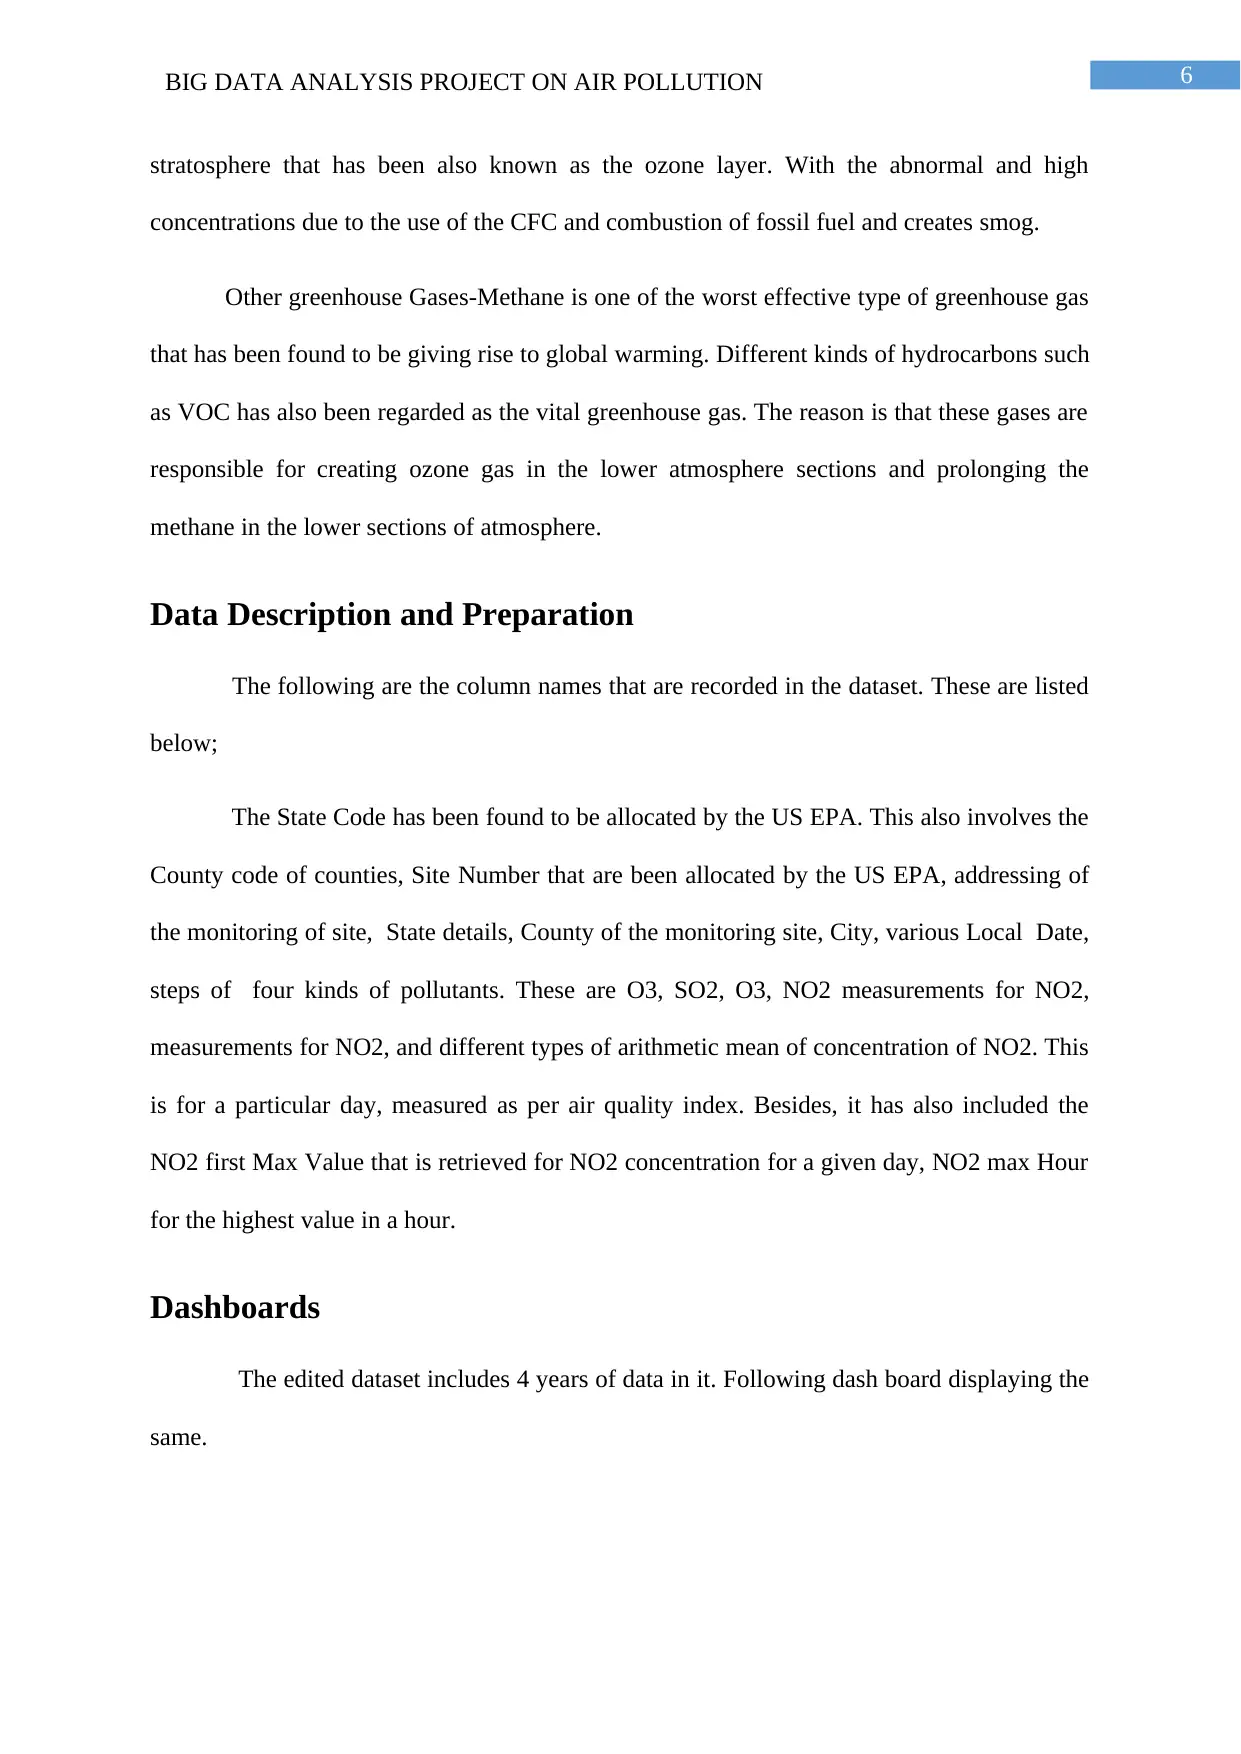
In the following dashboard, the NO2 max value is compared by states in order to find
out the recorded maximum NO2 in the states.
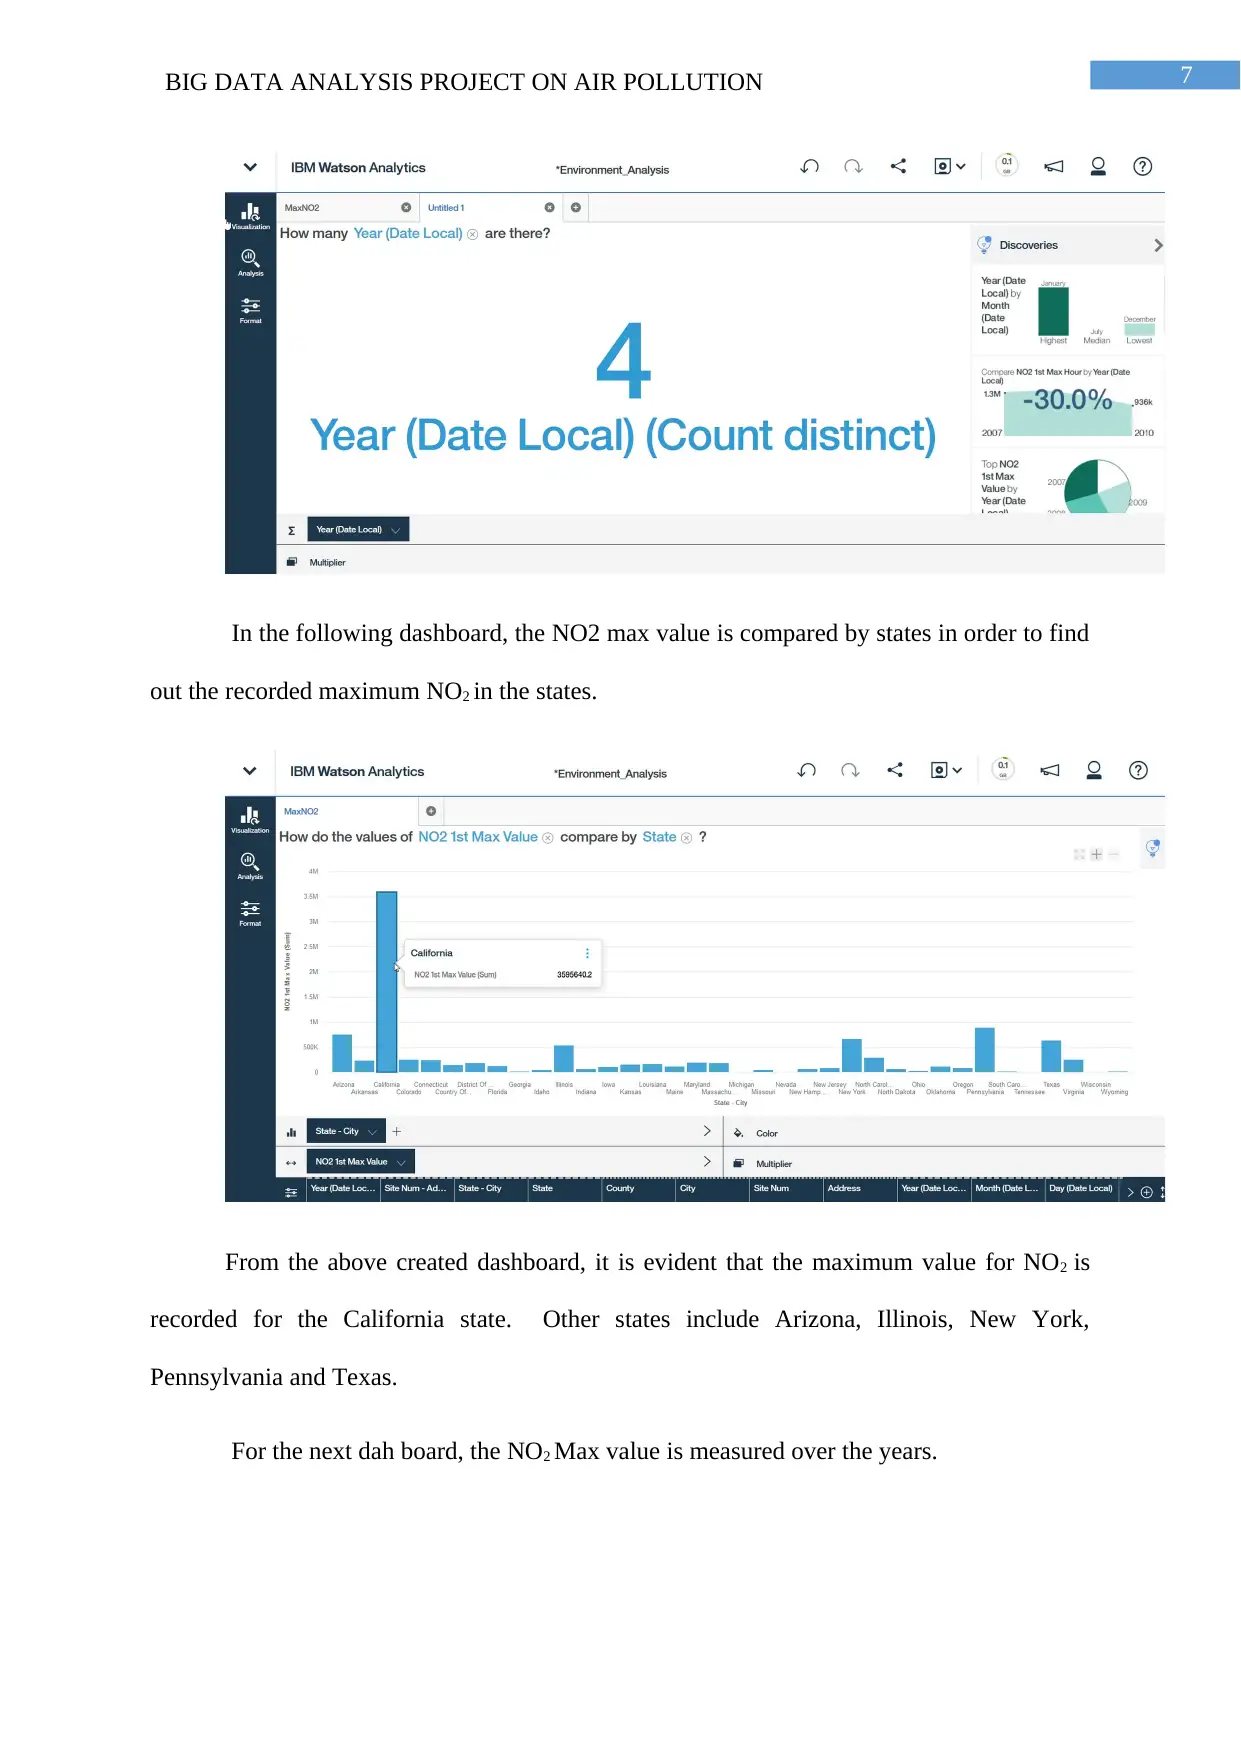
From the above created dashboard, it is evident that the maximum value for NO2 is
recorded for the California state. Other states include Arizona, Illinois, New York,
Pennsylvania and Texas.
For the next dah board, the NO2 Max value is measured over the years.
In the following dashboard, the NO2 max value is compared by states in order to find
out the recorded maximum NO2 in the states.
From the above created dashboard, it is evident that the maximum value for NO2 is
recorded for the California state. Other states include Arizona, Illinois, New York,
Pennsylvania and Texas.
For the next dah board, the NO2 Max value is measured over the years.
8BIG DATA ANALYSIS PROJECT ON AIR POLLUTION
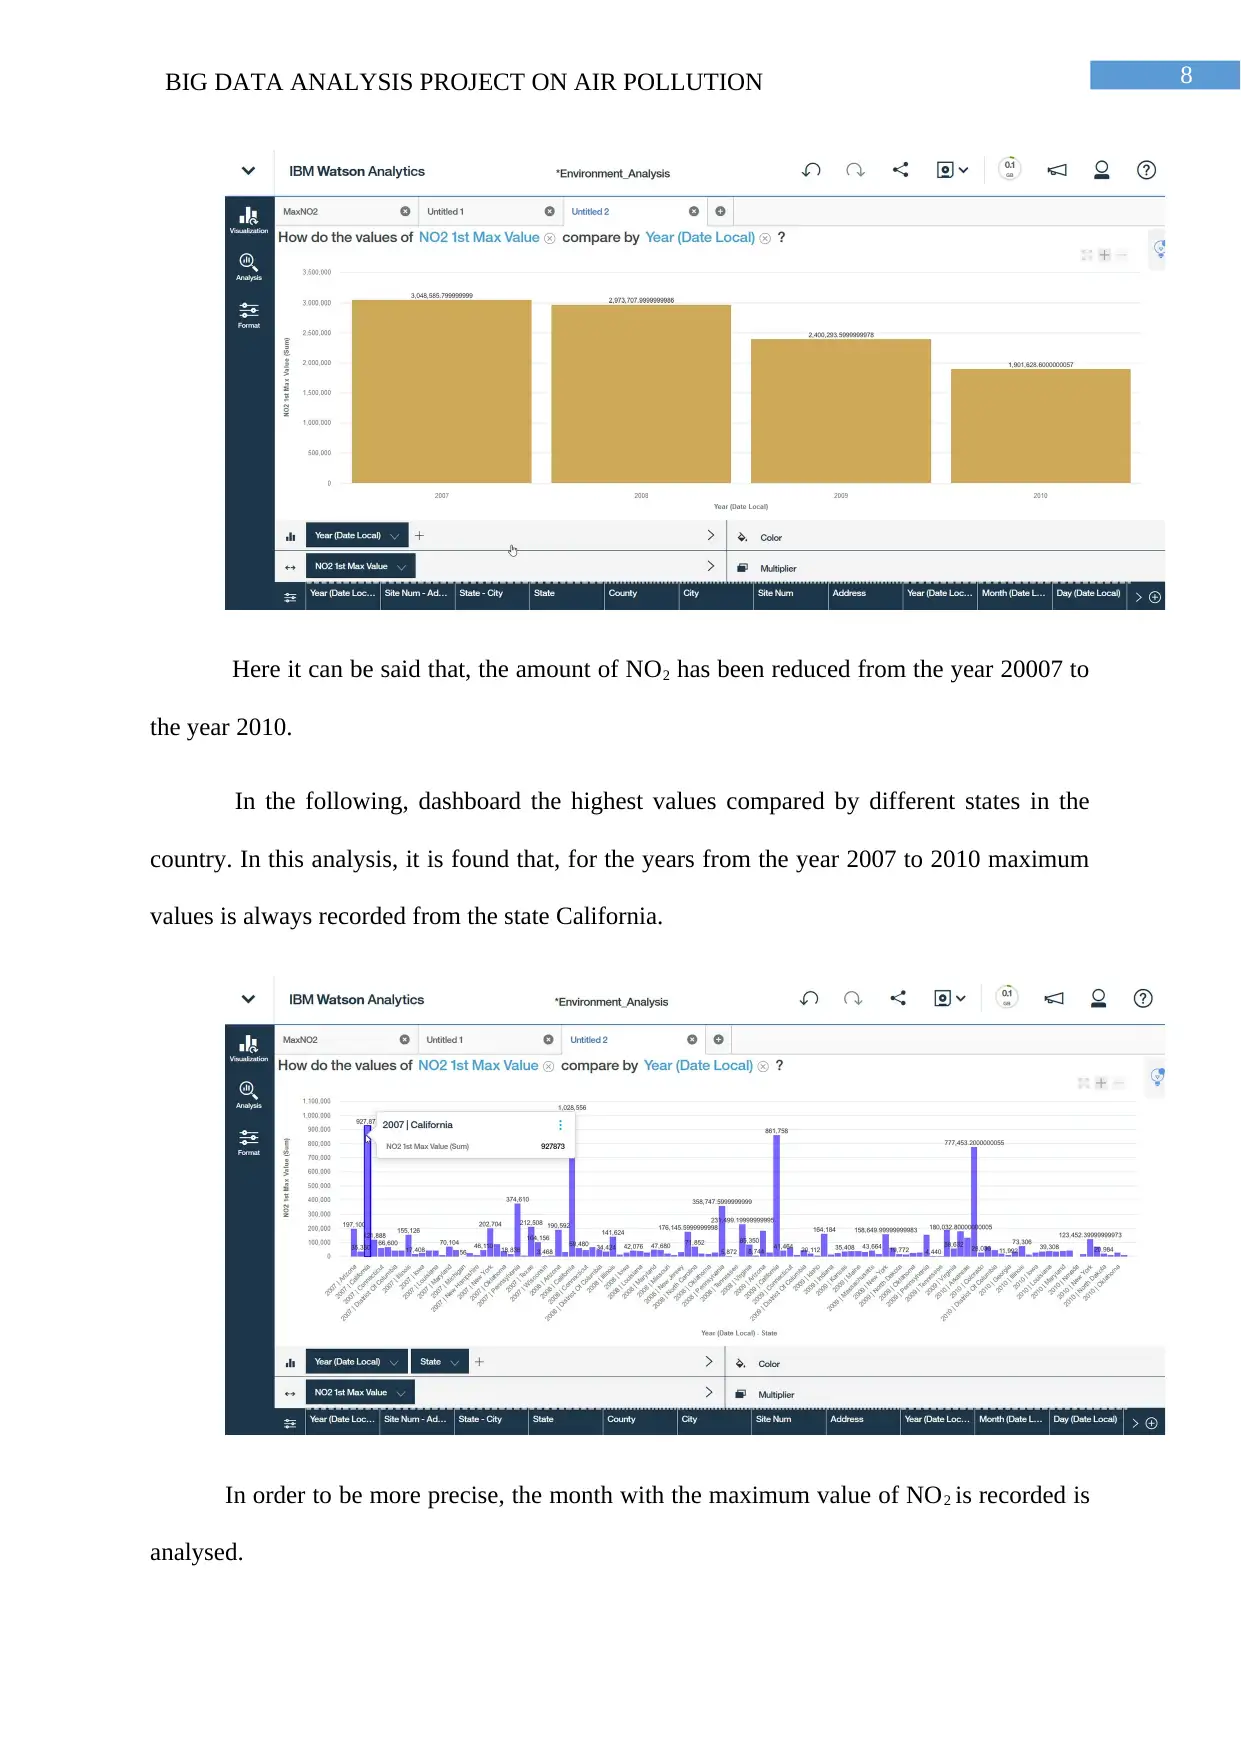
Here it can be said that, the amount of NO2 has been reduced from the year 20007 to
the year 2010.
In the following, dashboard the highest values compared by different states in the
country. In this analysis, it is found that, for the years from the year 2007 to 2010 maximum
values is always recorded from the state California.
In order to be more precise, the month with the maximum value of NO2 is recorded is
analysed.
⊘ This is a preview!⊘
Do you want full access?
Subscribe today to unlock all pages.
Trusted by 1+ million students worldwide
9BIG DATA ANALYSIS PROJECT ON AIR POLLUTION
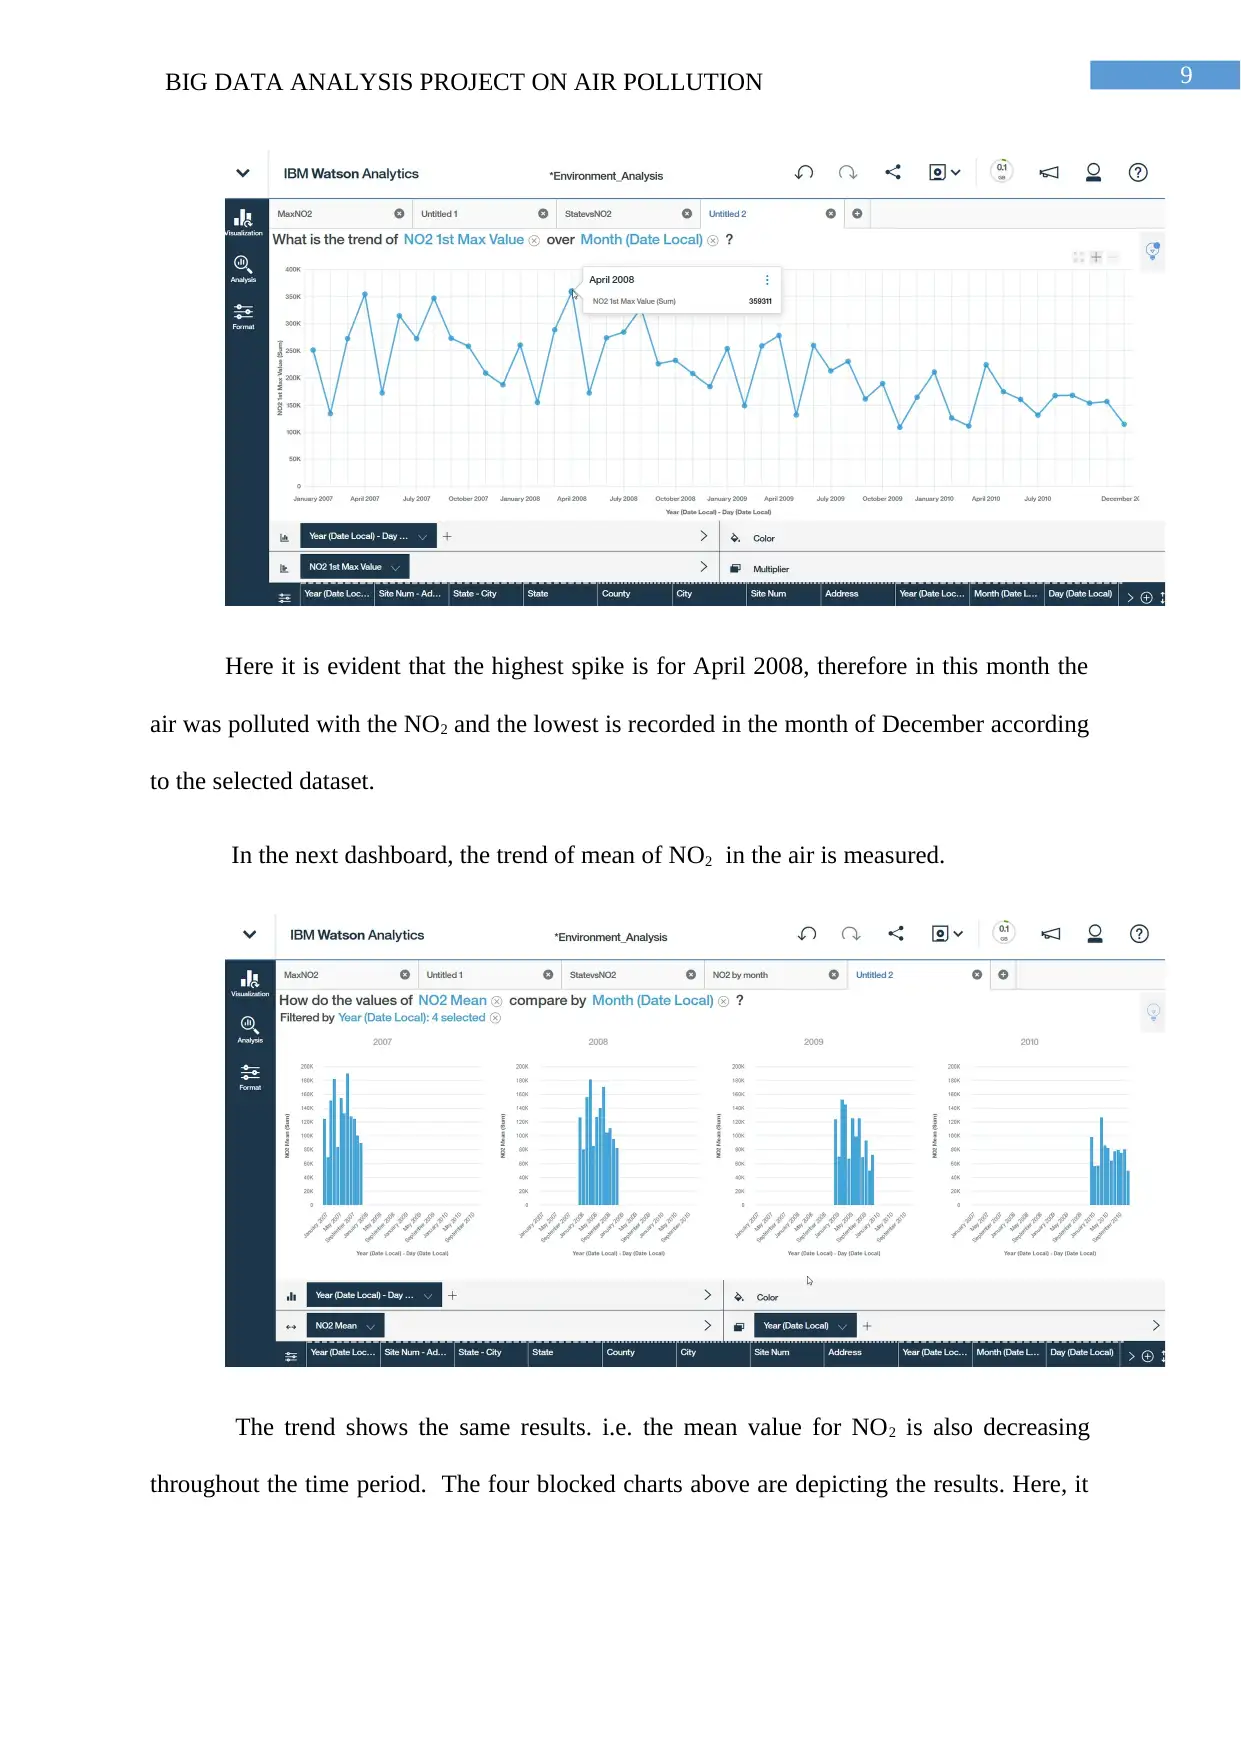
Here it is evident that the highest spike is for April 2008, therefore in this month the
air was polluted with the NO2 and the lowest is recorded in the month of December according
to the selected dataset.
In the next dashboard, the trend of mean of NO2 in the air is measured.
The trend shows the same results. i.e. the mean value for NO2 is also decreasing
throughout the time period. The four blocked charts above are depicting the results. Here, it
Paraphrase This Document
Need a fresh take? Get an instant paraphrase of this document with our AI Paraphraser
10BIG DATA ANALYSIS PROJECT ON AIR POLLUTION
is interesting to observe that the values are high in the initial months of the year 2007 and the
decreased value is recorded in last quarter of the year in 2010.
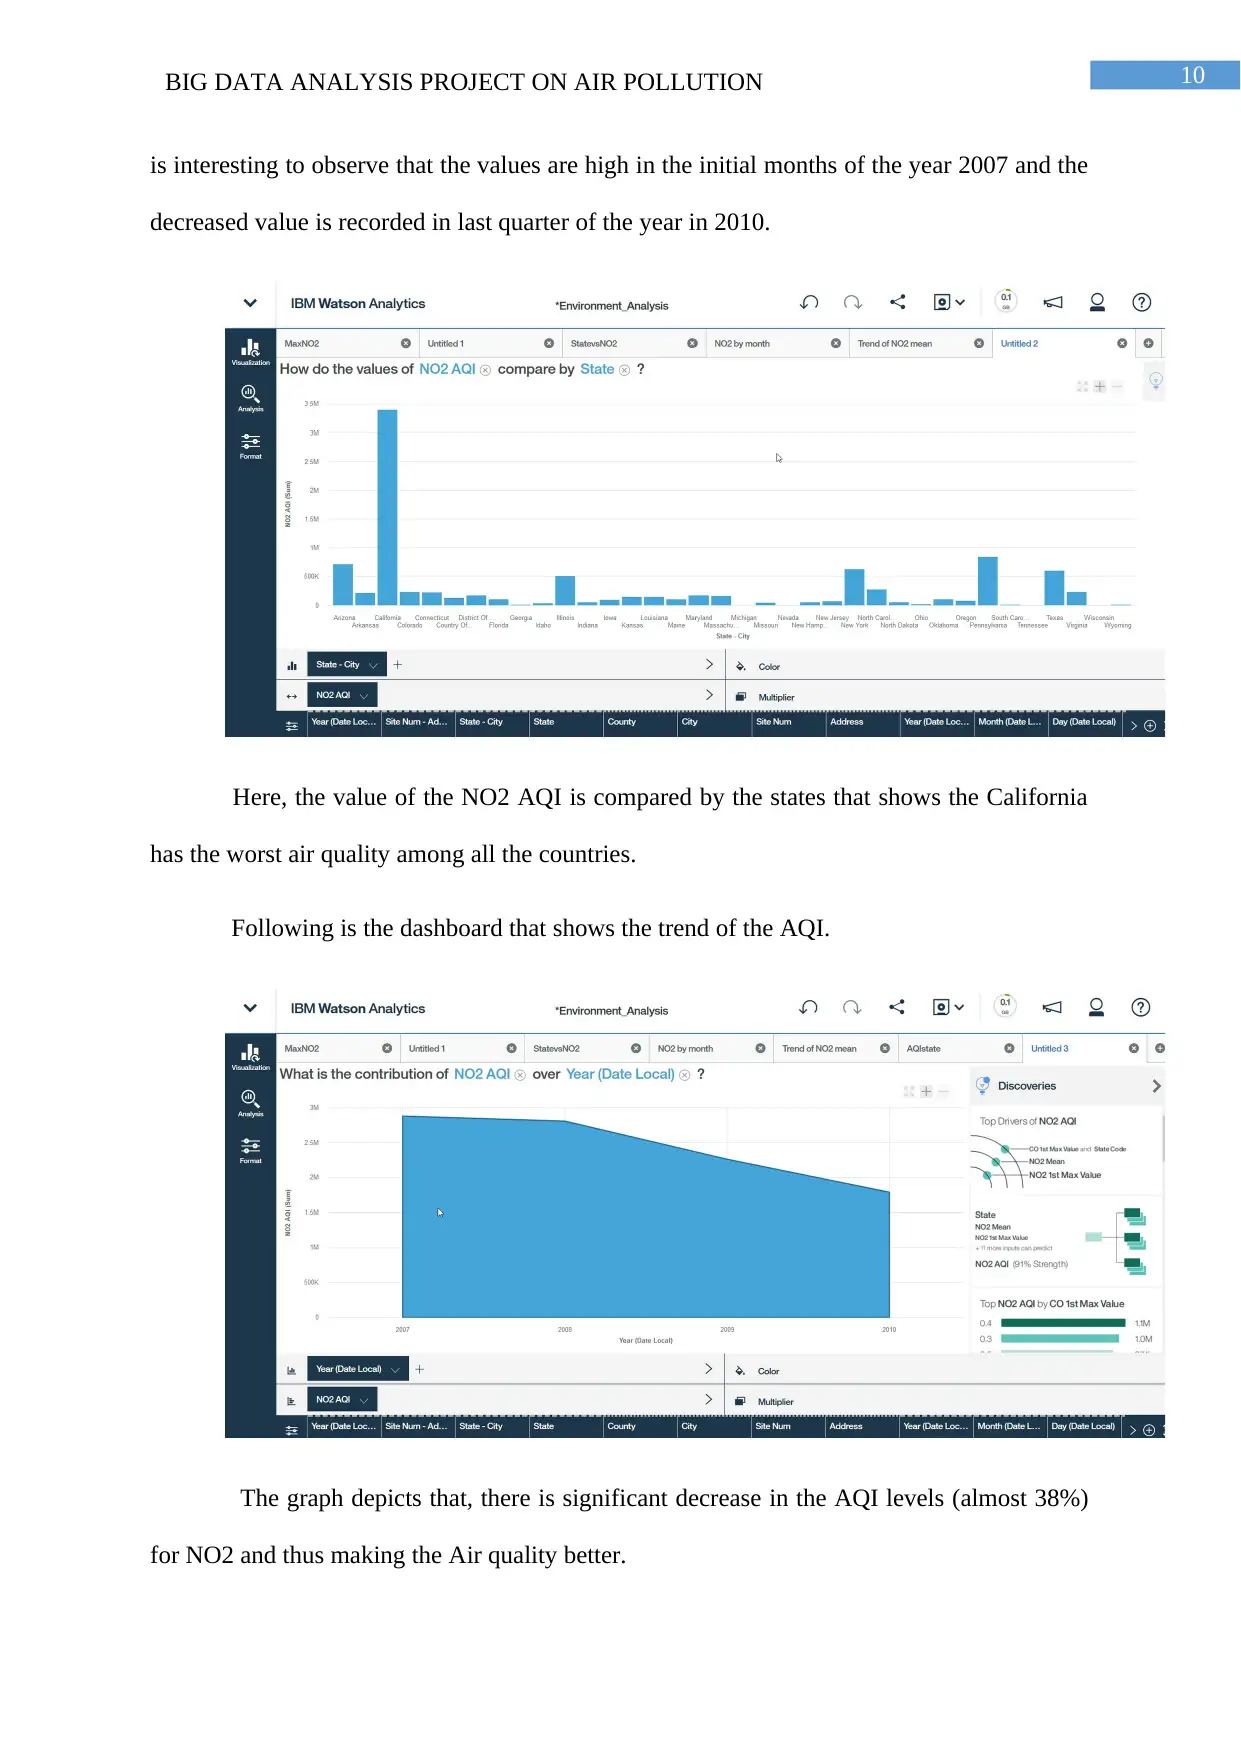
Here, the value of the NO2 AQI is compared by the states that shows the California
has the worst air quality among all the countries.
Following is the dashboard that shows the trend of the AQI.
The graph depicts that, there is significant decrease in the AQI levels (almost 38%)
for NO2 and thus making the Air quality better.
is interesting to observe that the values are high in the initial months of the year 2007 and the
decreased value is recorded in last quarter of the year in 2010.
Here, the value of the NO2 AQI is compared by the states that shows the California
has the worst air quality among all the countries.
Following is the dashboard that shows the trend of the AQI.
The graph depicts that, there is significant decrease in the AQI levels (almost 38%)
for NO2 and thus making the Air quality better.
11BIG DATA ANALYSIS PROJECT ON AIR POLLUTION
Following is prediction for the NO2 AQI in the country. The maximum and
minimum predicted value is recorded with 53.57 and 2.78. The maximum value is predicted
using the rules,
NO2 max value <=10.5
NO2 mean <=4.7
State: California
NO2 first max hour <=5
CO mean>0.15.
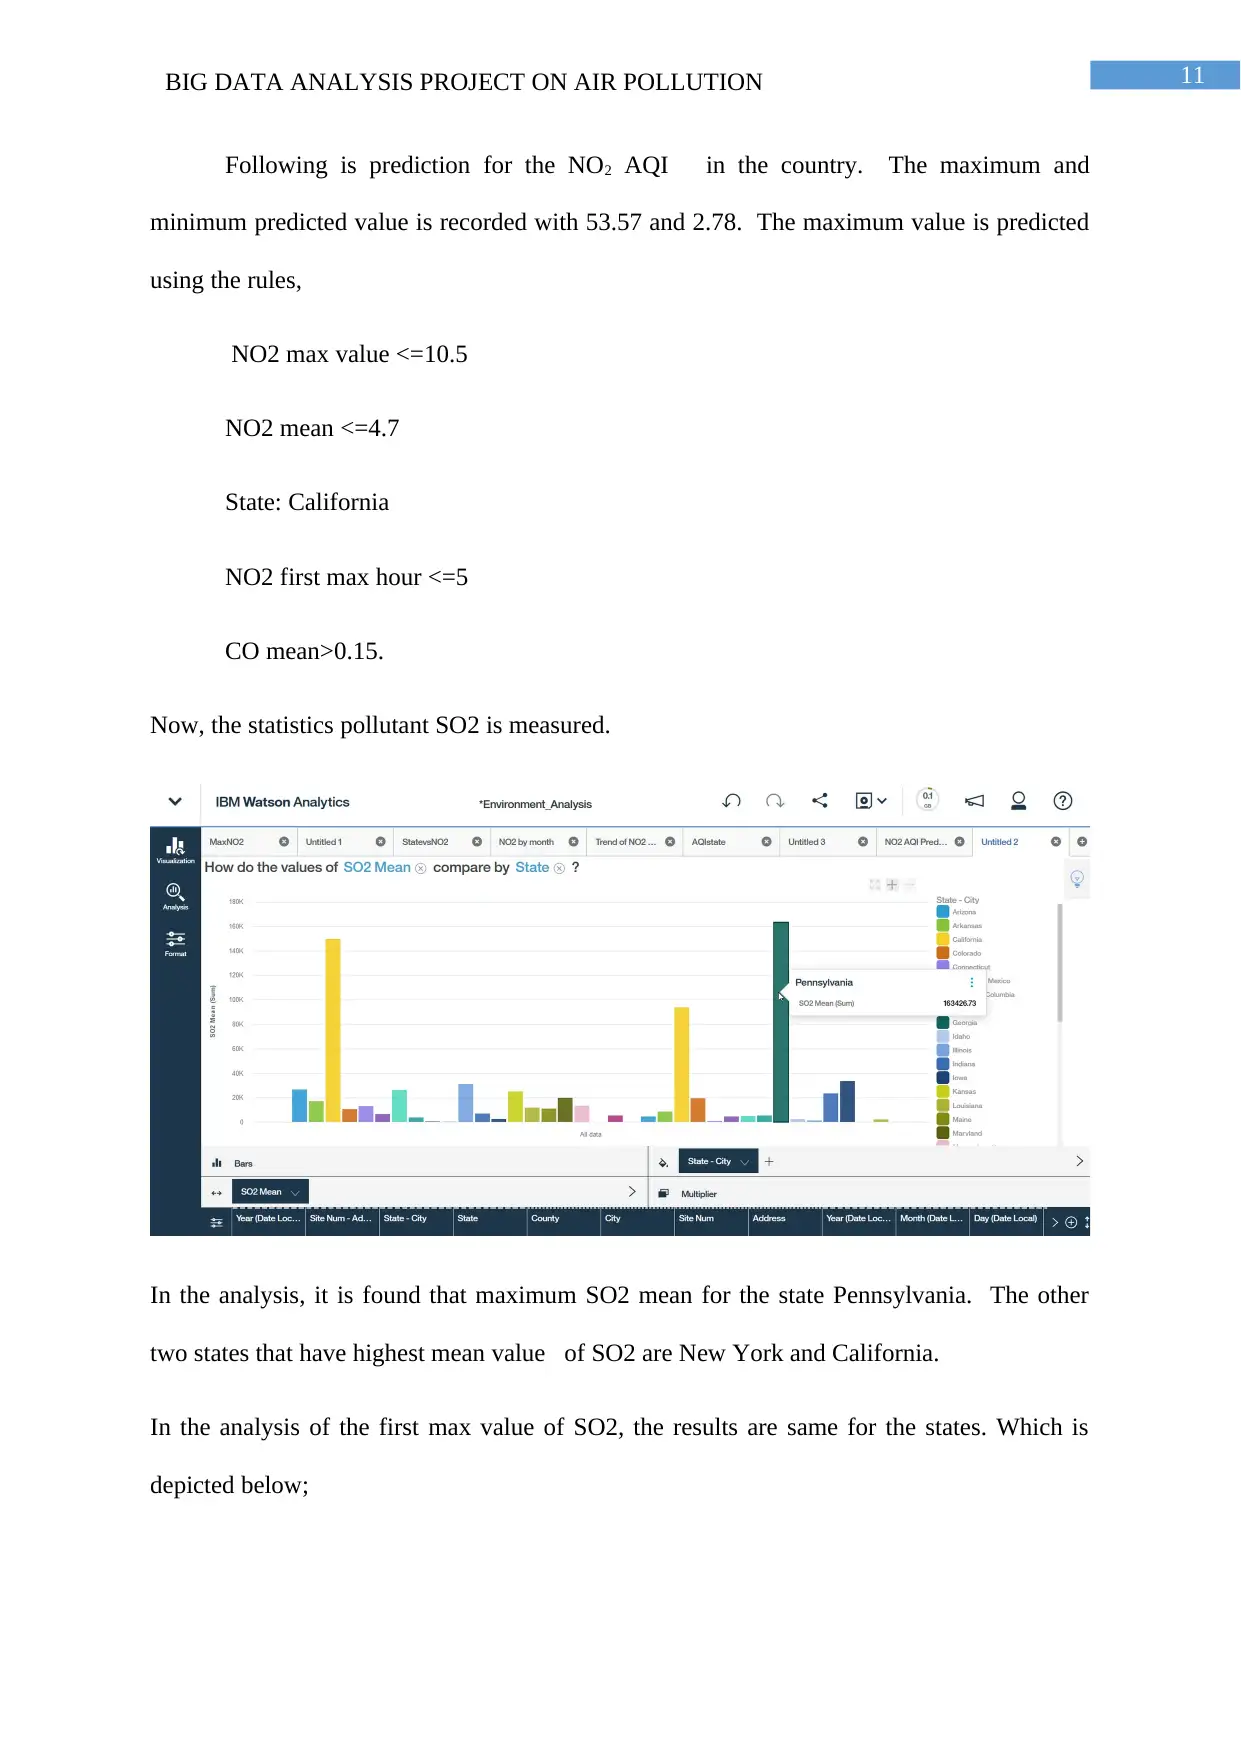
Now, the statistics pollutant SO2 is measured.
In the analysis, it is found that maximum SO2 mean for the state Pennsylvania. The other
two states that have highest mean value of SO2 are New York and California.
In the analysis of the first max value of SO2, the results are same for the states. Which is
depicted below;
Following is prediction for the NO2 AQI in the country. The maximum and
minimum predicted value is recorded with 53.57 and 2.78. The maximum value is predicted
using the rules,
NO2 max value <=10.5
NO2 mean <=4.7
State: California
NO2 first max hour <=5
CO mean>0.15.
Now, the statistics pollutant SO2 is measured.
In the analysis, it is found that maximum SO2 mean for the state Pennsylvania. The other
two states that have highest mean value of SO2 are New York and California.
In the analysis of the first max value of SO2, the results are same for the states. Which is
depicted below;
⊘ This is a preview!⊘
Do you want full access?
Subscribe today to unlock all pages.
Trusted by 1+ million students worldwide
1 out of 22
Related Documents


Your All-in-One AI-Powered Toolkit for Academic Success.
+13062052269
info@desklib.com
Available 24*7 on WhatsApp / Email
![[object Object]](/_next/static/media/star-bottom.7253800d.svg)
Unlock your academic potential
Copyright © 2020–2026 A2Z Services. All Rights Reserved. Developed and managed by ZUCOL.