ITECH7406 - BI and Data Warehousing: Environmental Issues Analysis
VerifiedAdded on 2023/03/30
|22
|3663
|181
Report
AI Summary
This report addresses critical environmental issues using Business Intelligence (BI) tools and data analysis techniques. It employs descriptive and prescriptive analysis, utilizing tools like SAP analysis and intelligent dashboards, to evaluate environmental problems such as CO2 emissions, energy consumption, and global warming. The report includes a case study of energy usage in a building, showcasing the practical application of BI dashboards. It further proposes the design of a mobile application to enhance awareness and management of environmental concerns, ultimately aiming to justify BI reporting solutions for reducing environmental issues and promoting sustainable practices. Desklib provides access to similar solved assignments and resources for students.
University
Semester
Business Intelligence and Data ware
housing
Student ID
Student Name
Submission Date
1
Semester
Business Intelligence and Data ware
housing
Student ID
Student Name
Submission Date
1
Paraphrase This Document
Need a fresh take? Get an instant paraphrase of this document with our AI Paraphraser
Executive Summary
Our planet, Earth is facing severe Environmental issues and in this project we shall use some
algorithm models and tools including Business intelligence device with evaluated reports and
by using the in-depth analysis with various methodologies. In our pursuit for finding the
solutions for these issues and in the safety of Earth we shall make use of Descriptive analysis
and Prescriptive analysis for further analysis. Development of design models for these
applications we are carried out and making use of the analytical tool, SAP analysis each step
for confirmation. Making use of the intelligent tool of Dashboard we shall conduct this
analysis for the problems related to environment.
Thus we shall give full justice to the Business intelligence reporting results for these issues.
Table of Contents
1. Introduction................................................................................................................................1
1.1 Problem Statement...........................................................................................................2
1.2 Objectives...........................................................................................................................2
1.3 Environmental Issues......................................................................................................2
1.4 Impact of CO2 Use on Environment.............................................................................3
2. Business Intelligence Reporting Solution with the help of Analytics..........................5
2.1 Descriptive Analysis........................................................................................................6
2.1.1 Dashboard..................................................................................................................6
2.1.2 SAP Analysis..............................................................................................................8
2
2.2 Prescriptive Analysis.......................................................................................................8
2.2.1 Dashboard..................................................................................................................9
2.2.2 SAP Analysis..............................................................................................................9
2.3 Dashboard Prototype.....................................................................................................10
3. Design of a Mobile Application...........................................................................................11
4. BI Reporting Solutions Justified for Reducing Environmental issues......................13
5. Conclusion...............................................................................................................................15
References.......................................................................................................................................16
1. Introduction
We shall be making use of the SAP BI (SAP BI (Business Intelligence) is a
platform used by SAP systems to provide an organization with a flexible route to
sharing information that available for the entire organization) as a Business
Intelligence (BI) tool for getting the answers to the problems discussed above. The
reason we are using the SAP BI tool when compared to the other probable tools is,
this provides real time analysis with predictive methodology. This is in addition to the
features that it brings to the table which includes proper planning, machine learning,
analysis, and various other features. With the data collected and all the information
available, after carrying out research and studies on the various organizations, the
Dashboard and the analytical tools that were discussed shall take charge. The data
will then be developed with the help of BI tools like SAP BI. Studies and
methodologies will be considered, especially the various patterns formed, data will
be filtered out and necessary data will extract, and effective strategy will be implied
3
⊘ This is a preview!⊘
Do you want full access?
Subscribe today to unlock all pages.
Trusted by 1+ million students worldwide
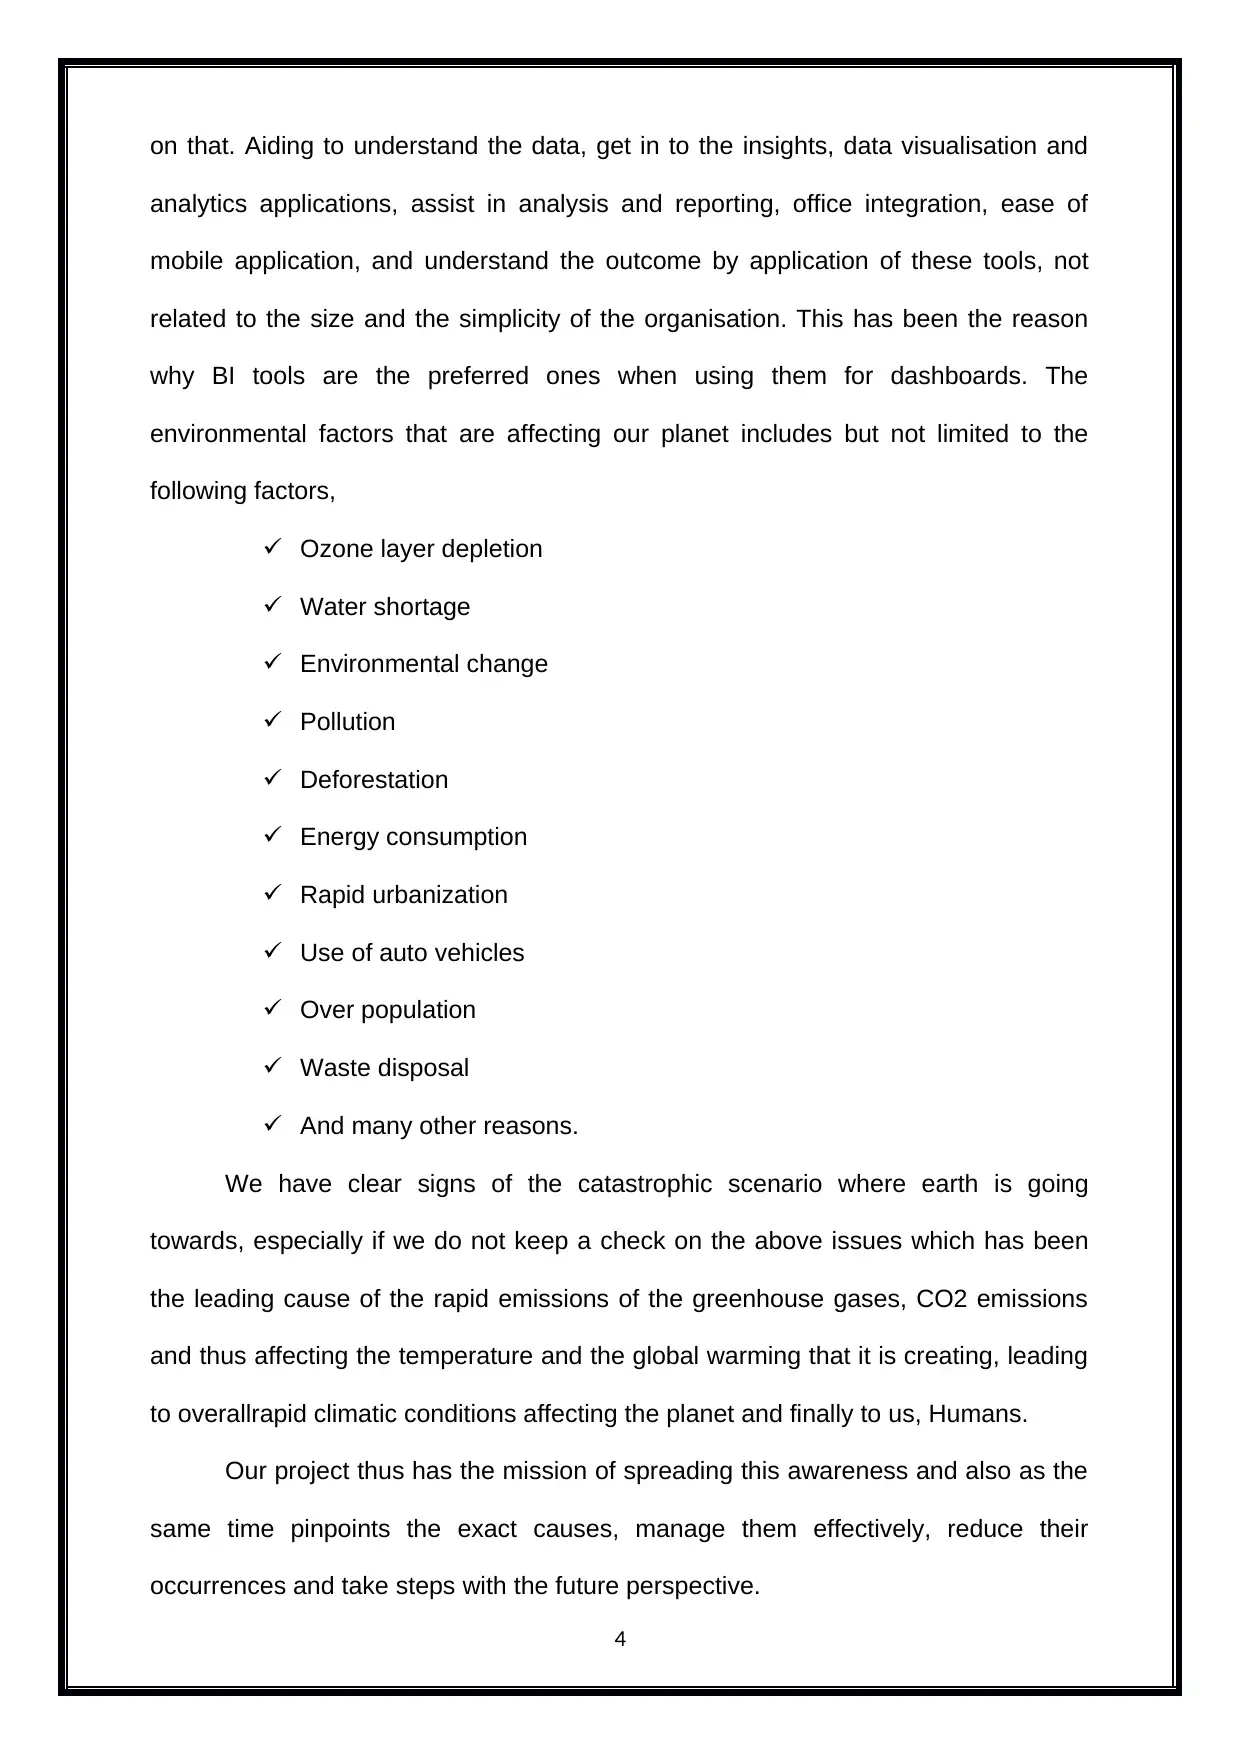
on that. Aiding to understand the data, get in to the insights, data visualisation and
analytics applications, assist in analysis and reporting, office integration, ease of
mobile application, and understand the outcome by application of these tools, not
related to the size and the simplicity of the organisation. This has been the reason
why BI tools are the preferred ones when using them for dashboards. The
environmental factors that are affecting our planet includes but not limited to the
following factors,
Ozone layer depletion
Water shortage
Environmental change
Pollution
Deforestation
Energy consumption
Rapid urbanization
Use of auto vehicles
Over population
Waste disposal
And many other reasons.
We have clear signs of the catastrophic scenario where earth is going
towards, especially if we do not keep a check on the above issues which has been
the leading cause of the rapid emissions of the greenhouse gases, CO2 emissions
and thus affecting the temperature and the global warming that it is creating, leading
to overallrapid climatic conditions affecting the planet and finally to us, Humans.
Our project thus has the mission of spreading this awareness and also as the
same time pinpoints the exact causes, manage them effectively, reduce their
occurrences and take steps with the future perspective.
4
Paraphrase This Document
Need a fresh take? Get an instant paraphrase of this document with our AI Paraphraser
1.1 Problem Statement
Global Warming. Greenhouse Gases. CO2 Emissions!! These are the words
that have been creating issues to our Environment. Slowly and steadily, the path is
leading to catastrophic proportions if things are not taken seriously and remedy
measures not implied. With every increasing global temperatures and warming of the
earth, affects everything around use and also to us, human beings. Steps have to be
taken stop global warming and minimizing the ozone depleting substances/gases.
One of the main reasons for the increase in global temperatures is the
uncontrolled emission of CO2 gas, whether that is from fossil burning, excessive
auto vehicle usage or even energy consumption. These and various other factors,
small and big contribute to the CO2 gas emission (Das, 2014). The Solar energy and
heat gets trapped in the earth’s atmosphere and these gases are the reason behind
this phenomenon. It’s not only CO2 gas, but there are other various gases,
Chlorofluorocarbons (CFCs), Hydrochlorofluorocarbons (HCFCs),
Hydrobromoflurocarbons (HBFCs), Halons, Methyl bromide, Carbon tetrachloride,
Methyl chloroform, etc.
Thus we shall use a Dashboard to address all of the above problems and to
give a solution for this environmental issue.
1.2 Objectives
Below are the targets of conducting this project,
a) To conduct descriptive analysis
b) To conduct prescriptive analysis
c) To resolve the energy consumption issue.
5
d) . To design a predictive analytical application
e) To identify the carbon dioxide causing factors and its influence on our
environment (Bag, n.d.).
1.3 Environmental Issues
In the previous chapter we have seen how the CO2 and other Ozone
depleting gases are destroying the Ozone layer with increasing the global
temperature. Now, research has shown us that Global warming does not happen
only because of this factor. There are other causes and issues that contribute to this
phenomenon (GARCIA MARQUEZ, 2016).
Various Institutes and Research facilities are conducting research and studies
on this topic worldwide to determine the other factors that affects the Global
temperatures and increasing warming conditions. With the aid of real time evaluation
and continuous data set updates, it has been found that High energy consumption is
one of the biggest threats to global increase in temperature (Open-data.europa.eu,
2019). Our energy production and use is interconnected with many other aspects of
modern life, such as water consumption, use of goods and services, transportation,
economic growth, land use, and population growth. Our production and use of
energy (most of which comes from fossil fuels) also contributes to climate change,
accounting for more than 84% of U.S. greenhouse gas emissions. Research has
proved that these issues and the drawbacks are related to unnatural events.
Everyone has to make an effort in the right direction so as to reverse this trend and
the harmful activities on nature or else the day will not be far off when our inactions
today will result in Catastrophes in the days to come.
Now on the other hand, taking steps does not mean that there is a switch and
just by putting it on “Off” mode will reverse all these ill effects. There has to be a
collective step from every individual, every family, every organization, every industry
6
⊘ This is a preview!⊘
Do you want full access?
Subscribe today to unlock all pages.
Trusted by 1+ million students worldwide
and every government, to the contribution of restoring back the harmful effects we
have done on nature. Together with solid planning and result oriented steps will lead
us to a much better tomorrow with, minimum effects on our Environment and finally
on our planet (Data.un.org, 2019).
Impact of CO2 Use on Environment
Throughout the years we have created a ton of gas, oil and coal for the
utilization of our day by day lives. With the creation of those materials, CO2 outflows
get into our perfect air and cause an undetectable layer around the earth. This layer
keeps the heat inside the earth so to state, and that cause’s worldwide warming.
New sort of atmospheres will show up in different nations. New sort of temperature,
for example, a lot colder or way more sweltering will emerge. Additionally, the
measure of precipitation will rise comprehensively and extraordinary climate will
happen all the more regularly. Desertification will emerge and the ripe ground will be
lost. This implies increasingly dry zones will show up in nations where it is as of now
extremely hot. Fermentation will emerge. This implies seawater will get progressively
corrosive and in the long run will influence the coral reefs and species that live there.
All these are real and imminent dangers to our environment and to us. Steps
have to be taken and immediately. For this the Nations and their governments have
to step their efforts and initiation. Awareness, spreading knowledge, steps to involve
local people, companies, industries, business sectors etc to this common agenda is
required. Only individual or a few organizations will not result in the required
outcome. Government involvement is a must. Traditional fossil fuels, cause lot of
greenhouse gases, contributing immensely to the global warming and increase in
temperatures. More research and efforts have to be made for alternate, cleaner and
reusable energies like Solar Energy, Hydro power, Wind Energy etc.
7
Paraphrase This Document
Need a fresh take? Get an instant paraphrase of this document with our AI Paraphraser
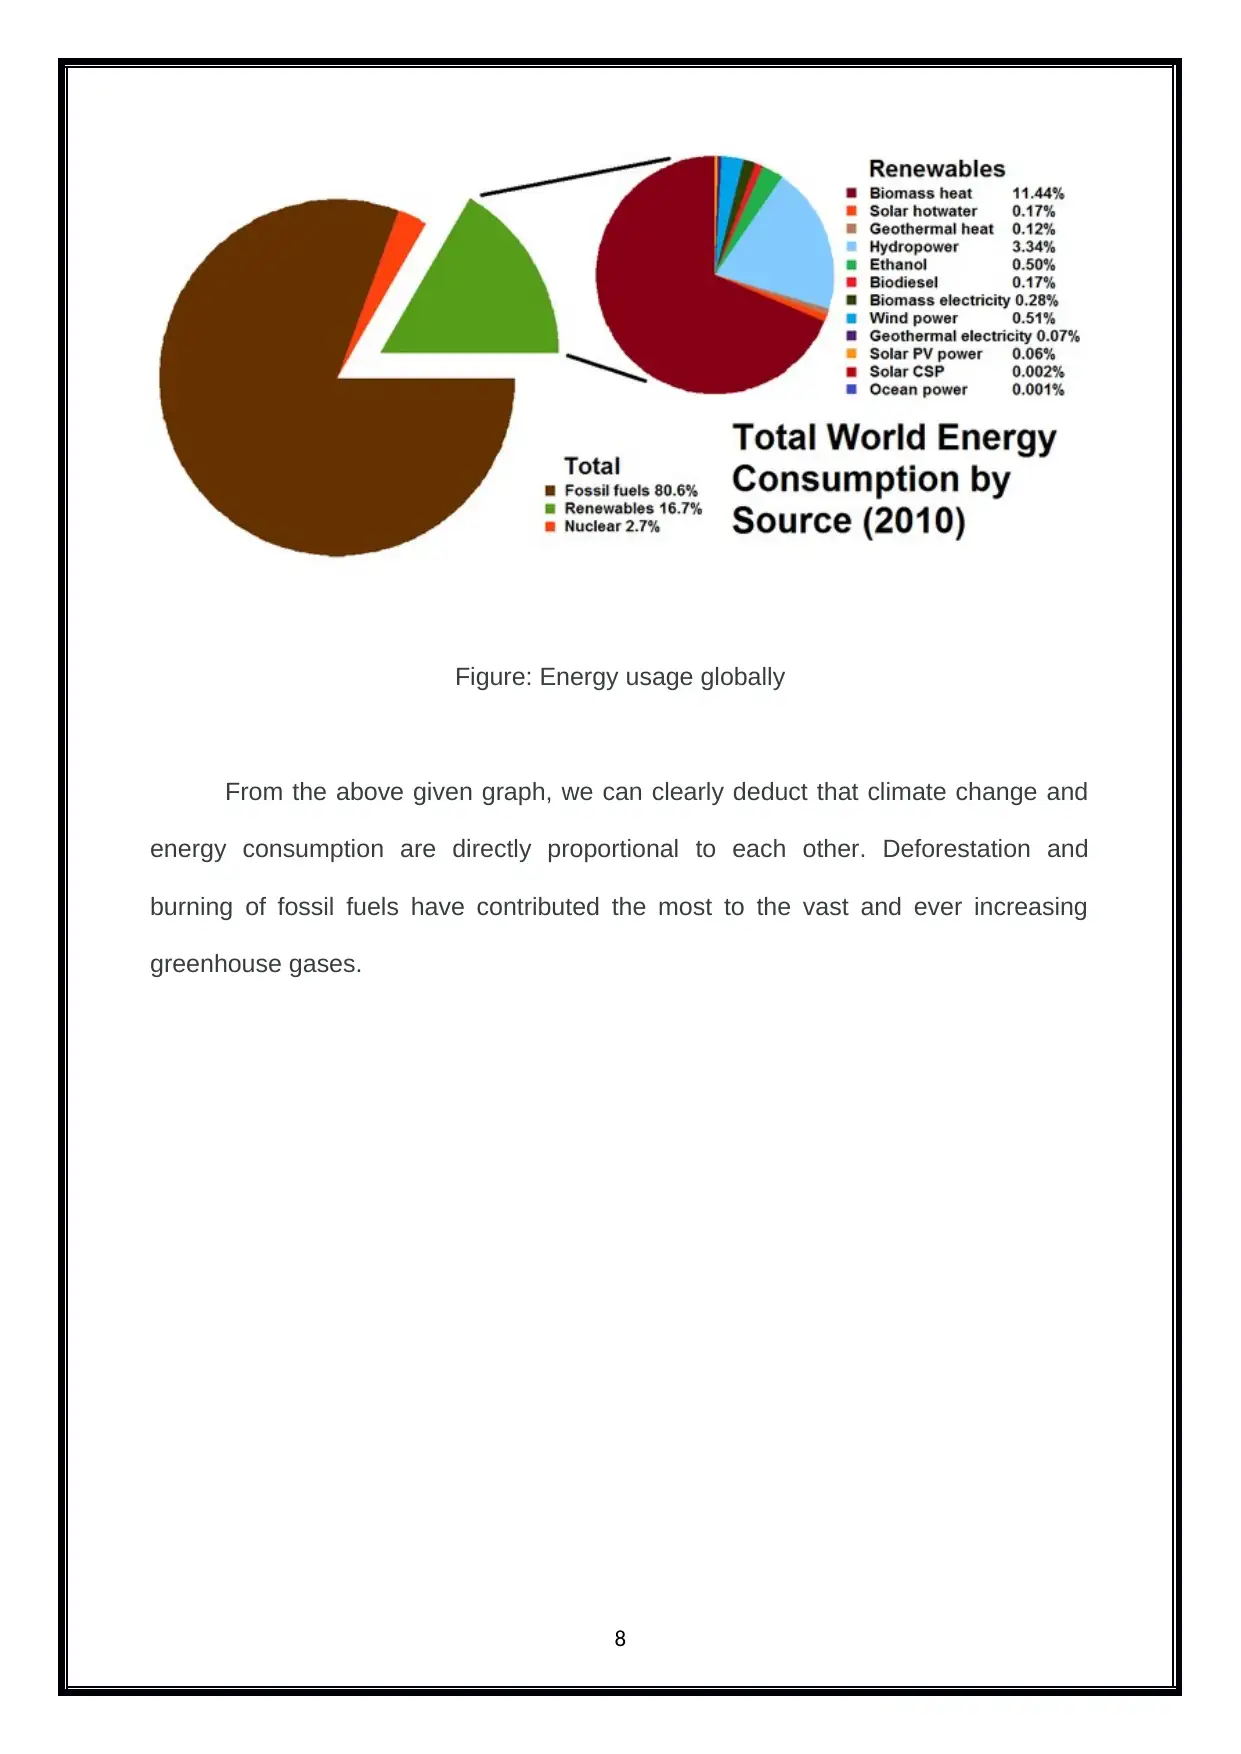
Figure: Energy usage globally
From the above given graph, we can clearly deduct that climate change and
energy consumption are directly proportional to each other. Deforestation and
burning of fossil fuels have contributed the most to the vast and ever increasing
greenhouse gases.
8
From the above given graph, we can clearly deduct that climate change and
energy consumption are directly proportional to each other. Deforestation and
burning of fossil fuels have contributed the most to the vast and ever increasing
greenhouse gases.
8
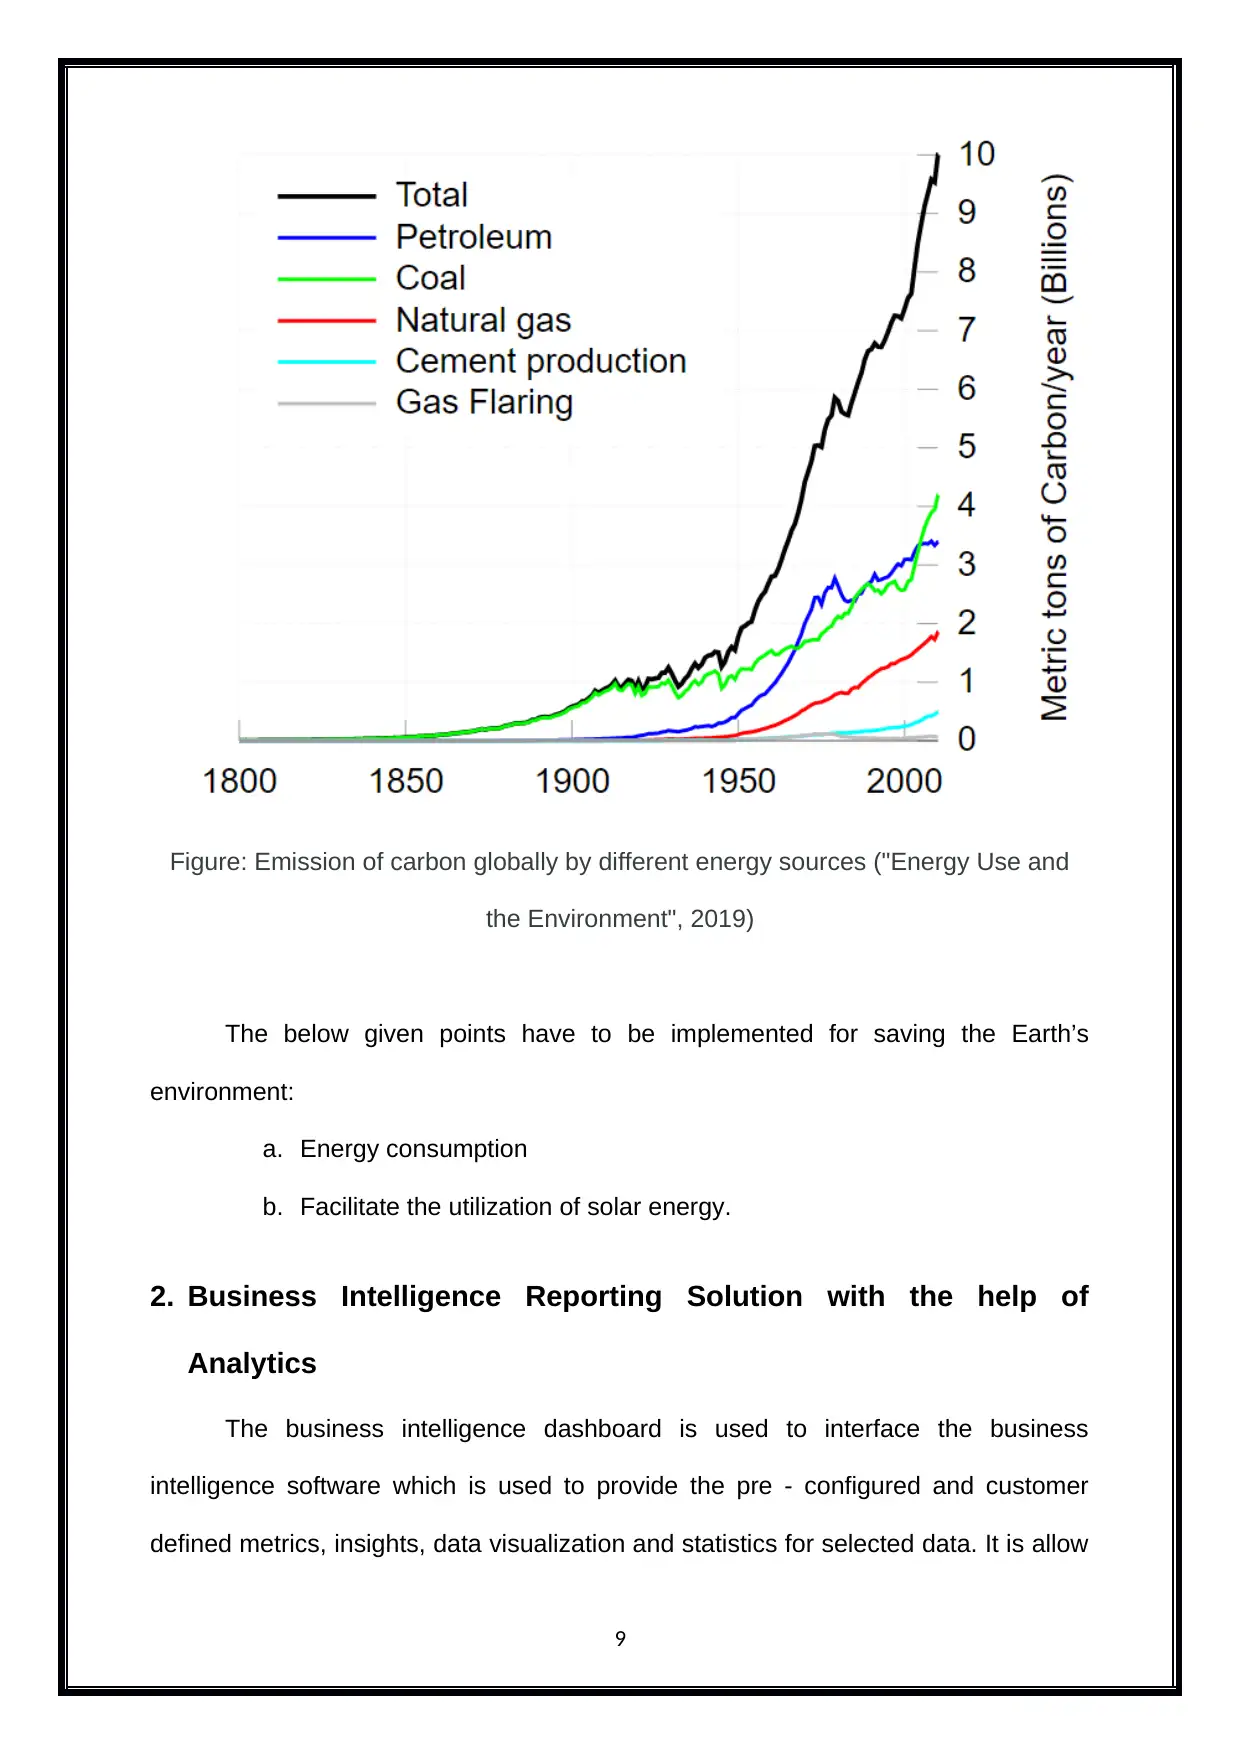
Figure: Emission of carbon globally by different energy sources ("Energy Use and
the Environment", 2019)
The below given points have to be implemented for saving the Earth’s
environment:
a. Energy consumption
b. Facilitate the utilization of solar energy.
2. Business Intelligence Reporting Solution with the help of
Analytics
The business intelligence dashboard is used to interface the business
intelligence software which is used to provide the pre - configured and customer
defined metrics, insights, data visualization and statistics for selected data. It is allow
9
⊘ This is a preview!⊘
Do you want full access?
Subscribe today to unlock all pages.
Trusted by 1+ million students worldwide
the end users to view the instant results in to the live performance state of data and
business analytics. It is designed to allow users to view the data visualization of their
preferred business intelligence operations, eliminating the requirements for manually
executed the processes and queries. Reporting and getting the right feedback and
decision making is important in the BI Dashboard. Various tools are used on the
Dashboard, for analysis and also the get a simple and clear picture of the various
data that goes into this evaluation (Ask, 2013).
2.1 Descriptive Analysis
The descriptive analytics is used to describe and summarize the selected
data. Generally, it involves to organizing and summarising the data which is used to
provide the easily understand about the data. It is a inferential statistics and it seeks
to describe the data but it do not attempt to create the inferences from the sample to
the whole population (Pope, 2017). Here, we typically describe the data in a sample.
Patterns from past data are studied and evaluated for current sample data sets. They
are easy and simple to use with minimum technical background requirement.
Tableau, QlikView, Google Analytics etc are some of the popular and widely used
Descriptive Analysis tools for data research (Abbott, 2014).
The display after using the above mentioned tools can be as per the users’
choice, like graphical, tabular, bar charts etc. There is flexibility in the usage of the
this tool for the required display (Pyne, Rao and Rao, 2016).
2.1.1 Dashboard
Dashboards can be of three types, namely, strategic, tactical, and operational.
Below is the brief description for each of this type (Data.gov, 2019),
The operational dashboard is used to shows what is happening
now.
10
Paraphrase This Document
Need a fresh take? Get an instant paraphrase of this document with our AI Paraphraser
The Strategic dashboard is used to monitor the key performance
indicators.
The Analytical dashboard is used to use the process data which
is used to identify trends.
These are customizable as per the user’s choice and can be similarly named
as pet their requirement (Mendoza, 2010).
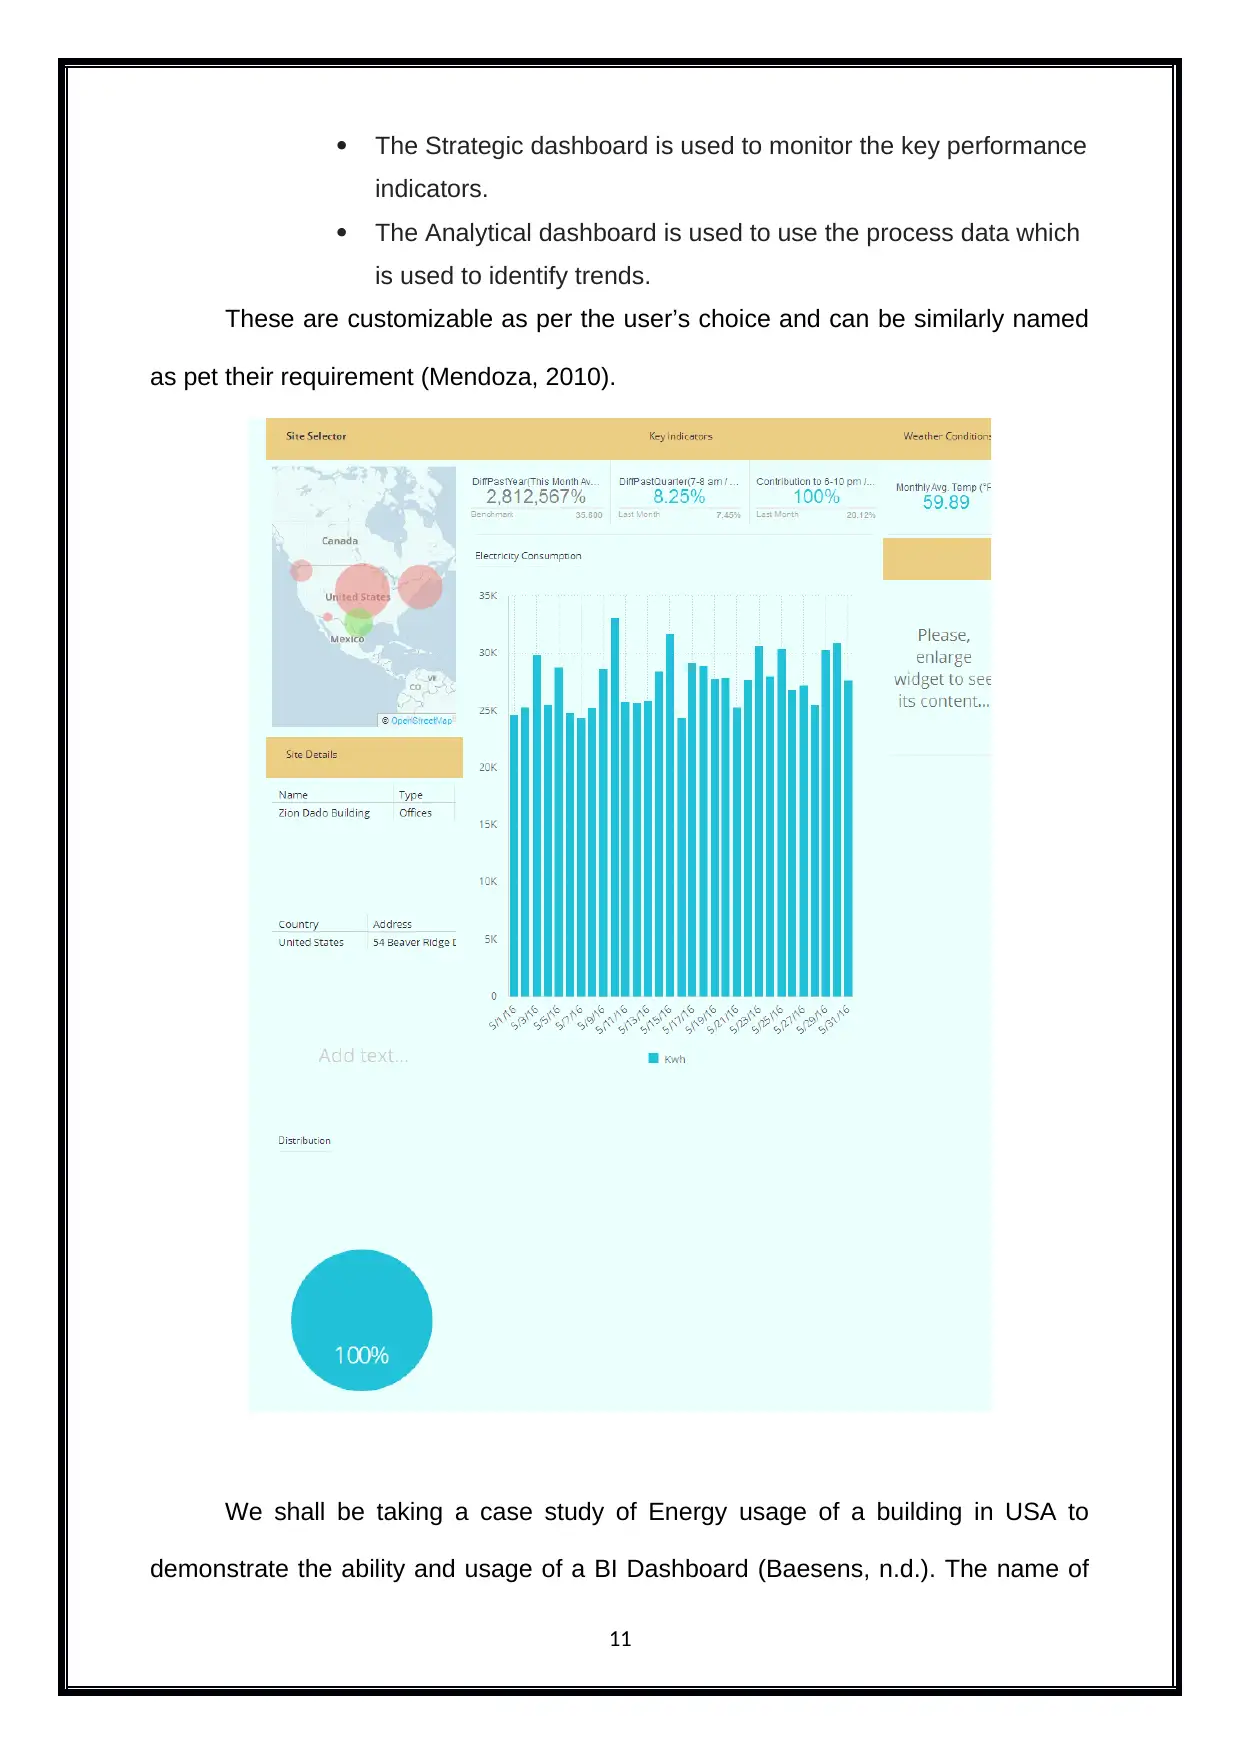
We shall be taking a case study of Energy usage of a building in USA to
demonstrate the ability and usage of a BI Dashboard (Baesens, n.d.). The name of
11
indicators.
The Analytical dashboard is used to use the process data which
is used to identify trends.
These are customizable as per the user’s choice and can be similarly named
as pet their requirement (Mendoza, 2010).
We shall be taking a case study of Energy usage of a building in USA to
demonstrate the ability and usage of a BI Dashboard (Baesens, n.d.). The name of
11
the building in our case study is "Zion Dado Building”. If you see the above
dashboard, lot of information has been provided and data like benchmarking,
monthly energy consumption, previous and current energy usage and temperature is
displayed, giving the user a far better picture and understanding of the whole
scenario. Like the case of 35,600 is the benchmarking, which has achieved 2, 812,
5675.
2.1.2 SAP Analysis
SAP Analysis helps you to gain insight into business data and make intelligent
decisions that impact corporate performance. It’s a powerful tool which plays multiple roles in
the system like such as data management, analytical tool, data restructuring, data
filtration etc (DuttaRoy, n.d.).
We shall consider the below bar diagram as an example for studying the SAP
Analysis function. The data has been for the period from 2012 to 2016 for CO2
emissions. In 2016 the CO2 emissions was 380 kilotons while in 2013 it was at 545
kilotons. The following graph illustrates the estimated CO2 emission in the specific
period.
12
⊘ This is a preview!⊘
Do you want full access?
Subscribe today to unlock all pages.
Trusted by 1+ million students worldwide
1 out of 22
Related Documents


Your All-in-One AI-Powered Toolkit for Academic Success.
+13062052269
info@desklib.com
Available 24*7 on WhatsApp / Email
![[object Object]](/_next/static/media/star-bottom.7253800d.svg)
Unlock your academic potential
Copyright © 2020–2026 A2Z Services. All Rights Reserved. Developed and managed by ZUCOL.