Monash University ITECH7406: Data Analysis of Environmental Issues
VerifiedAdded on 2022/12/29
|25
|4288
|67
Report
AI Summary
This report presents an analysis of environmental issues, focusing on the application of Business Intelligence (BI) tools, specifically dashboards and SAP algorithms, to understand and address critical challenges. The study examines the impact of human activities on the environment, including deforestation, climate change, and the emission of greenhouse gases, particularly CO2. The report delves into the utilization of descriptive and prescriptive analysis methodologies, along with the design of a mobile application, to evaluate energy consumption, CO2 emissions, and the role of renewable energy sources like solar and wind power. The objective is to offer insights for informed decision-making and to propose effective strategies for environmental protection, including the reduction of energy consumption and the promotion of sustainable practices. The report also investigates the integration of various data sources, the identification of trends and patterns, and the application of analytical algorithms to predict environmental outcomes. The ultimate aim is to provide a comprehensive understanding of environmental issues and to offer practical solutions for mitigating their effects using the power of BI tools.

1
Paraphrase This Document
Need a fresh take? Get an instant paraphrase of this document with our AI Paraphraser
Executive Summary
This project analyses , studies and finally makes the report about the use of
Dashboard, the intelligent and smart Business Information tool about, the dangers
and catastrophic warnings that are being given by Nature to us and to our planet as
we are rapidly destroying the environment and finally our lives. The analysis
regarding the issues facing the environment and thus the planet shall be addressed
by the utilisation of this Dashboard and the datasets collected for this project will be
analysed by methodologies like Prescriptive and Descriptive analysis procedures
with the implementation of SAP algorithms, we shall create a model application that
will aid us in this solution finding process to best protect our environment.
In this project we shall make concrete steps to evaluate, study and discuss the
points that cover all the above by making use of Dashboard, the Business Intelligent
reporting tool.
2
Table of Contents
1. Introduction................................................................................................................................1
1.1 Problem Statement...........................................................................................................2
1.2 Objectives...........................................................................................................................2
1.3 Environmental Issues......................................................................................................2
1.4 Impact of CO2 Use on Environment.............................................................................3
2. Business Intelligence Reporting Solution with the help of Analytics..........................5
2.1 Descriptive Analysis........................................................................................................6
2.1.1 Dashboard..................................................................................................................6
2.1.2 SAP Analysis..............................................................................................................8
2.2 Prescriptive Analysis.......................................................................................................8
2.2.1 Dashboard..................................................................................................................9
2.2.2 SAP Analysis..............................................................................................................9
2.3 Dashboard Prototype.....................................................................................................10
3. Design of a Mobile Application...........................................................................................11
4. BI Reporting Solutions Justified for Reducing Environmental issues......................13
5. Conclusion...............................................................................................................................15
References.......................................................................................................................................16
3
⊘ This is a preview!⊘
Do you want full access?
Subscribe today to unlock all pages.
Trusted by 1+ million students worldwide
1. Introduction
With the vast and huge amount of data collected and to extract important and
detailed information from this, by sorting, filtering, analyzing tools application,
algorithm evaluations and modifications, we require powerful and smart tools. Here
is where we make use of the Business Intelligence (BI) tools which do all of these
functions and also create the reports, data graphic outcomes, data outputs etc for
the user to make intelligent decisions based on this given information. Dashboards
are part of this tool and a very unique graphic display platform where all the
information is displayed for the users to make important decisions. A reporting and
analytics business intelligence (BI) platform, SAP BLI’s is targeted for the business
community and organizations. These collect the data in a proper method, sort out the
data as per pre-defined parameters, identify the trends and patterns in the given data
sets, isolate the datasets where error percentage is huge, and then apply the
algorithms for making smart decisions. All the data in this system will be dynamic
and the output will be based on real time analysis and evaluation within the system.
Thus for the user, it can give the forecast of the important decisions taken based on
this data sets, without the additional issue of size and parameters affecting the
datasets. SAP BI is used for discovering the data sets and also same time to identify
the trending patterns and designs for forecasting the outcomes by using the key
parameters. The advantages of using the SAP BI tool are,
Evaluation applications
Datasets/ Information visualisation
Evaluation and reporting
Integrating with Office
4
Paraphrase This Document
Need a fresh take? Get an instant paraphrase of this document with our AI Paraphraser
Mobile analytics.
Research and studies have proved that the human activities have been taking toll
on our nature and environment leading to disastrous situations. These components
of the Environmental problems are,
Shortage of water
Deforestation
Depletion of ozone layer
Rapid Urbanisation
Population explosion
Changes in environmental climate
Air/ Water pollution
High energy consumption
Greenhouse gases, Global Warming, Rapidly changing climate, Rising water levels,
etc, are all the signs of leading to catastrophe and disaster if concrete and solid
steps are not taken as soon as possible. All this issues and the ways to prevent them
and reduce the ill effects of human activities affecting mother nature, we shall make
use of Dashboard.
1.1 Problem Statement
With the awareness among people increasing, they have been able to identify and
see around them the ill-effects of environment degradation like how forests are
rapidly decreasing, the high temperatures increasing every year, depletion of natural
resources, natural species reducing at an alarming rate, melting of polar regions,
Ozone layer getting destroyed etc. But the biggest threats out of all these are Global
Warming and Rapid Climatic changing patterns.
5
Researchers and Climatic studying scientists have observed that the severity of the
cyclones, typhoons, storms, droughts etc and the more frequent occurrence in a
given period of time. All these are the result of our, human activity and how this is
severely affecting the environment around us and the balance is getting disturbed.
It is time to look within ourselves and start answering questions as to why these
things are happening and how to stop them. The sooner we are able to answer these
queries the better it will be for human race and planet earth.
We shall study all these factors and come up with solutions that are practical and
same time effective by utilising the intelligent and smart tools like Dashboard and
Analytical algorithms.
Objectives
The following are the objectives of this project:
1) To know the reason of CO2 emission and its impact on the
environment.
2) To carry out perform descriptive / prescriptive analysis.
3) To design a predictive analytical application
4) To resolve energy consumption issue.
1.2 Environmental Issues
Along with the research work going on the study of Greenhouse gases, CO2
emission etc, there are researchers who are analysing some of the other influencing
factors that are damaging our environment. There are lot of other factors and points
that we don’t consider and focus upon, but they still contribute significantly to the
environment issues and thus have to be taken seriously with the other major
6
⊘ This is a preview!⊘
Do you want full access?
Subscribe today to unlock all pages.
Trusted by 1+ million students worldwide
contributors. Overuse of Energy and High Energy usage is one of the major factors
that are taking the toll on nature. Studies have proved that there is a rapid demand of
Energy all over the globe (Collier, Edberg & Croasdell, 2012). This demand is in all
forms, like fossil fuels, electricity, Natural Gas, Nuclear energy, solar energy,
Biomass Energy etc. All these are major contributors to the increasing Greenhouse
gases and steady rise in global temperatures. With the demand and more usage of
fuels, there is more release of CO2 gas in atmosphere along with other gases.
These gases get trapped in the Greenhouse effect and thus raising the global
temperature. Electricity, auto vehicles, biomass usage, etc are all contributors to this
damage. Other affects that are happening along with these damages are, the
excessive SO2 gas causing acid rains, damaging crops and natural life. This is a
sure path to self-destruction and environment disaster.
So, every individual, every family, every organization, governments, business
community, global powers, global organizations have to come together to stop these
as a collective and effective methodology is required to stop this downfall. As this
has been a long process of degeneration, we won’t be able to reverse it or even stop
it in an instant and this shall take time. But efforts have to be put in by every
individual like planting more tress, less usage of vehicles, use less electricity, spread
this awareness to others, etc. Governments and Nations have to step forward and
pass on this message through every medium possible so more and more people
understand the importance of this message and start acting.
1.3 Impact of CO2 Use on Environment
Weather changes are due to the combined effects of global warming, greenhouse
gas emissions, etc and this is clearly being seen everywhere by all of us. Steady
7
Paraphrase This Document
Need a fresh take? Get an instant paraphrase of this document with our AI Paraphraser
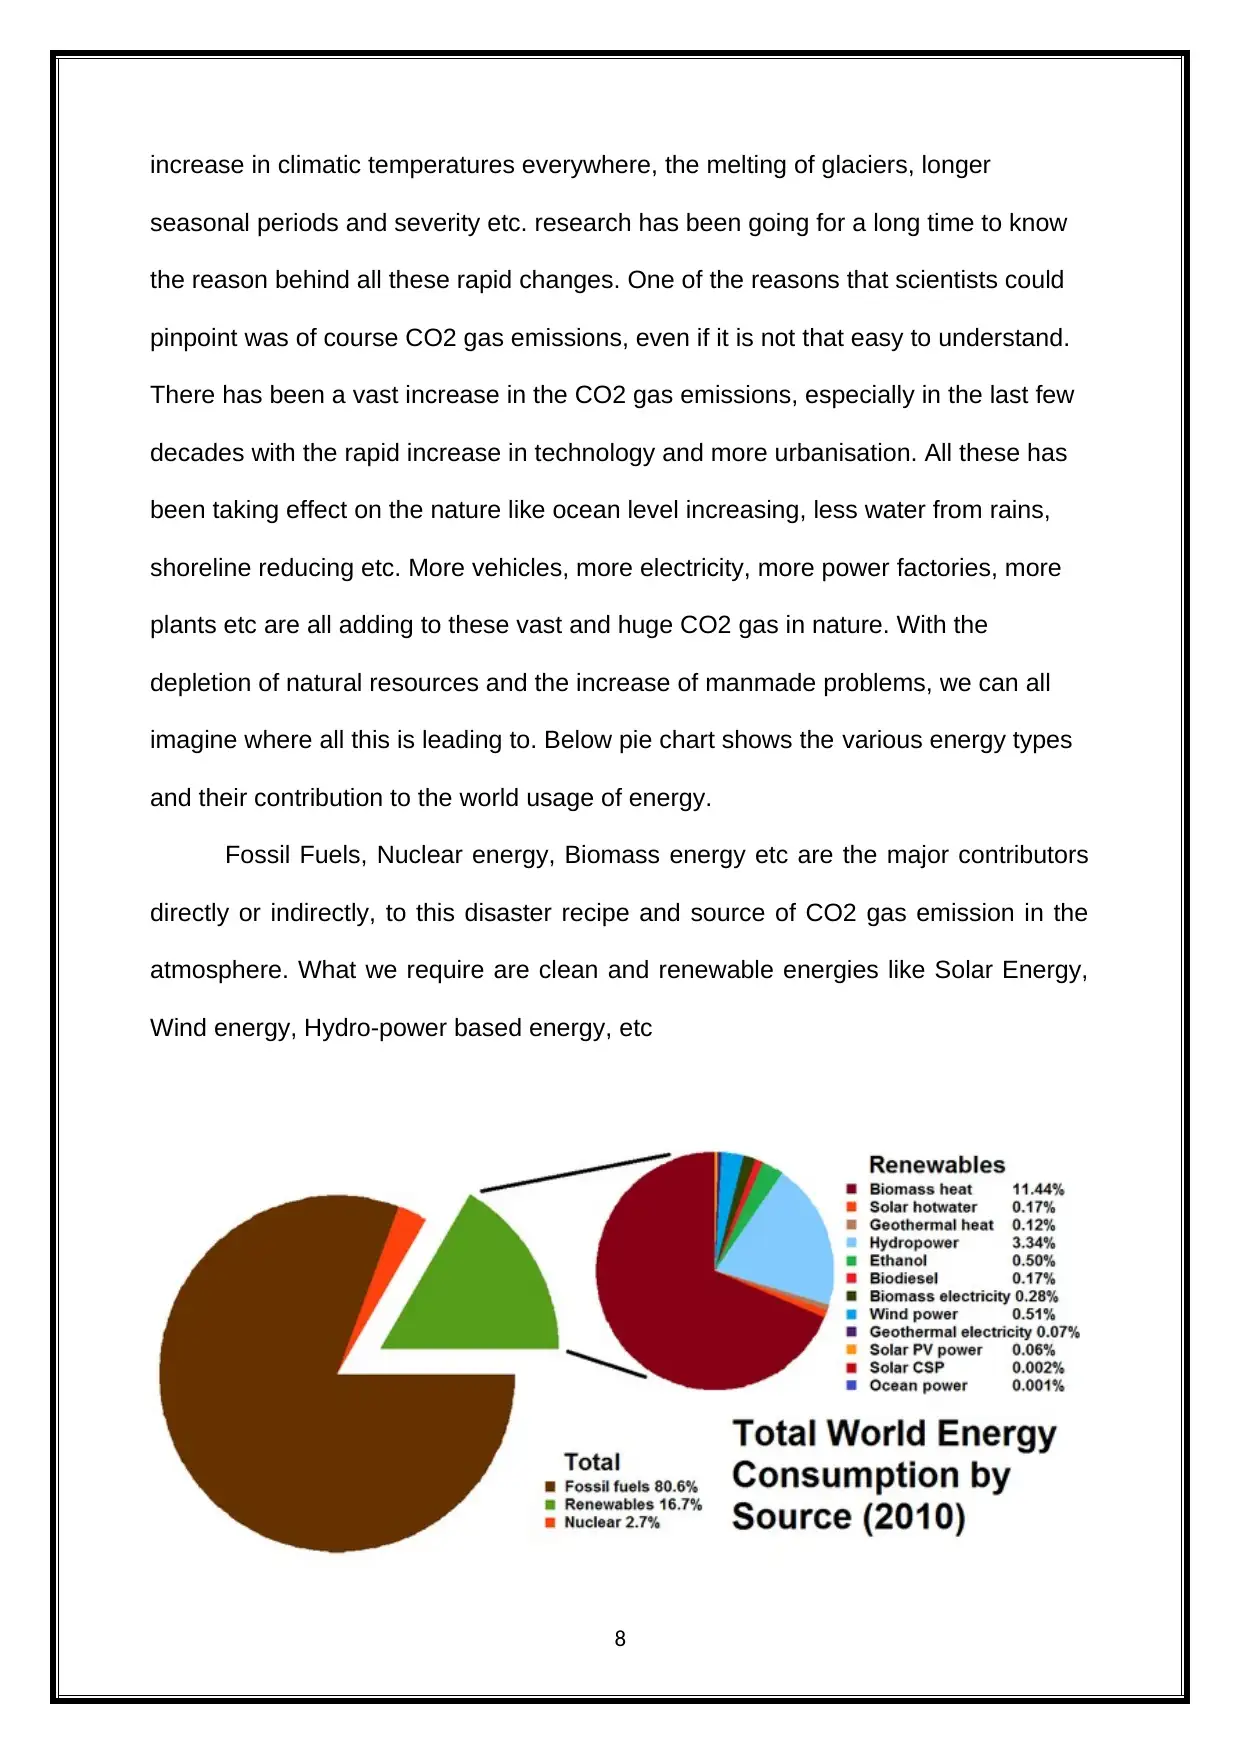
increase in climatic temperatures everywhere, the melting of glaciers, longer
seasonal periods and severity etc. research has been going for a long time to know
the reason behind all these rapid changes. One of the reasons that scientists could
pinpoint was of course CO2 gas emissions, even if it is not that easy to understand.
There has been a vast increase in the CO2 gas emissions, especially in the last few
decades with the rapid increase in technology and more urbanisation. All these has
been taking effect on the nature like ocean level increasing, less water from rains,
shoreline reducing etc. More vehicles, more electricity, more power factories, more
plants etc are all adding to these vast and huge CO2 gas in nature. With the
depletion of natural resources and the increase of manmade problems, we can all
imagine where all this is leading to. Below pie chart shows the various energy types
and their contribution to the world usage of energy.
Fossil Fuels, Nuclear energy, Biomass energy etc are the major contributors
directly or indirectly, to this disaster recipe and source of CO2 gas emission in the
atmosphere. What we require are clean and renewable energies like Solar Energy,
Wind energy, Hydro-power based energy, etc
8
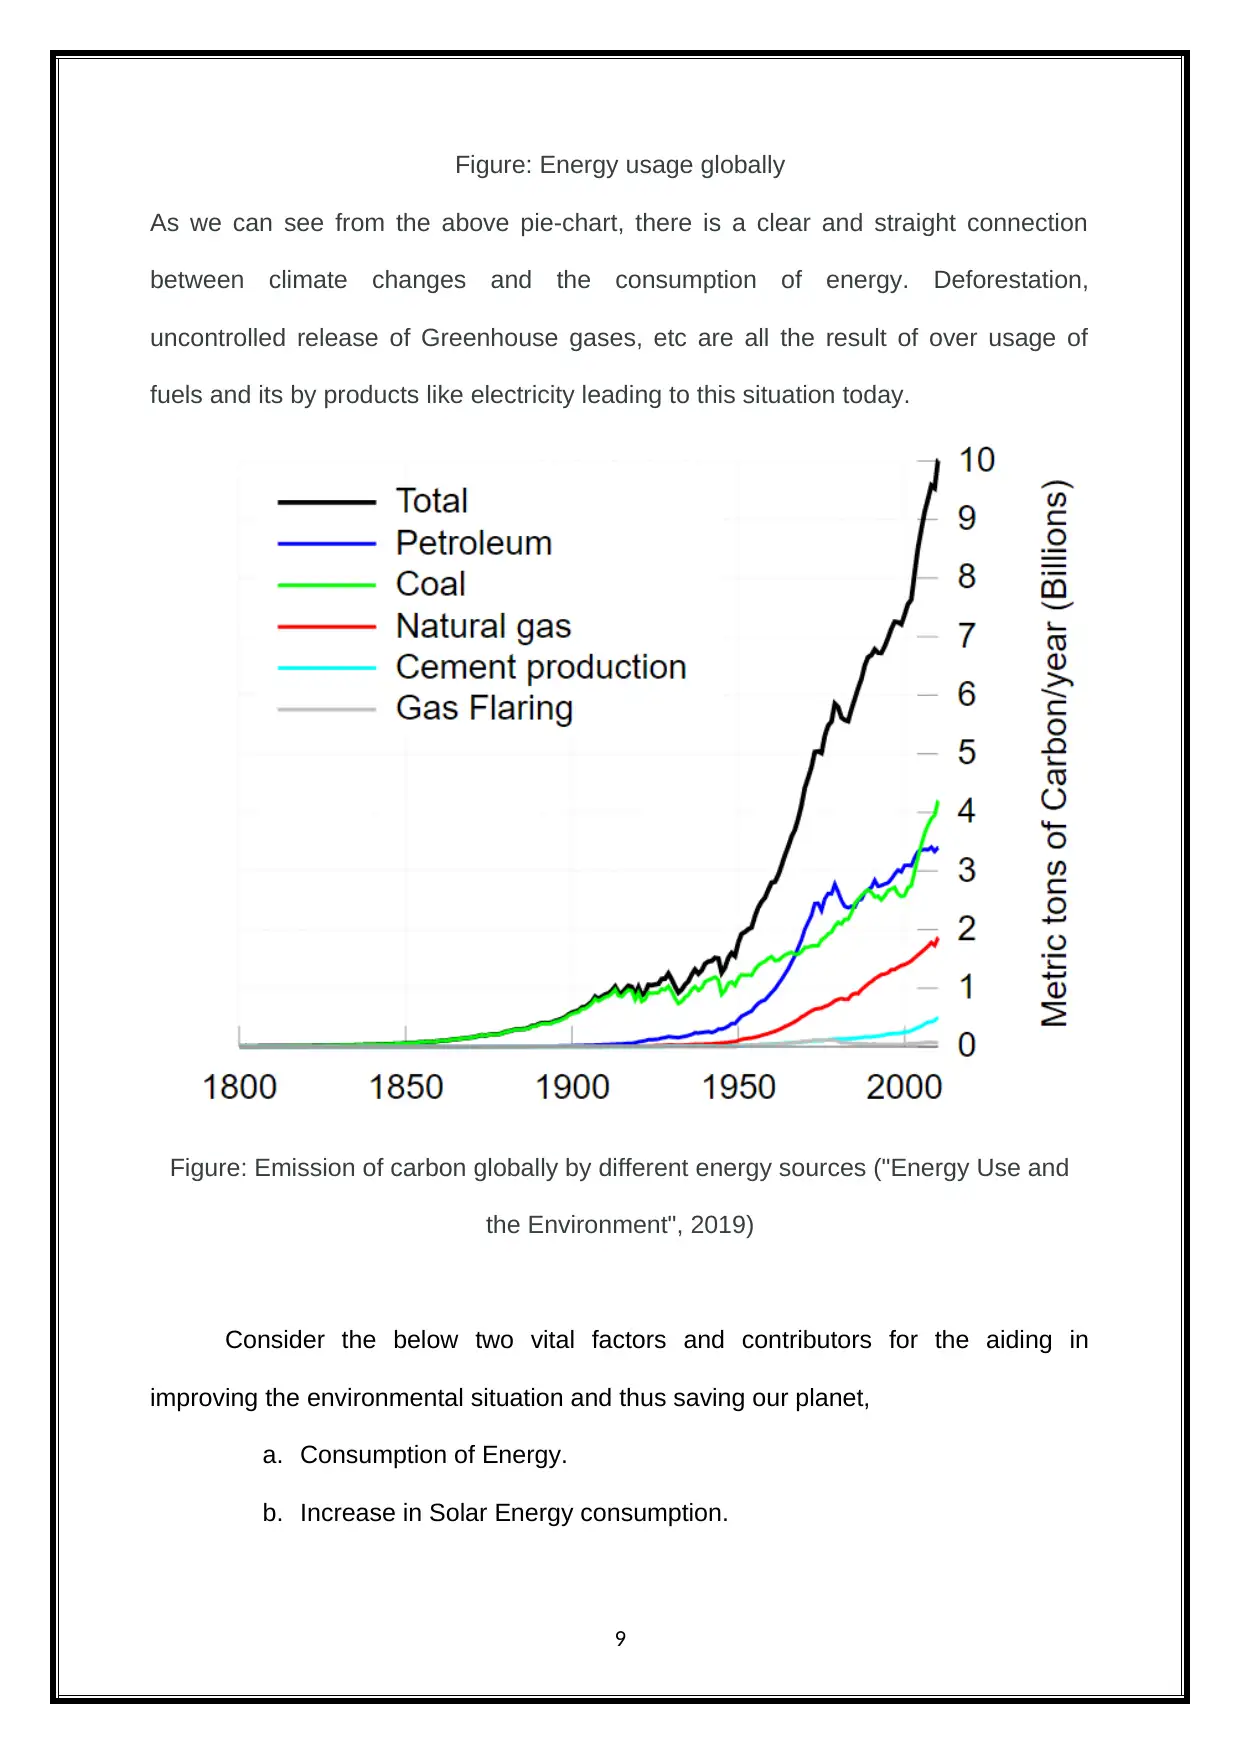
Figure: Energy usage globally
As we can see from the above pie-chart, there is a clear and straight connection
between climate changes and the consumption of energy. Deforestation,
uncontrolled release of Greenhouse gases, etc are all the result of over usage of
fuels and its by products like electricity leading to this situation today.
Figure: Emission of carbon globally by different energy sources ("Energy Use and
the Environment", 2019)
Consider the below two vital factors and contributors for the aiding in
improving the environmental situation and thus saving our planet,
a. Consumption of Energy.
b. Increase in Solar Energy consumption.
9
⊘ This is a preview!⊘
Do you want full access?
Subscribe today to unlock all pages.
Trusted by 1+ million students worldwide
2. Business Intelligence Reporting Solution with the help of
Analytics
Better data quality, filtration, sorting, analysing, bifurcation and improvement in
evaluation of information shall lead to making smart choices and decisions.
Business Intelligent tools usage for the above method plus getting data from all the
various sources, internal/ external, emails, data extractions, past history, third party
systems, historical data, etc to make the correct and meaningful decisions.
Ideal business intelligence tools and software’s are those which on their own can
carry out the functions of doing an in-depth studies and analysis of sorted out data
for the growth and overall progress of the company. Assessing the data sets and
information by evaluation procedures and methods, the user can extract this
information from any place and getting support from the mobile platforms,
applications, cloud deployment, BI analysis help, and user can make the most
optimal decisions. Displaying the outcomes, by making use of key parameters,
graphic displays, data markers, dashboards are the powerful tools for the user as
information is gathered from all the sources, filtered, analysed, distributed and the
final result placed on the dashboard for a dynamic real time report.
Thus we get a Dashboard, which is an Information system tool which control the data
flow within the system by evaluating, analysing, sorting, and providing a graphical
user interface in most important variables, data interaction and same time easy
extraction of information to give the user the ultimate real time tool for making correct
and meaningful decisions for future growth. Letting the different sectors to combine
together more effectively, making use of the different business intelligence (BI)
environmental conditions and thus, give better and increased level of decision
10
Paraphrase This Document
Need a fresh take? Get an instant paraphrase of this document with our AI Paraphraser
making power. Interactive evaluation power for vital business problems and real time
query answers with dynamic updating, gives users immense powers for correct
outcomes. With features like information zooming, in-depth time periods, parameters
for sorting data, type specific variables etc, we can have a lot of various outlooks and
perspectives at the same problem and same data sets.
Very efficient and interactive platforms, the SAP Business Intelligence
contains models which can be modified and sorted as per the users preference for
the required outcomes as per the thought process of the user and decision making
individuals. Creating the necessary dashboard by making use of advanced
evaluation tools and analytical powers, is possible by recognizing the changing test
data patterns and trends for the potential outcomes. SAP Business Intelligence tools
gives the power to organizations with their all-round system wide sharing
functionalities with the information distribution and decision making power by utilising
the dashboard tool for right usage of information sharing.
2.1 Descriptive Analysis
Descriptive analysis is the process of less descriptive coefficient that controls
the datasets as a sample of the entire date set or a part of that data set. Basically, it
is the initial level at which the dataset analysing which makes the summary of past
data sets to give important and meaningful data for further usage and evaluation.
The factors that influence the Descriptive Analysis are measures of variability
(spread)-standard deviation is the parameter, and measured for central tendency
whose parameters are the mean, median, and mode. All these factors and variables
combine and use all the current data with the mix of the historical data to give
meaningful and result oriented outcomes (McBride, 2015).
11
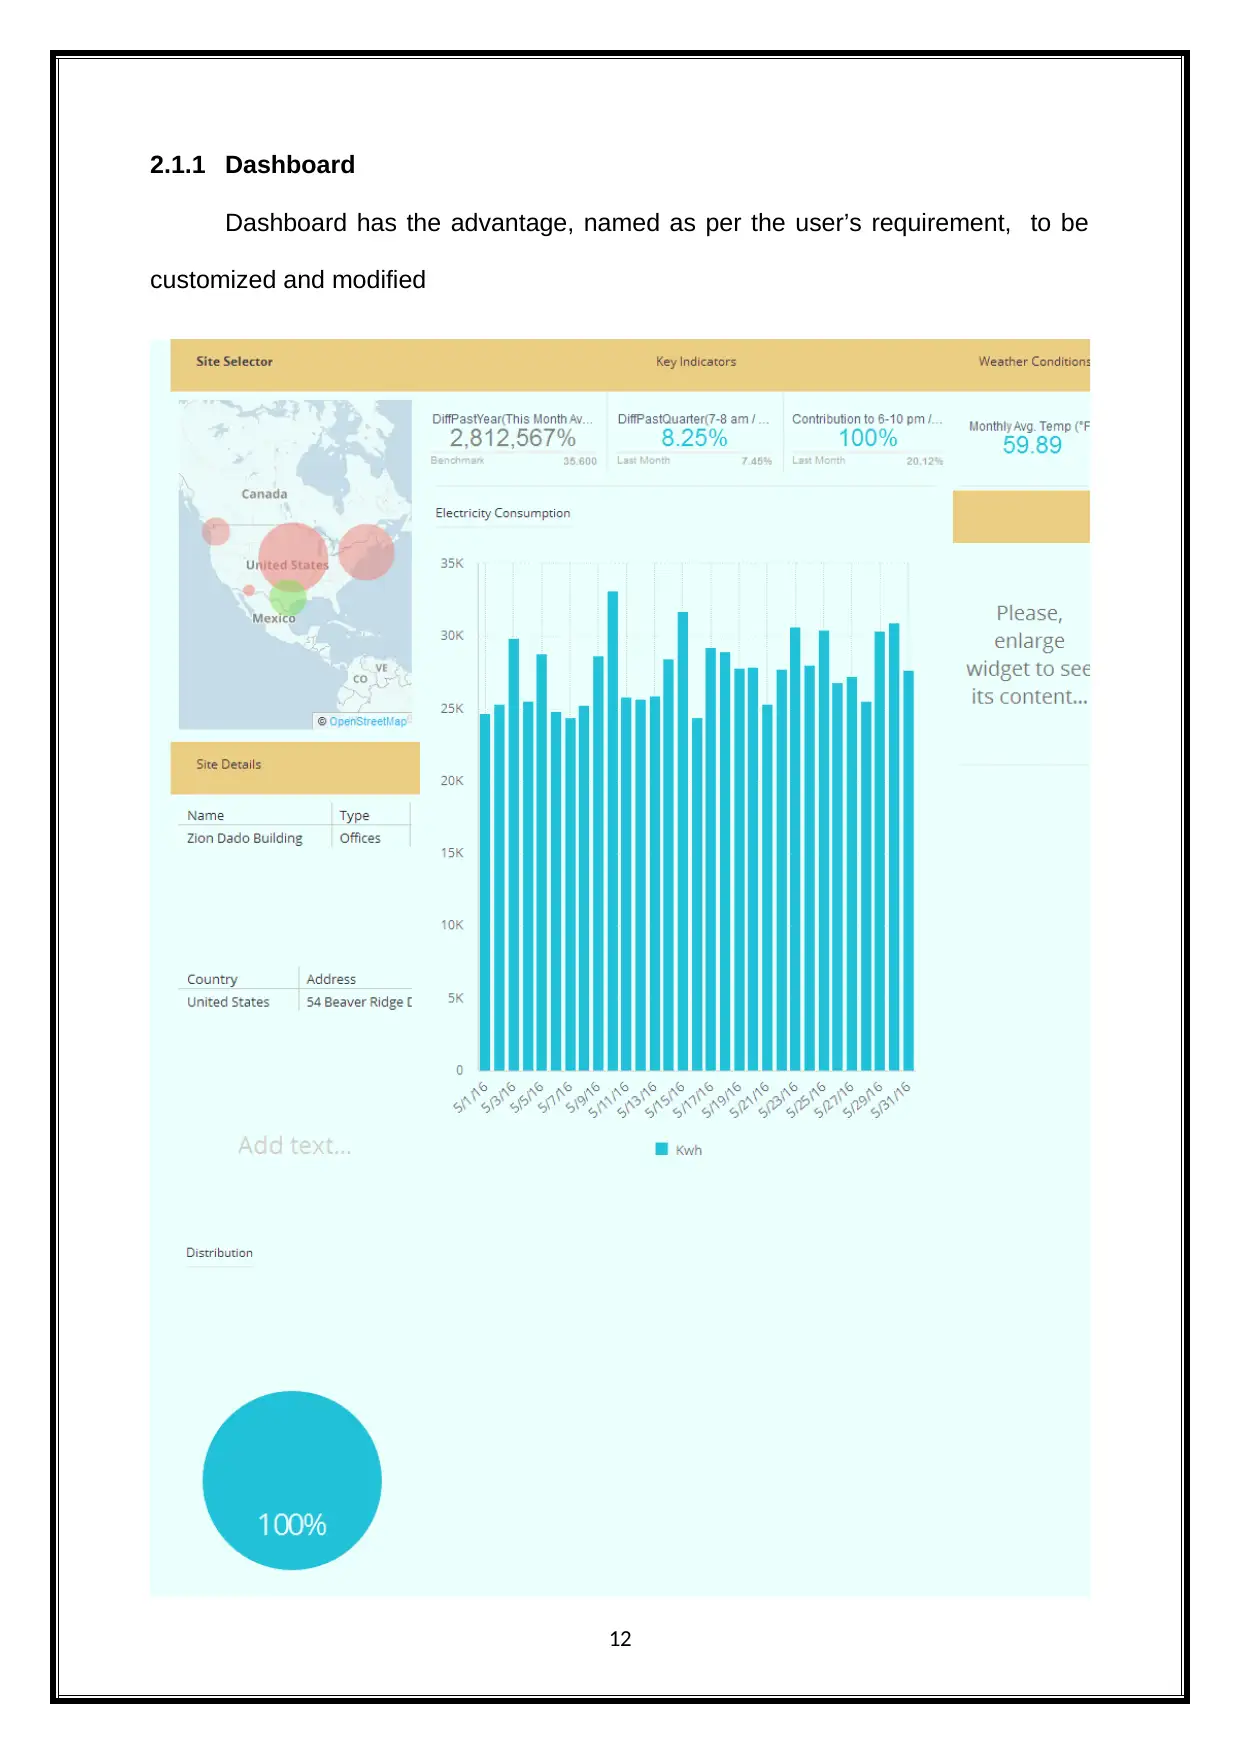
2.1.1 Dashboard
Dashboard has the advantage, named as per the user’s requirement, to be
customized and modified
12
Dashboard has the advantage, named as per the user’s requirement, to be
customized and modified
12
⊘ This is a preview!⊘
Do you want full access?
Subscribe today to unlock all pages.
Trusted by 1+ million students worldwide
1 out of 25
Related Documents


Your All-in-One AI-Powered Toolkit for Academic Success.
+13062052269
info@desklib.com
Available 24*7 on WhatsApp / Email
![[object Object]](/_next/static/media/star-bottom.7253800d.svg)
Unlock your academic potential
Copyright © 2020–2026 A2Z Services. All Rights Reserved. Developed and managed by ZUCOL.