ITECH7410 Software Engineering: State Transition Diagram - Oral-B 5000
VerifiedAdded on ย 2023/06/12
|10
|1629
|255
Practical Assignment
AI Summary
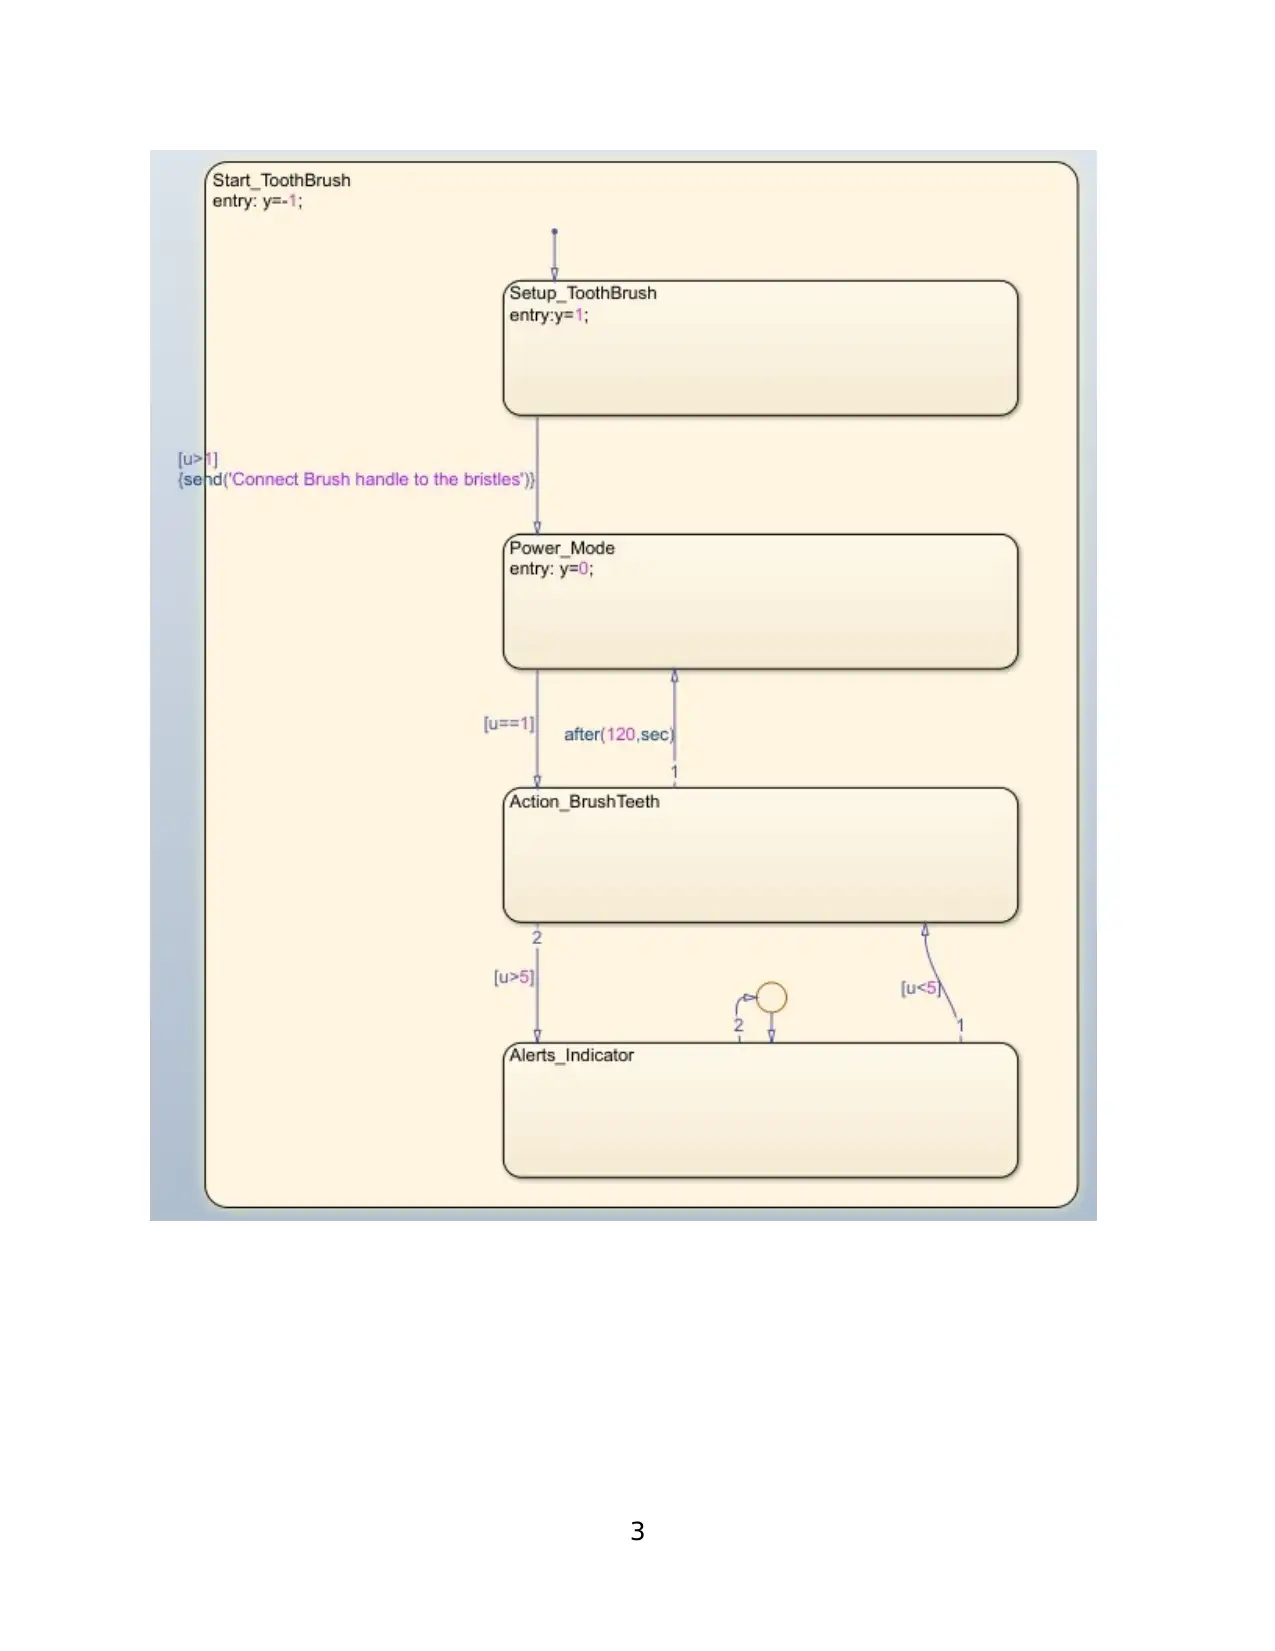
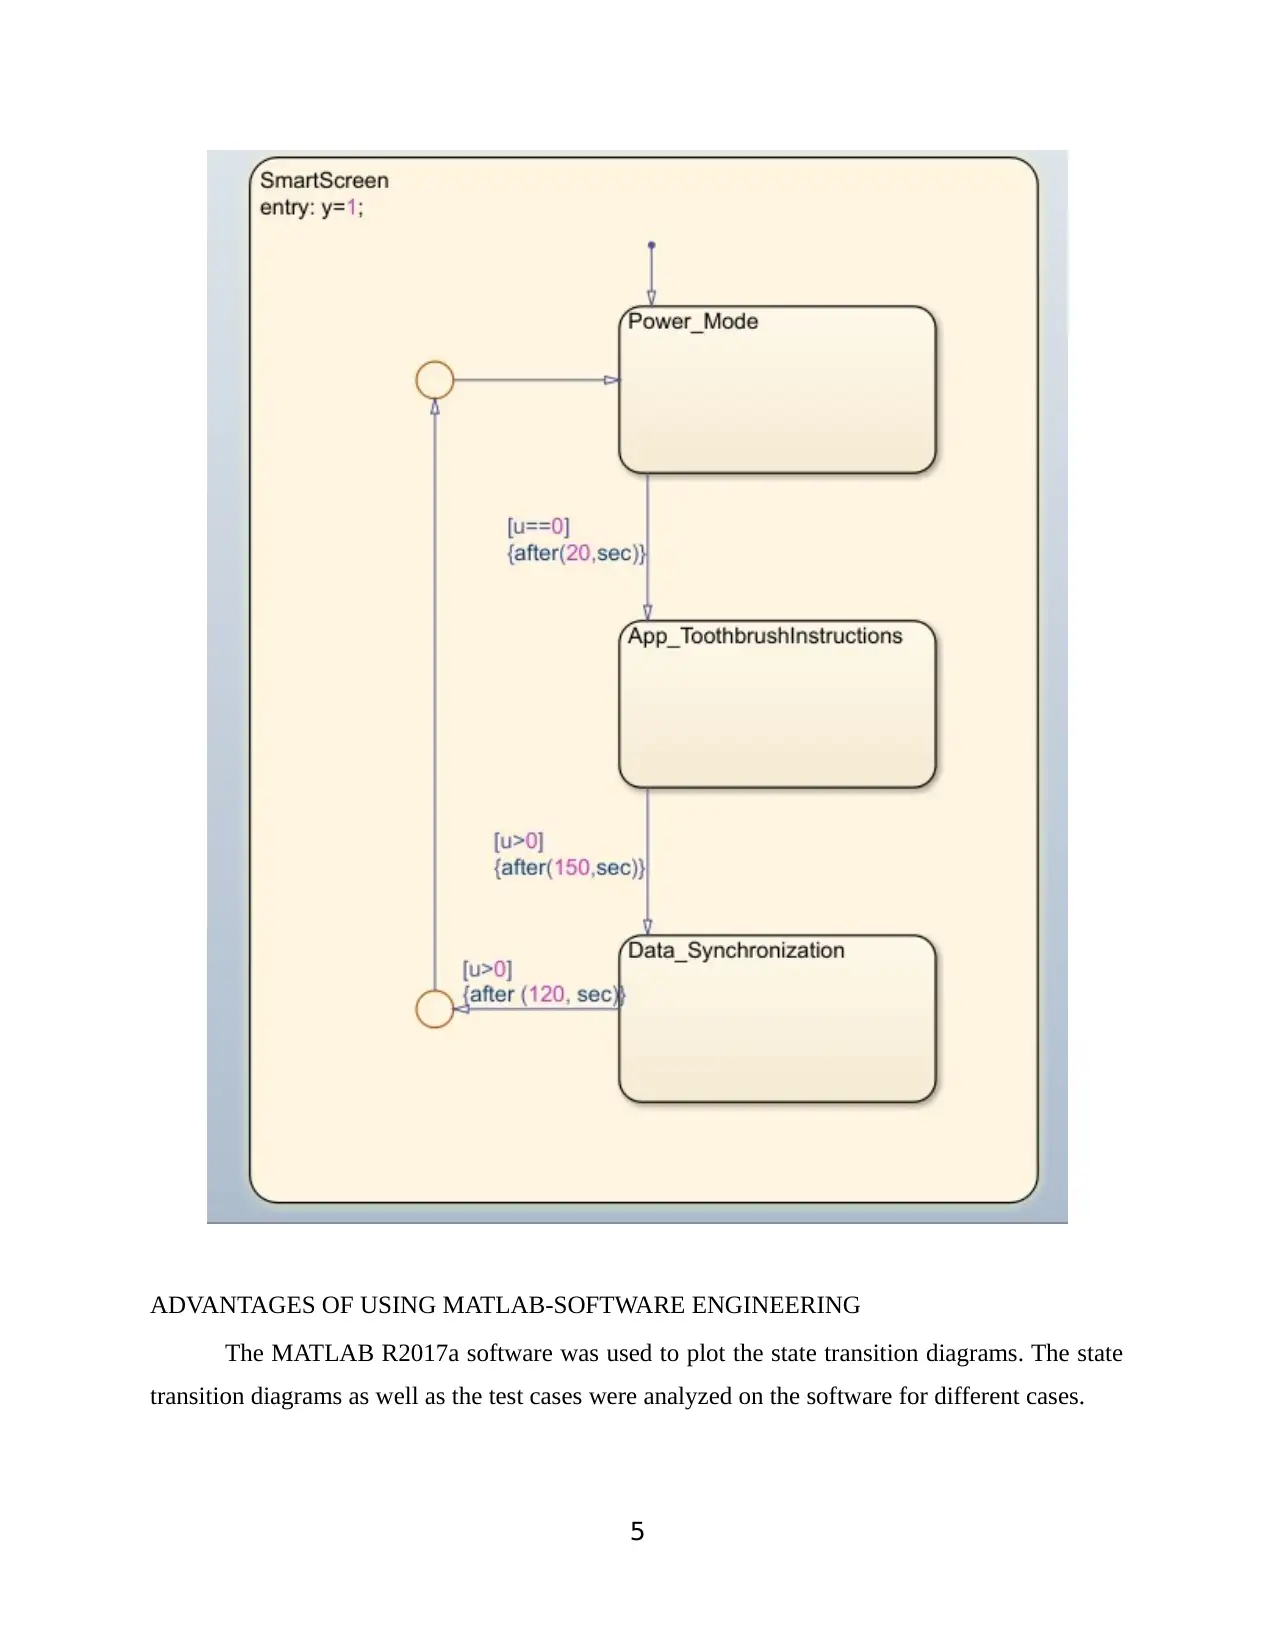
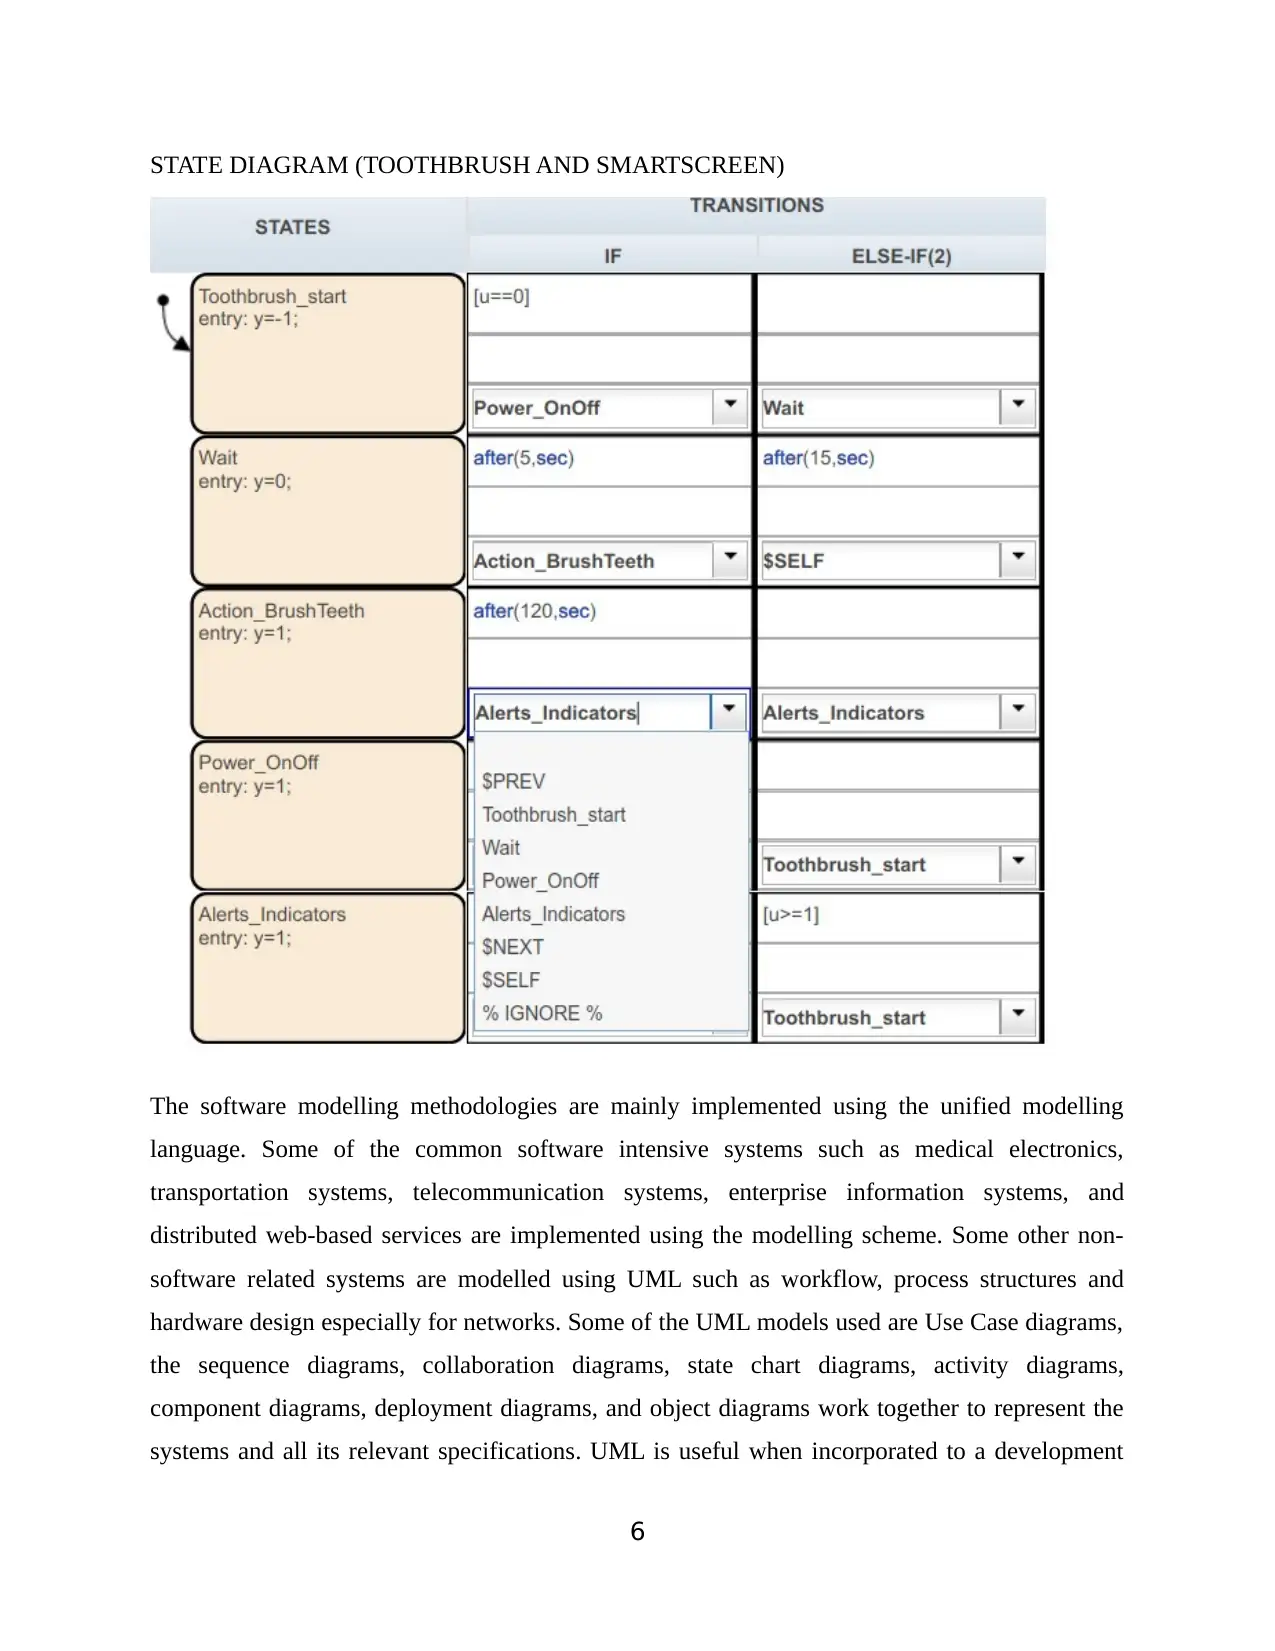
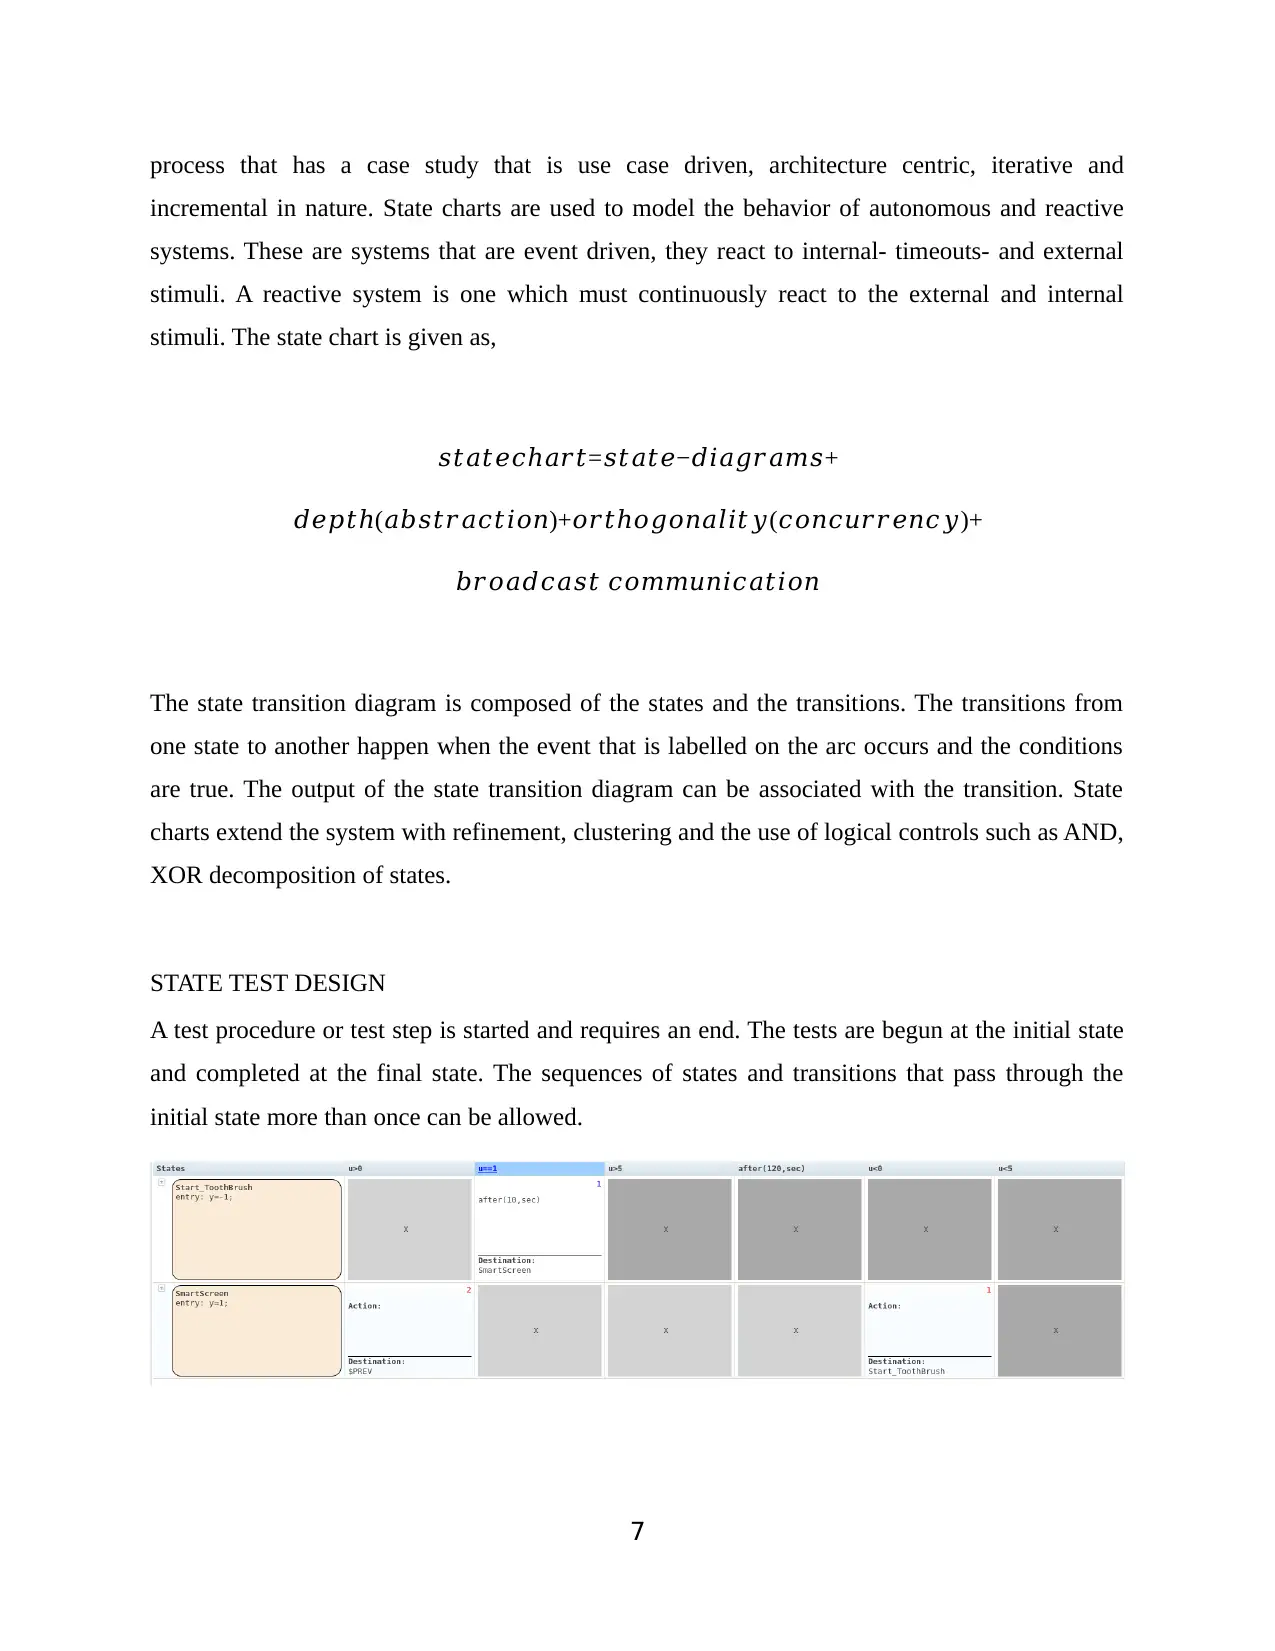
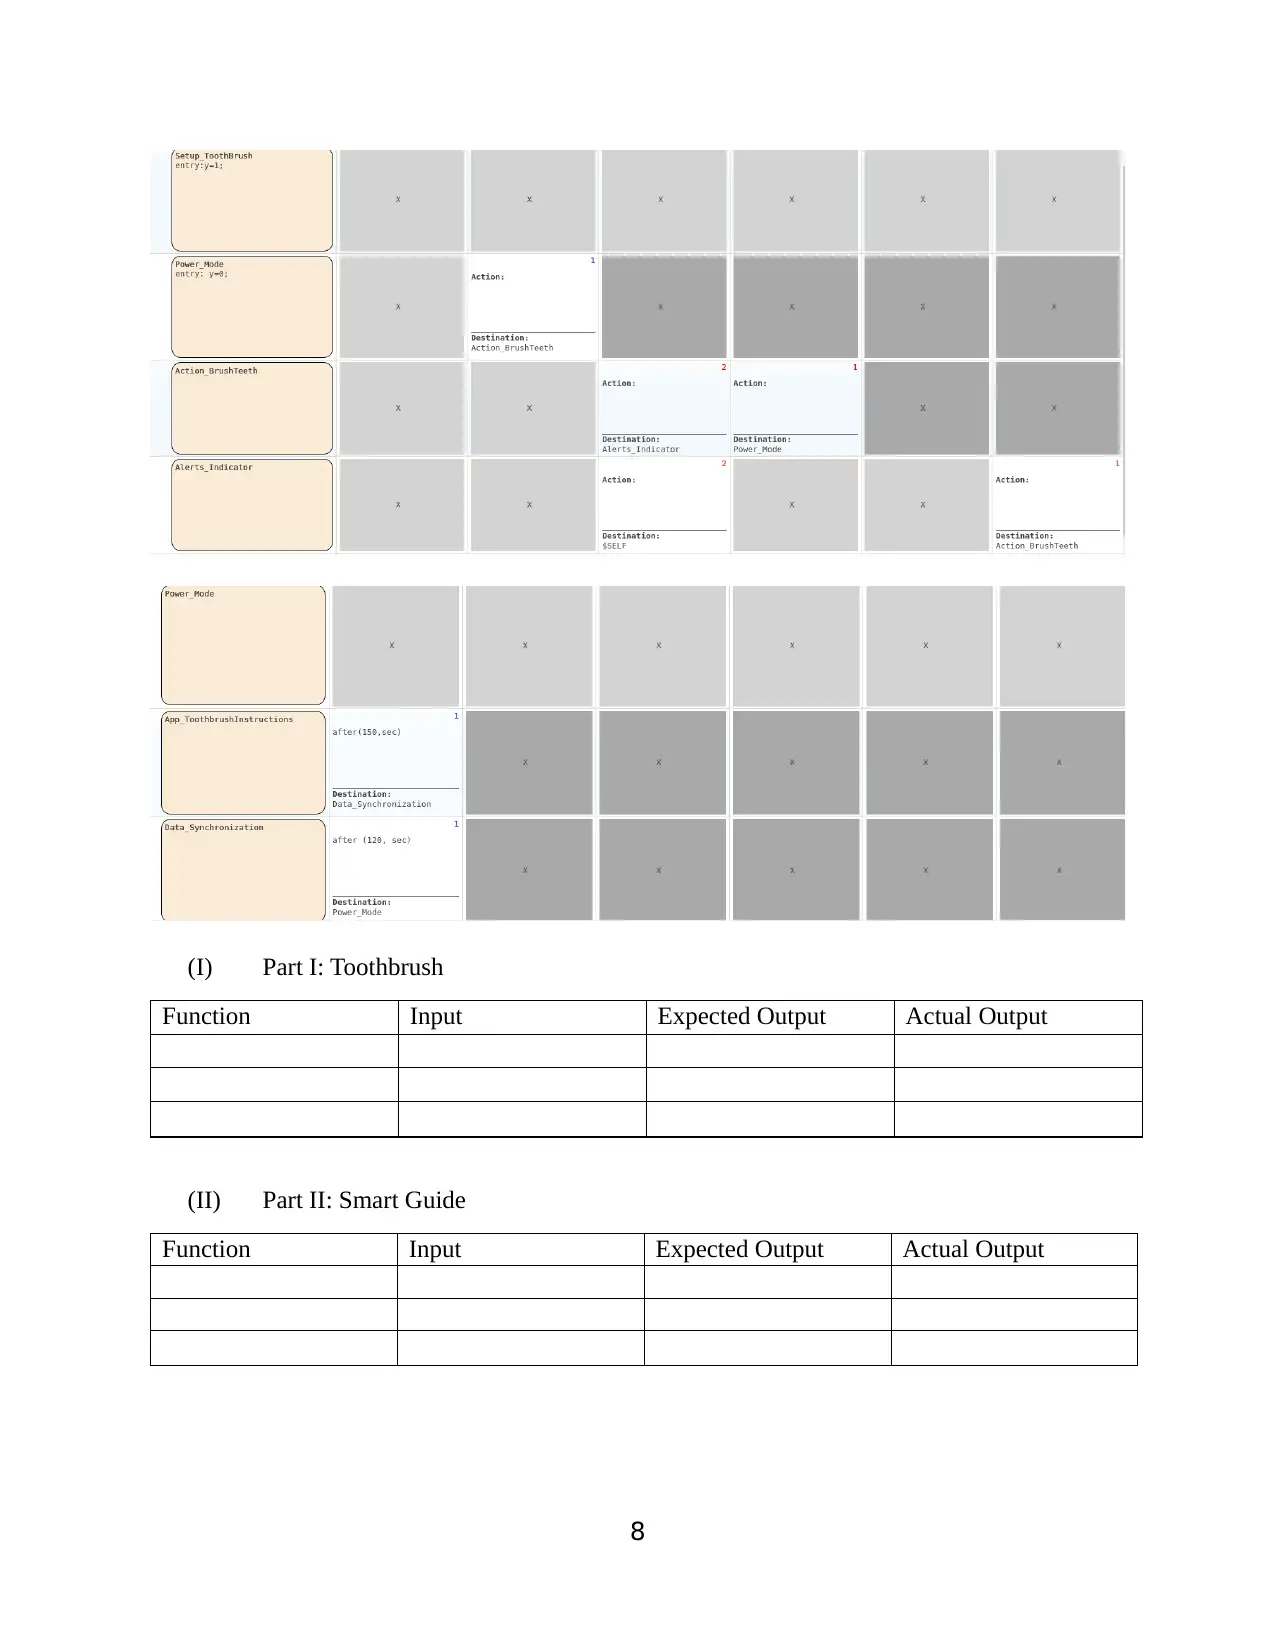
This assignment presents a state transition diagram for the Oral-B Braun 5000 electric toothbrush, developed for the ITECH7410 Software Engineering Methodologies course. It analyzes the toothbrush's functionalities and its interaction with the SmartGuide, creating a visual representation of its states and transitions using MATLAB R2017a software. The diagram covers aspects such as brushing modes, connectivity with a smartphone app via Bluetooth, and the SmartGuide features. The assignment also includes test design and analysis, referencing software engineering principles and UML modeling techniques to ensure a comprehensive understanding of the system's behavior. The state transition diagram composed of the states and the transitions. The transitions from one state to another happen when the event that is labelled on the arc occurs and the conditions are true. The output of the state transition diagram can be associated with the transition.

FEDERATION UNIVERSITY AUSTRALIA
ITECH7410
SOFTWARE ENGINEERING METHODOLOGIES
TITLE:
ORAL-B BRAUN 5000 ELECTRIC TOOTHBRUSH
PRESENTED BY:
STUDENT NAME
STUDENT REGISTRATION NUMBER
ITECH7410
SOFTWARE ENGINEERING METHODOLOGIES
TITLE:
ORAL-B BRAUN 5000 ELECTRIC TOOTHBRUSH
PRESENTED BY:
STUDENT NAME
STUDENT REGISTRATION NUMBER
Paraphrase This Document
Need a fresh take? Get an instant paraphrase of this document with our AI Paraphraser

ORAL-B BRAUN 5000 ELECTRIC TOOTHBRUSH
INTRODUCTION
The oral-B Braun toothbrush has very appealing features that are helpful in improved
dental hygiene. The toothbrush can be used to clean the sensitive areas in the mouth such as the
gums and the tongue as well as brush all the sides of the tooth and floss the inside sections of the
teeth so as to floss. There are three main modes which a user can choose from out of the 5
specialized modes namely the daily mode, the deep cleaning mode and the sensitive mode. When
the users interact with the toothbrush for the first time, it may cause the teeth to bleed slightly but
in such a situation, a user is advised to load the sensitive mode until they get used to using the
toothbrush. The toothbrush has several parts namely the brush head, SmartScreen that contains
the light indicators, brushing mode display, timer and power charge alert mode. The SmartScreen
is held at the brush handle. The toothbrush is useful in the timely cleaning of teeth and the
toothbrush is very thorough in its cleaning and flossing process.
It is recommended for use by persons who have reduced physical, sensory, and mental abilities.
The user may not have the necessary experience or knowledge and as such may require to have
been given supervision or instruction concerning the use of the appliance in a safe way. This
Toothbrush has an extended feature beyond the electric brushing; it can connect to oneโs
smartphone. The connection to the phone requires communication via an application. The radio
transmission is deactivated to avoid occurrence of electromagnetic interference and compatibility
conflicts. The toothbrush allows the user to set the brushing modes according to their preference.
There are a number of brush heads that Oral-B offers that can fit the standard brush handle.
These brush heads are the Cross-Action brush head and the Floss-Action brush heads. These two
are packaged alongside the brush handle and they provide for the total cleansing of the teeth.
The state charts are used to comprehend and describe with finely the system or item behavior.
The diagrams are used for analysis and design. They describe the attributes and behavior of the
application objects. For this case study, the states are the two objects namely the toothbrush and
the Smart phone app known as the SmartScreen. The state charts are used in modelling, a
common practice in engineering designs. The use of state transition diagram is to enable the
visualization of the operation of the real-life system, it specifies the structure and the behavior as
well as providing a template to enable one to understand and implement the system. The state
1

persists until something external happens usually triggering a transition. A state can persist for an
indefinite period. On the other hand, an event occurs, either instantly or in a limited, finite
period. It is the occurring activity. It is the external occurrence that triggers the transition. An
action is the response of the system during the transition. It is either instantaneous or it requires a
limited, finite period. The state transition diagrams can be represented in different manner based
on the customerโs perception and the systemโs perception.
FUNCTIONALITIES OF THE ELECTRIC TOOTHBRUSH
๏ผ The toothbrush has a battery unit or charging unit which stores the power for use.
๏ผ It has a SmartScreen which allows the toothbrush to connect to the phone App. The
smartphone App can run on iOS or Android Operating Systems. The App guides one
through the entire Bluetooth pairing procedure. The smartphone needs to be in a close
proximity of about 5m distance. It is recommended to place the connecting smartphone
safely in a dry place. The smartphone holder can hold your smartphone while using.
Make sure your phone fits the stand and keeps stable.
๏ผ The Bluetooth 4.0 wireless technology is employed to enable connection with the iOS or
Android based smartphone.
๏ผ During the setup, the toothbrush is wet and toothpaste is applied on it. The timer is set to
either the professional mode timer or the 2 minutes timer.
๏ผ The App is started. It synchronizes with the toothbrush when powered on. It takes some
few seconds to start and then it displays the brush modes and other instructions.
STATE TRANSITION DIAGRAM
2
โ This is a preview!โ
Do you want full access?
Subscribe today to unlock all pages.

Trusted by 1+ million students worldwide

3
Paraphrase This Document
Need a fresh take? Get an instant paraphrase of this document with our AI Paraphraser

FUNCTIONALITIES OF THE SMARTGUIDE
๏ผ The toothbrush has a battery unit or charging unit which stores the power for use.
๏ผ The smart guide comes with a demonstration mode. The mode is deactivated by
removing the compartment cover in the back and pushing the time setting button. A
flashing timer indicates that one can now adjust the time.
๏ผ The smart guide sets the toothbrush to daily mode depending on the brushing modes
chosen. The 5 brushing modes displayed are:
STATE TRANSITION DIAGRAM
4

ADVANTAGES OF USING MATLAB-SOFTWARE ENGINEERING
The MATLAB R2017a software was used to plot the state transition diagrams. The state
transition diagrams as well as the test cases were analyzed on the software for different cases.
5
The MATLAB R2017a software was used to plot the state transition diagrams. The state
transition diagrams as well as the test cases were analyzed on the software for different cases.
5
โ This is a preview!โ
Do you want full access?
Subscribe today to unlock all pages.

Trusted by 1+ million students worldwide

STATE DIAGRAM (TOOTHBRUSH AND SMARTSCREEN)
The software modelling methodologies are mainly implemented using the unified modelling
language. Some of the common software intensive systems such as medical electronics,
transportation systems, telecommunication systems, enterprise information systems, and
distributed web-based services are implemented using the modelling scheme. Some other non-
software related systems are modelled using UML such as workflow, process structures and
hardware design especially for networks. Some of the UML models used are Use Case diagrams,
the sequence diagrams, collaboration diagrams, state chart diagrams, activity diagrams,
component diagrams, deployment diagrams, and object diagrams work together to represent the
systems and all its relevant specifications. UML is useful when incorporated to a development
6
Paraphrase This Document
Need a fresh take? Get an instant paraphrase of this document with our AI Paraphraser

process that has a case study that is use case driven, architecture centric, iterative and
incremental in nature. State charts are used to model the behavior of autonomous and reactive
systems. These are systems that are event driven, they react to internal- timeouts- and external
stimuli. A reactive system is one which must continuously react to the external and internal
stimuli. The state chart is given as,
๐ ๐ก๐๐ก๐๐โ๐๐๐ก=๐ ๐ก๐๐ก๐โ๐๐๐๐๐๐๐๐ +
๐๐๐๐ก (โ ๐๐๐ ๐ก๐๐๐๐ก๐๐๐)+๐๐๐กโ๐๐๐๐๐๐๐๐ก๐ฆ(๐๐๐๐๐ข๐๐๐๐๐๐ฆ)+
๐๐๐๐๐๐๐๐ ๐ก ๐๐๐๐๐ข๐๐๐๐๐ก๐๐๐
The state transition diagram is composed of the states and the transitions. The transitions from
one state to another happen when the event that is labelled on the arc occurs and the conditions
are true. The output of the state transition diagram can be associated with the transition. State
charts extend the system with refinement, clustering and the use of logical controls such as AND,
XOR decomposition of states.
STATE TEST DESIGN
A test procedure or test step is started and requires an end. The tests are begun at the initial state
and completed at the final state. The sequences of states and transitions that pass through the
initial state more than once can be allowed.
7

(I) Part I: Toothbrush
Function Input Expected Output Actual Output
(II) Part II: Smart Guide
Function Input Expected Output Actual Output
8
Function Input Expected Output Actual Output
(II) Part II: Smart Guide
Function Input Expected Output Actual Output
8
โ This is a preview!โ
Do you want full access?
Subscribe today to unlock all pages.

Trusted by 1+ million students worldwide

REFERENCES
Bass, L., Clements, P., & Kazman, R. (2008). Software Architecture in Practices. New York:
Addison-Wesley.
Bertolino, A., Fantechi, A., Gnesi, S., Lami, G., & Maccari, A. (2002). Use Case description of
requirements for product lines. International Workshop on Requirement Engineering for
Product Line (REPL02), 12-18.
Biermann, A.-W., & Krishnaswamy, R. (2006). Constructing programs from example
computations. IEEE Trans. software Engineering, 141-153.
Bosch, J. F., G., G., D., K. J., Obbink, H., & Pohl, K. (2001). Variability issues in software
product lines. 4th Workshop product family engineering (PFE4), 11-19.
D. Ross, Structured analysis (SA): A language for communicating ideas, IEEE Trans. Software
Engineering. 3 (2007) 16-34.
Khriss, I., Elkoutbi, M., Keller, R.: Automating the synthesis of UML statechart diagrams from
multiple collaboration diagrams. In: Proceedings of UMLโ98: Beyond the Notation, 1998,
pp 115โ126.
Jรฉzรฉquel, M., & Ziadi, T. (2015). Software Product line engineering with the UML deriving
products.
Oral-B. (2017). Oral-B Braun 4000-5000 series Electric Toothbrush. Retrieved April 24, 2018,
from https://www.oral-B.com
Uchitel, S., Kramer, J.: A workbench for synthesising behaviour models from scenarios. In:
Proceedings of International Conference on Software Engineering (ICSE 2001) (2001)
Whittle, J., Schumann, J.: Generating statechart designs from scenarios. In: Proceeding of
International Conference on Software Engineering (ICSE 2000) (2000)
9
1 out of 10
Related Documents

Your All-in-One AI-Powered Toolkit for Academic Success.
ย +13062052269
info@desklib.com
Available 24*7 on WhatsApp / Email
Unlock your academic potential
Copyright ยฉ 2020โ2025 A2Z Services. All Rights Reserved. Developed and managed by ZUCOL.