Comprehensive Data Analysis Report: JCU Equality at University
VerifiedAdded on 2020/03/04
|18
|1606
|65
Report
AI Summary
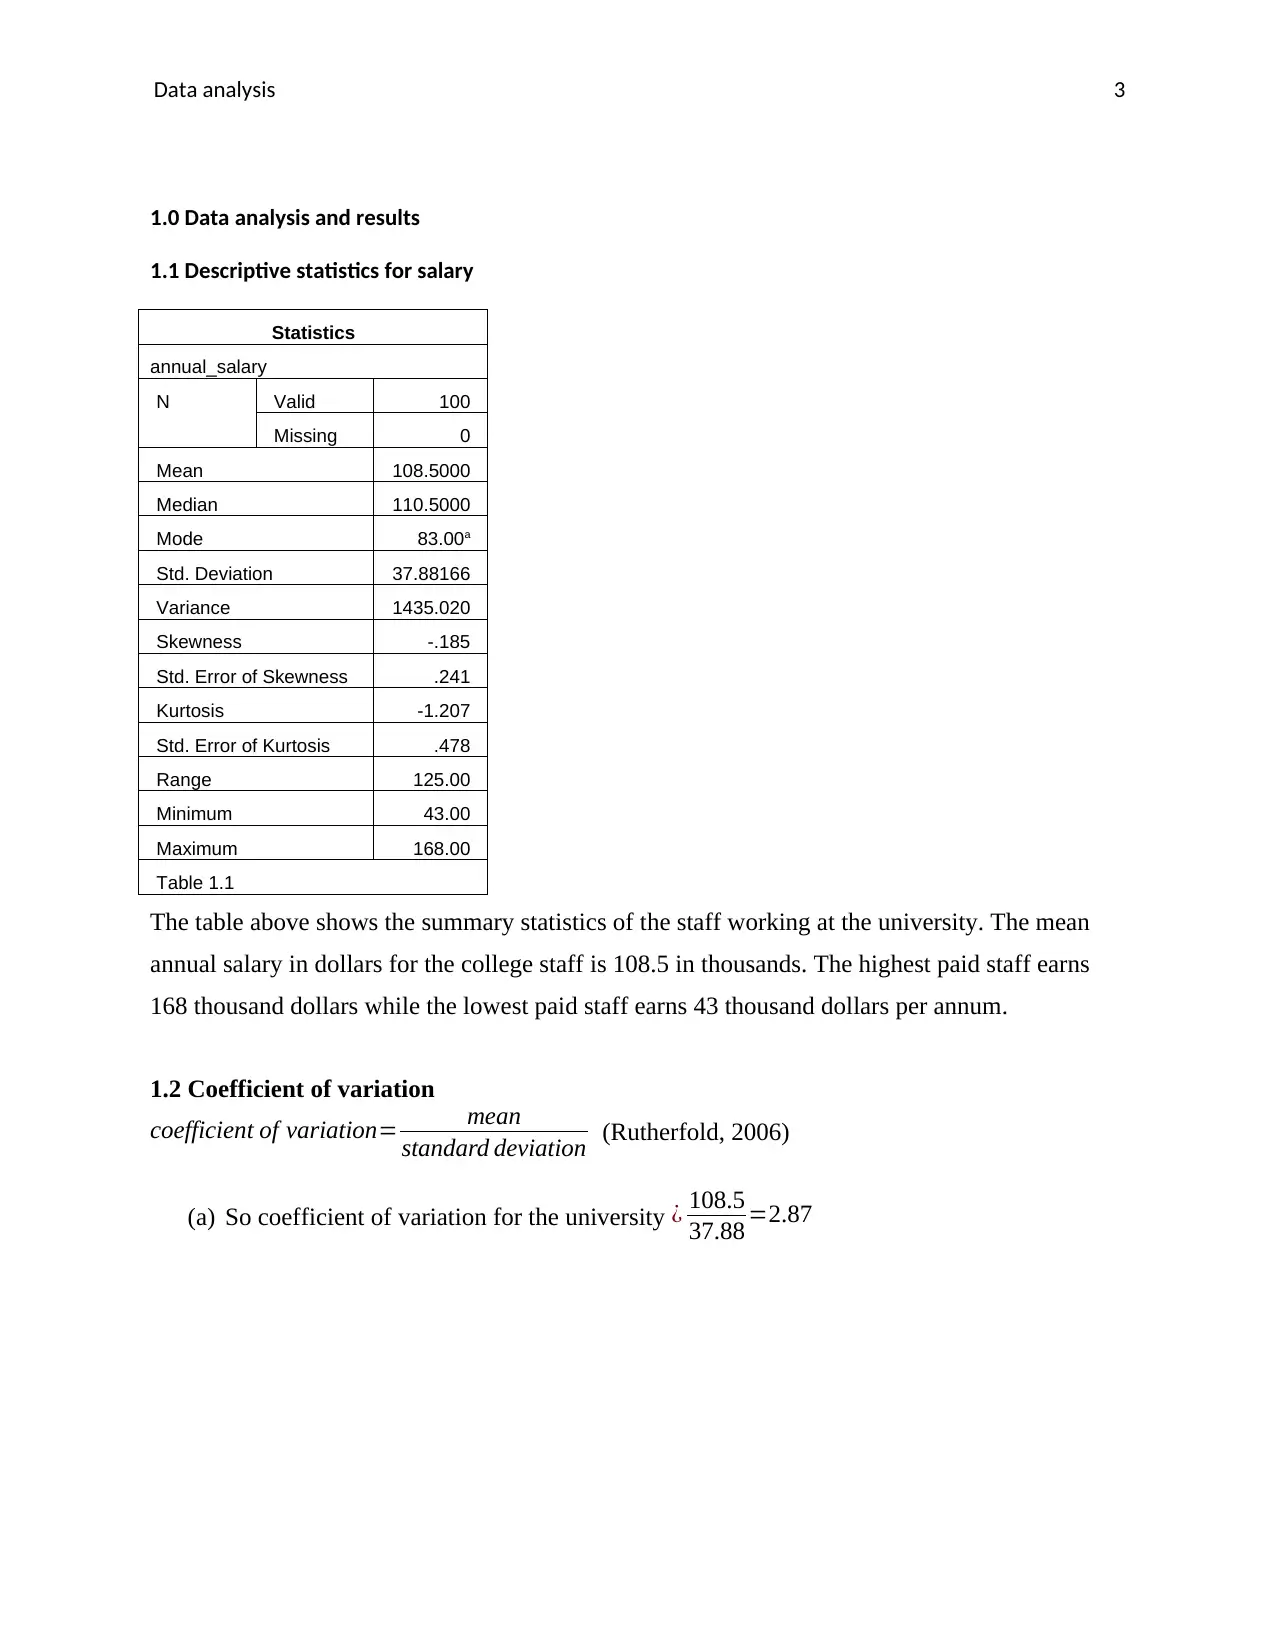
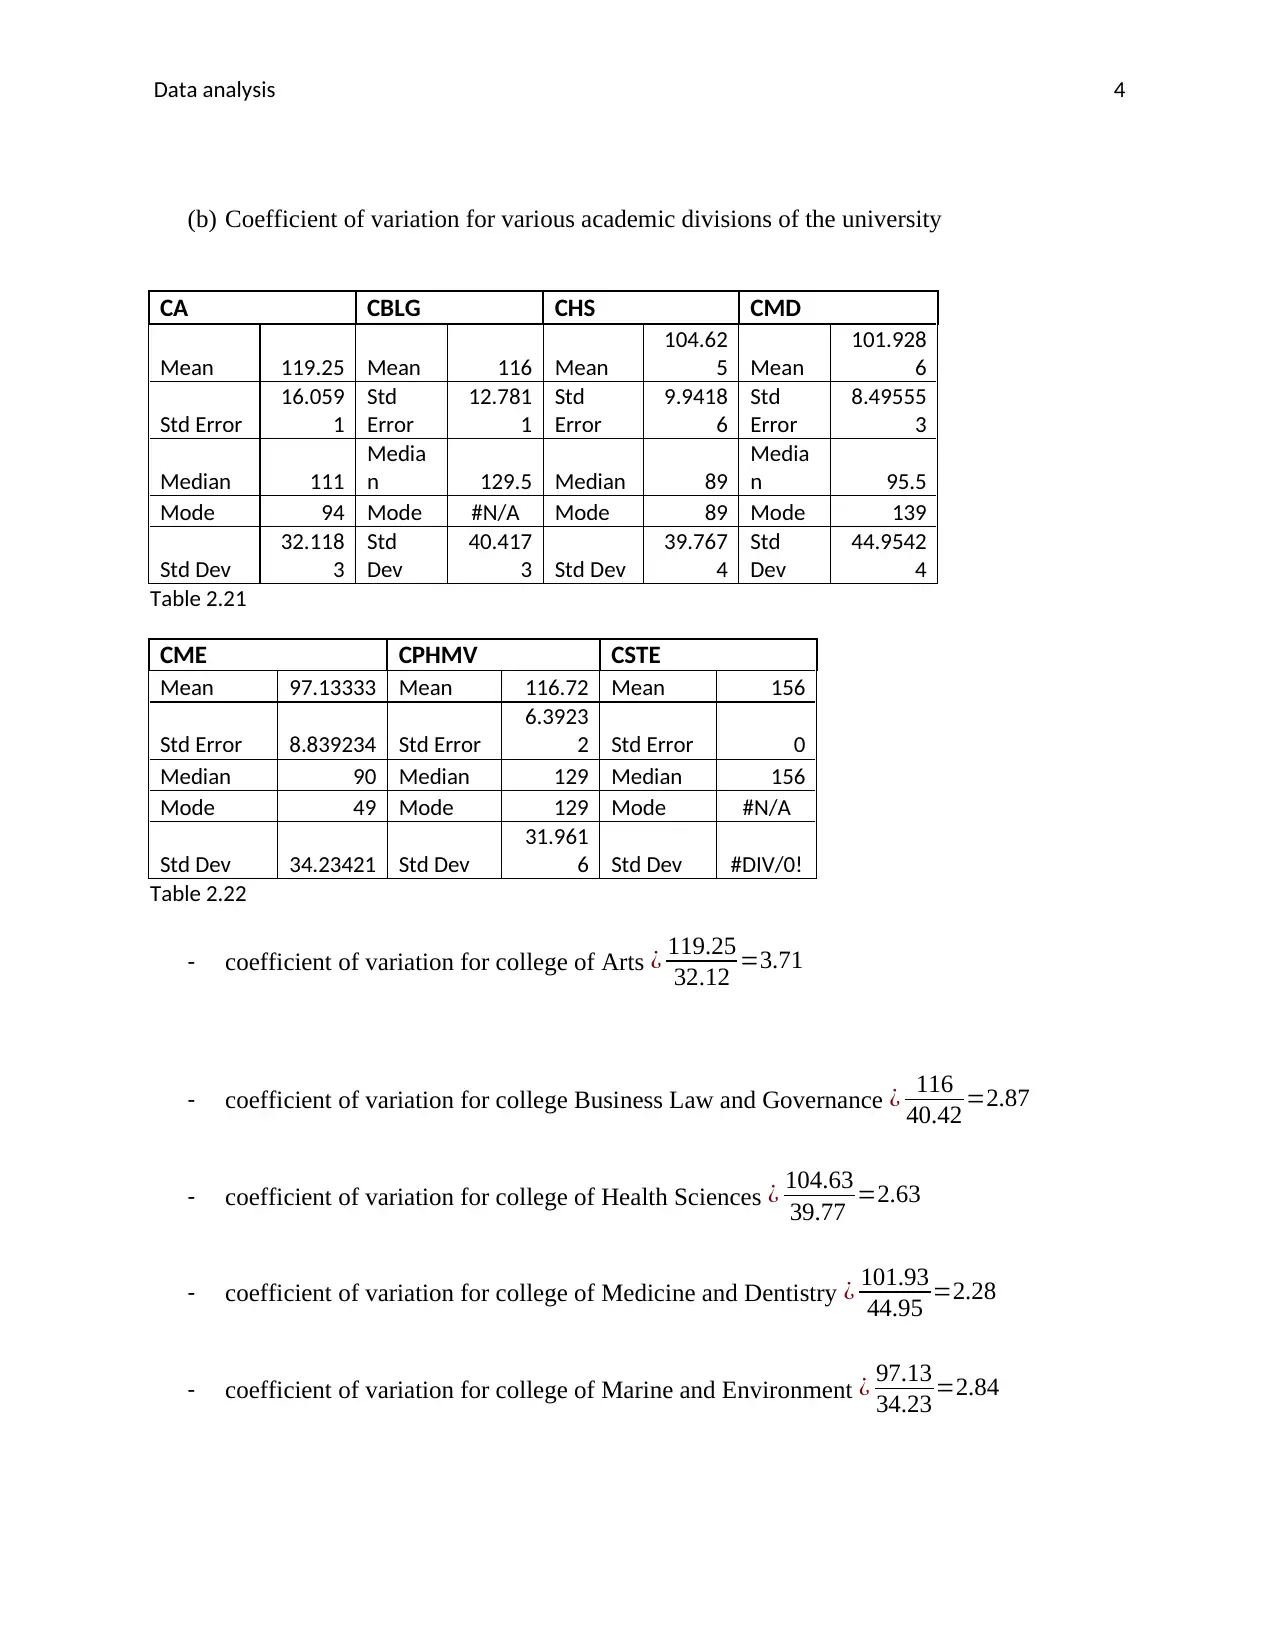
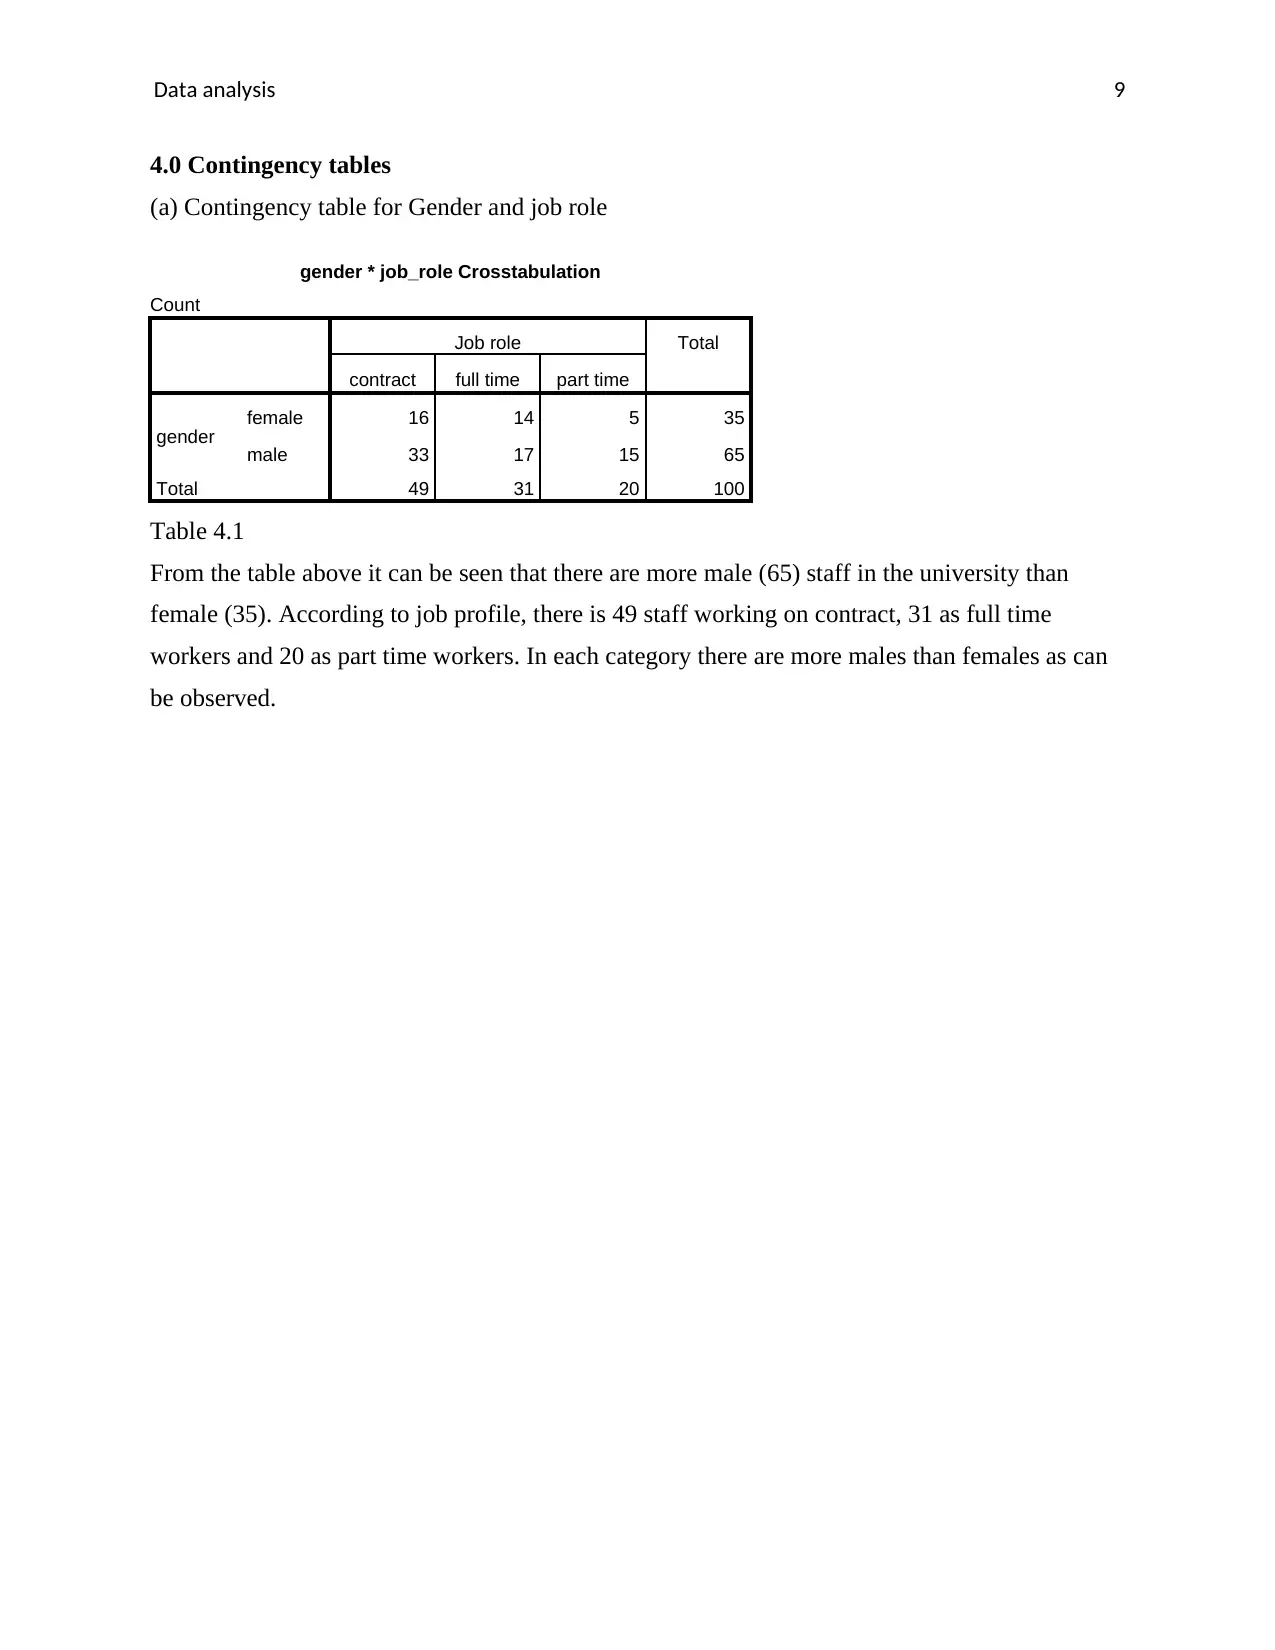
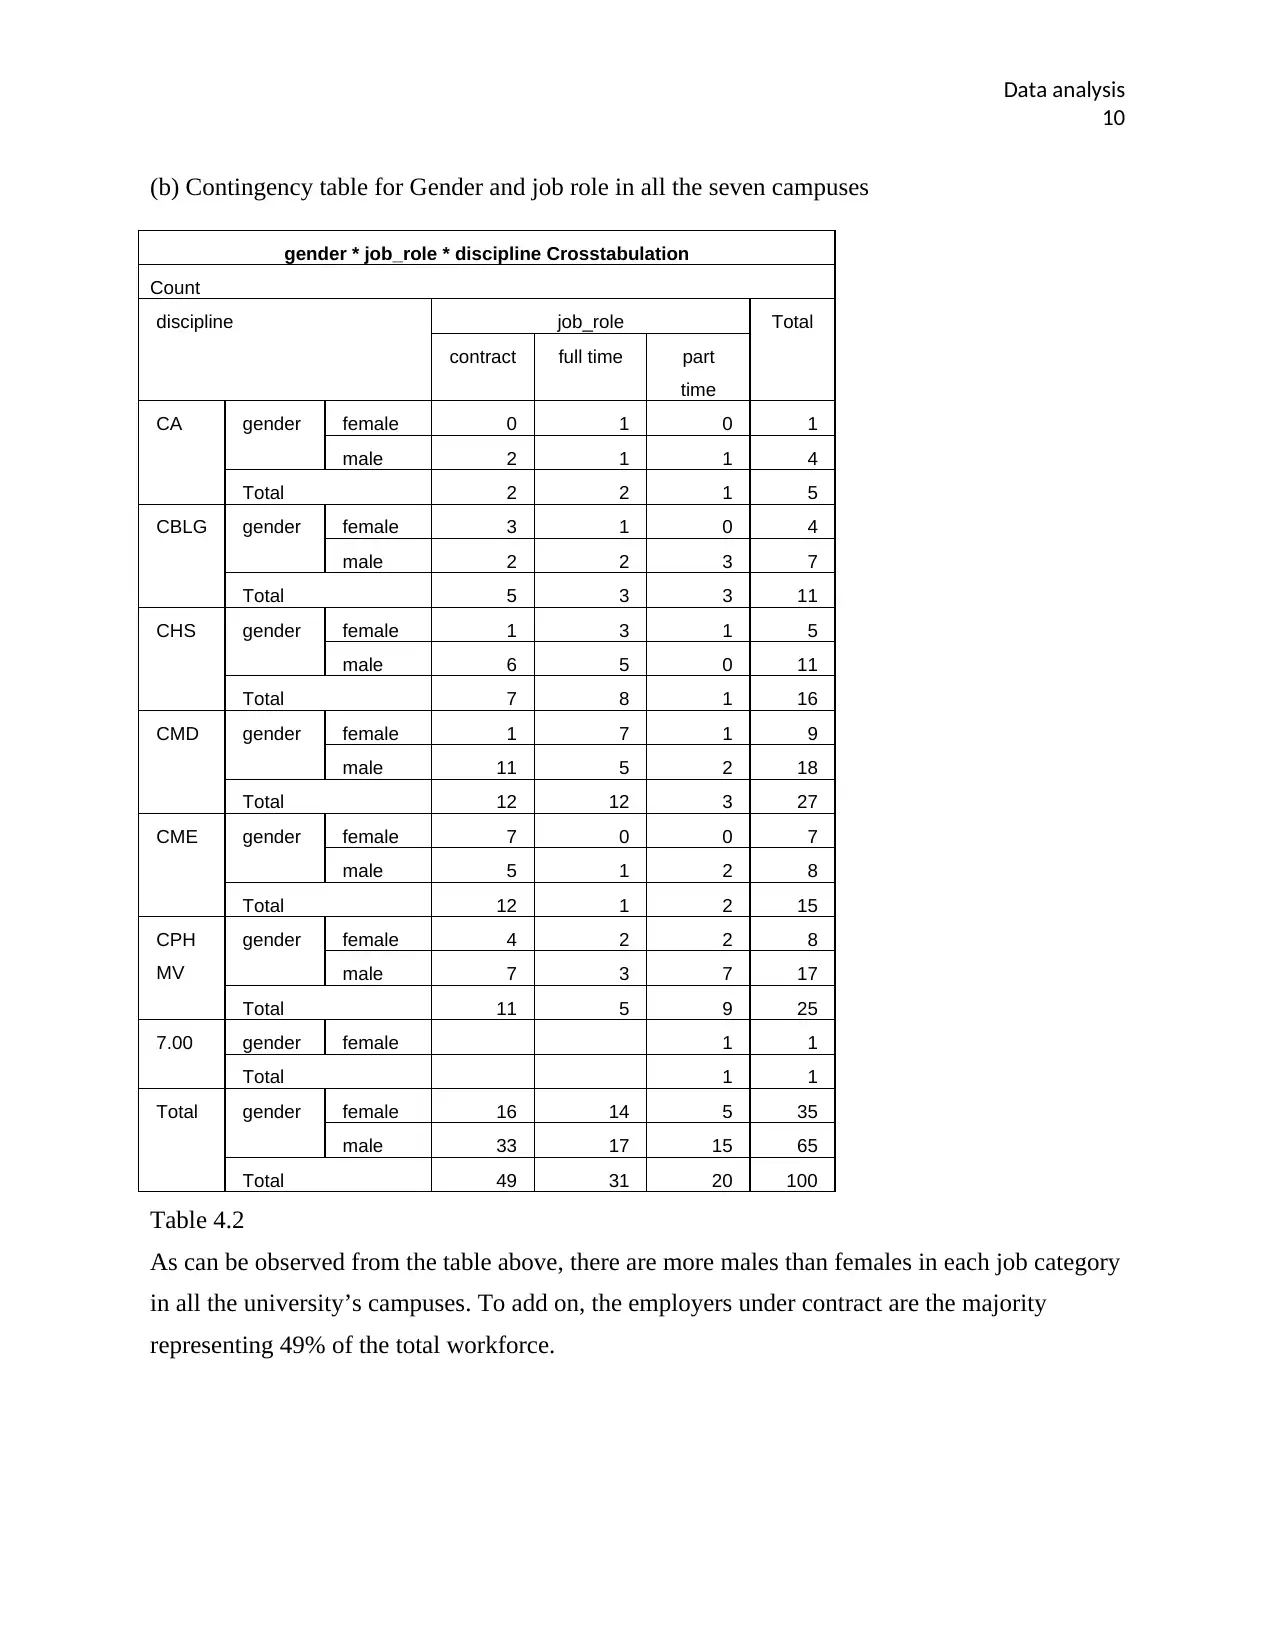
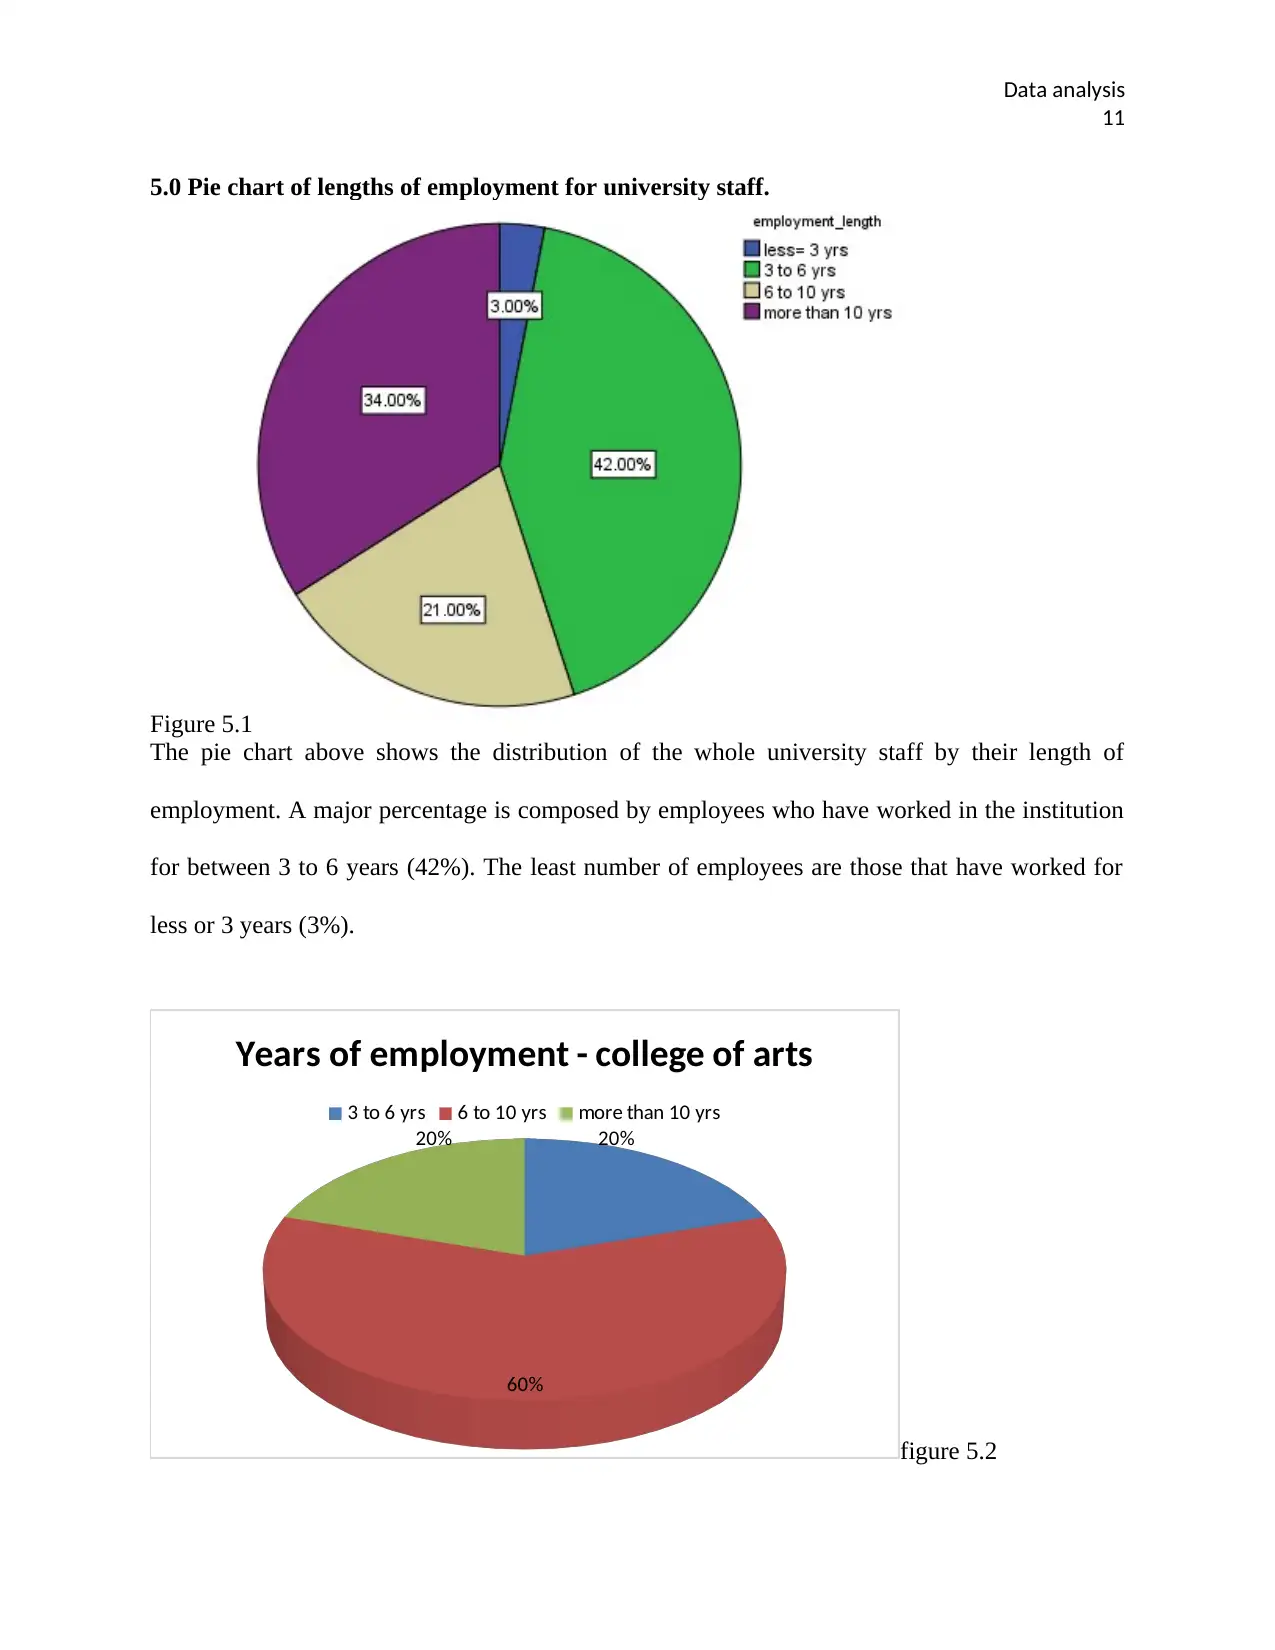
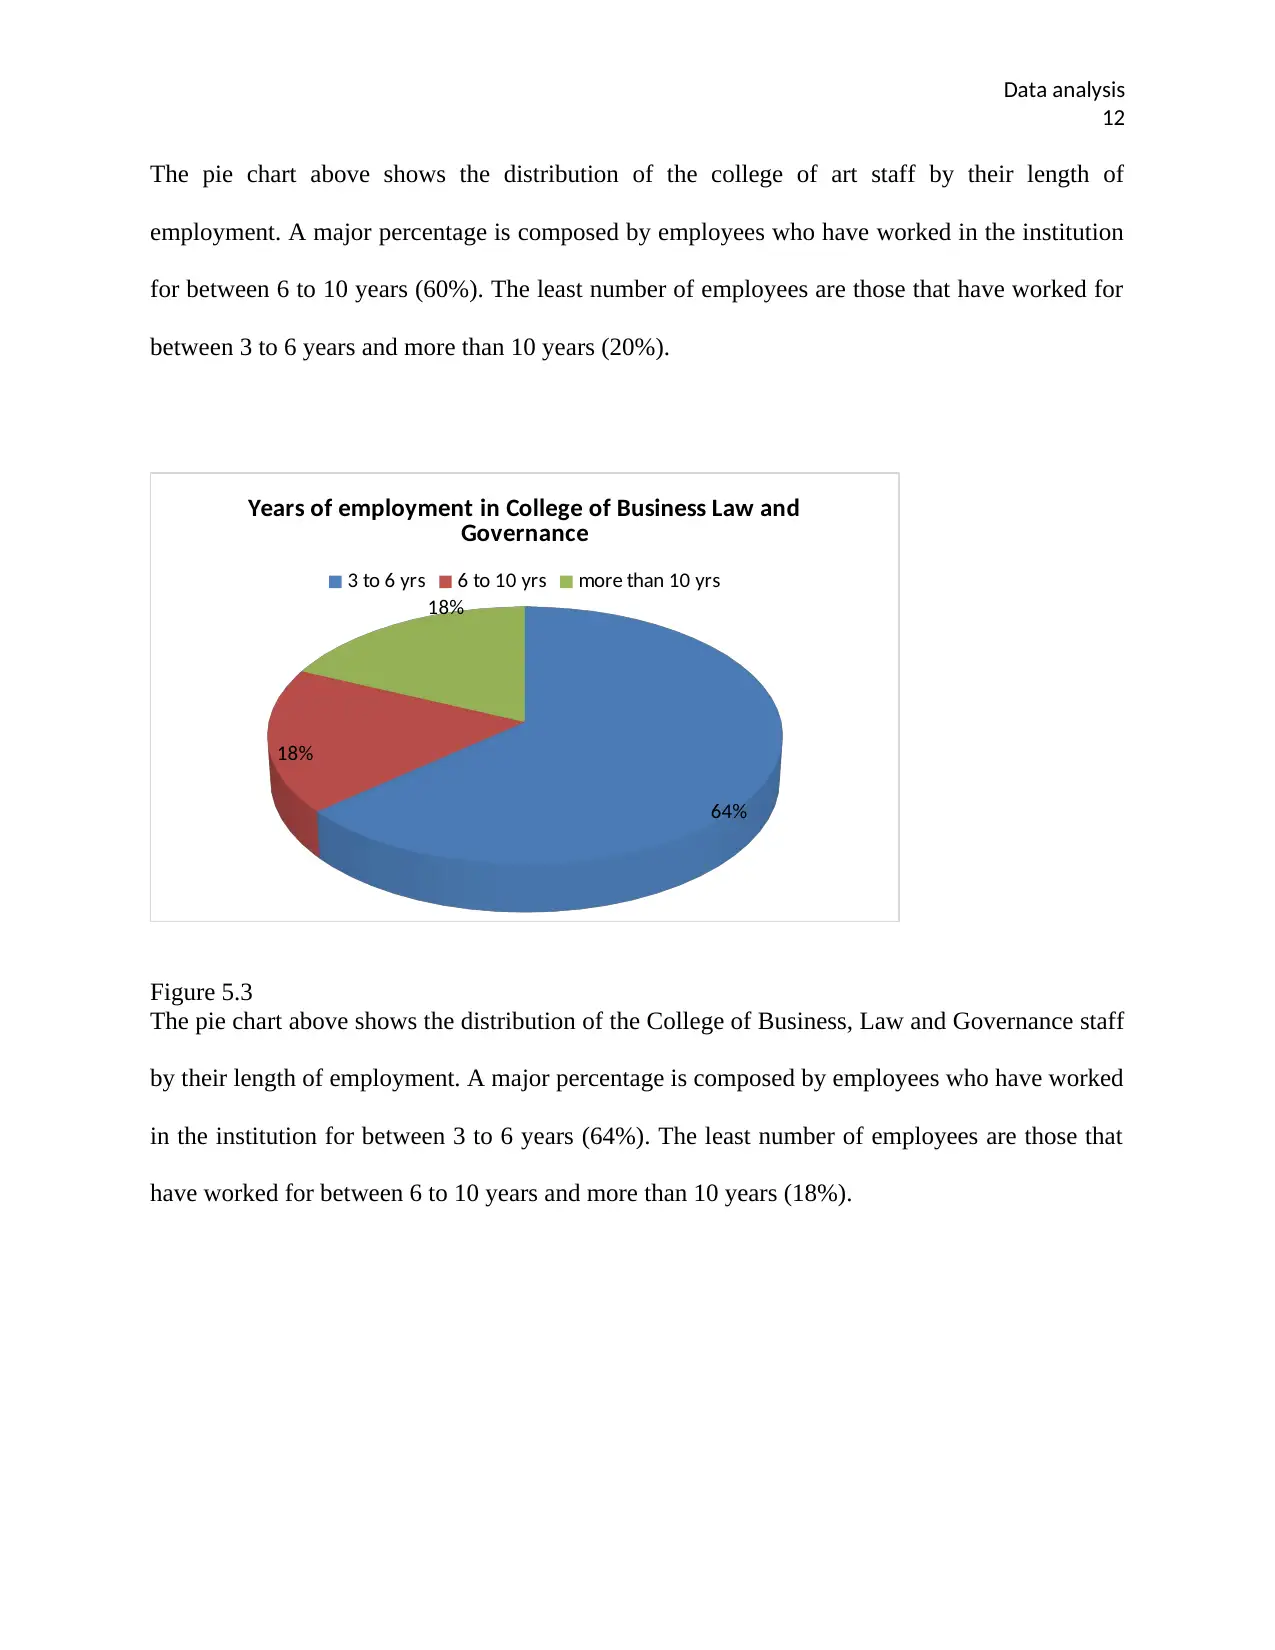
This report presents a comprehensive data analysis of James Cook University, examining staff data to assess equality. The analysis includes descriptive statistics of salaries, coefficient of variation across departments, and correlation analysis between salary and age. Graphical representations such as scatter plots, frequency tables, contingency tables for gender and job roles, and pie charts illustrating employment lengths are provided. Furthermore, bar graphs on modes of transport are included. The report utilizes statistical tools to uncover patterns and trends, offering insights into staff demographics and employment characteristics across different colleges and campuses. The findings are presented with supporting tables and figures, providing a detailed overview of the university's staff profile and highlighting key areas for further investigation related to equality. The report includes several references to support the analysis.
1 out of 18
Related Documents


Your All-in-One AI-Powered Toolkit for Academic Success.
+13062052269
info@desklib.com
Available 24*7 on WhatsApp / Email
![[object Object]](/_next/static/media/star-bottom.7253800d.svg)
Copyright © 2020–2026 A2Z Services. All Rights Reserved. Developed and managed by ZUCOL.