Financial Accounting Project: Analysis of James Business Performance
VerifiedAdded on  2023/01/17
|12
|1856
|20
Project
AI Summary
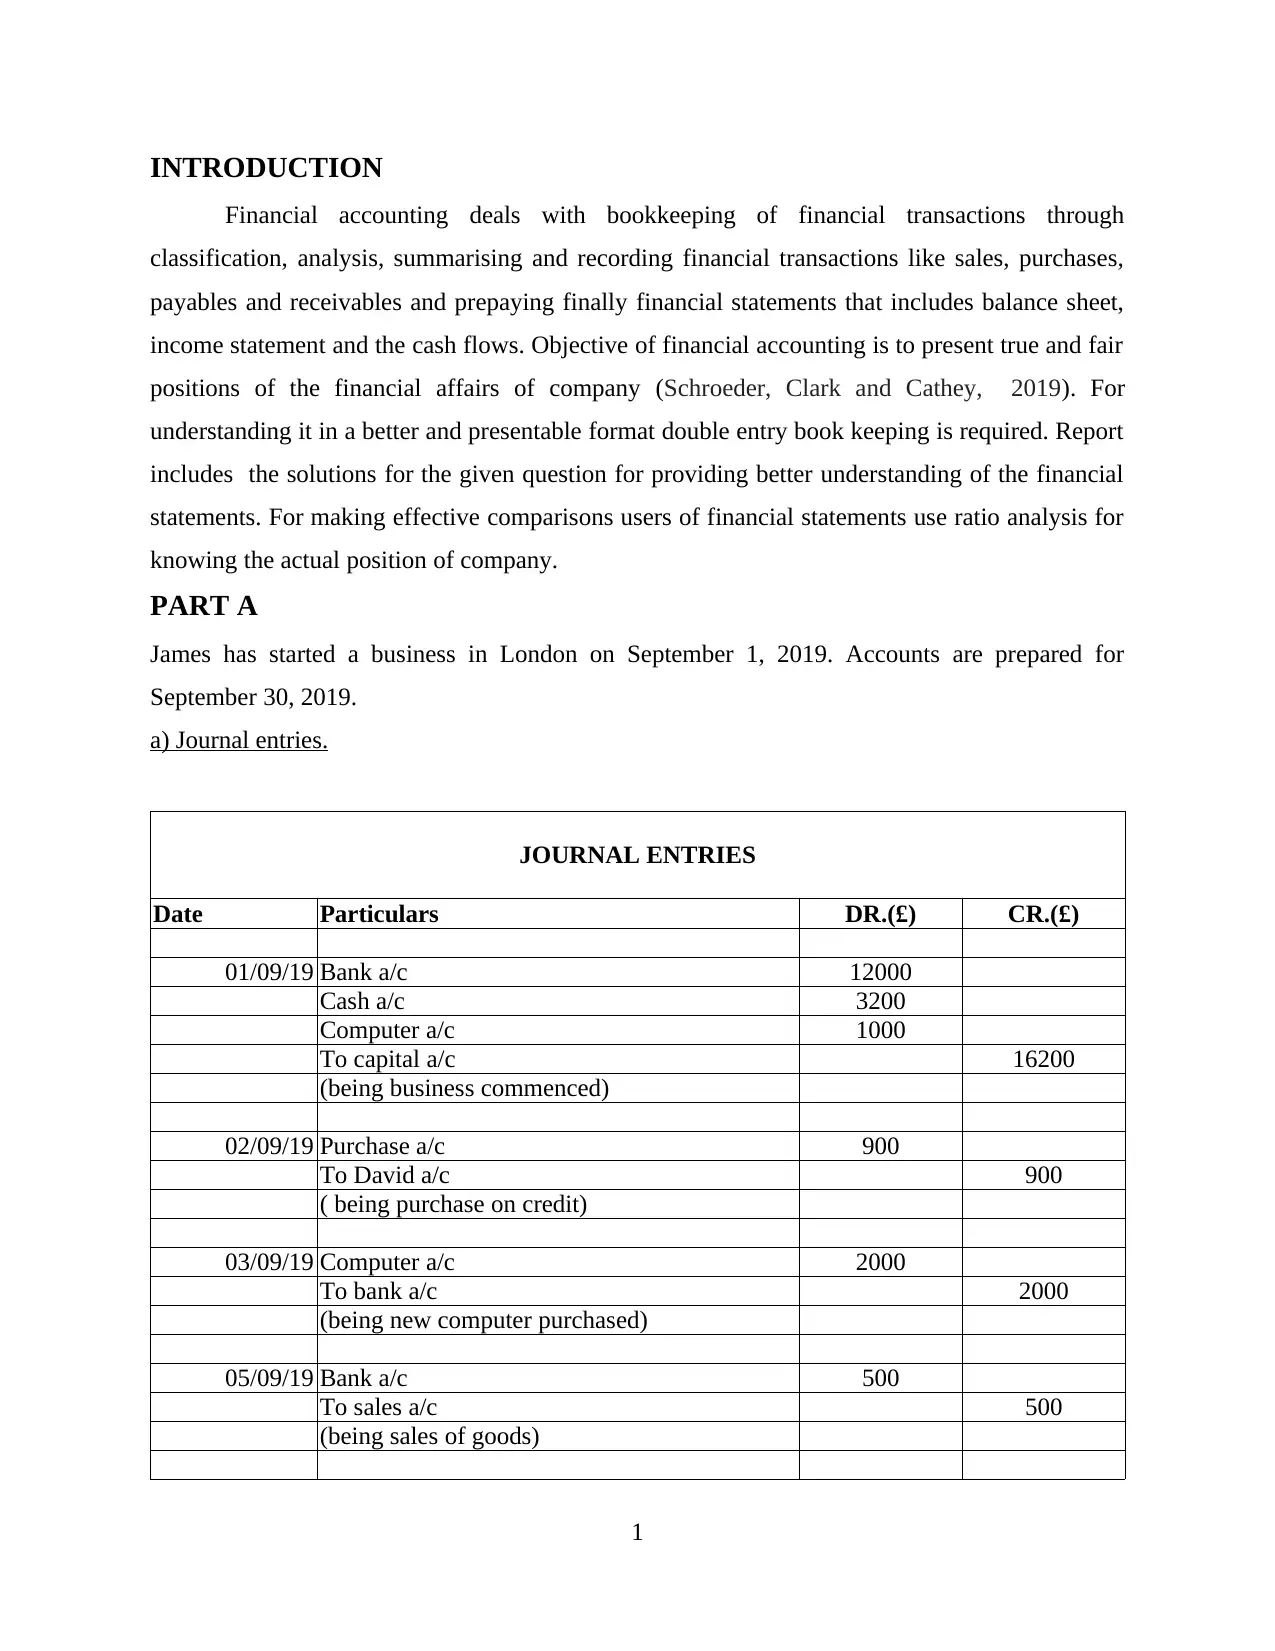
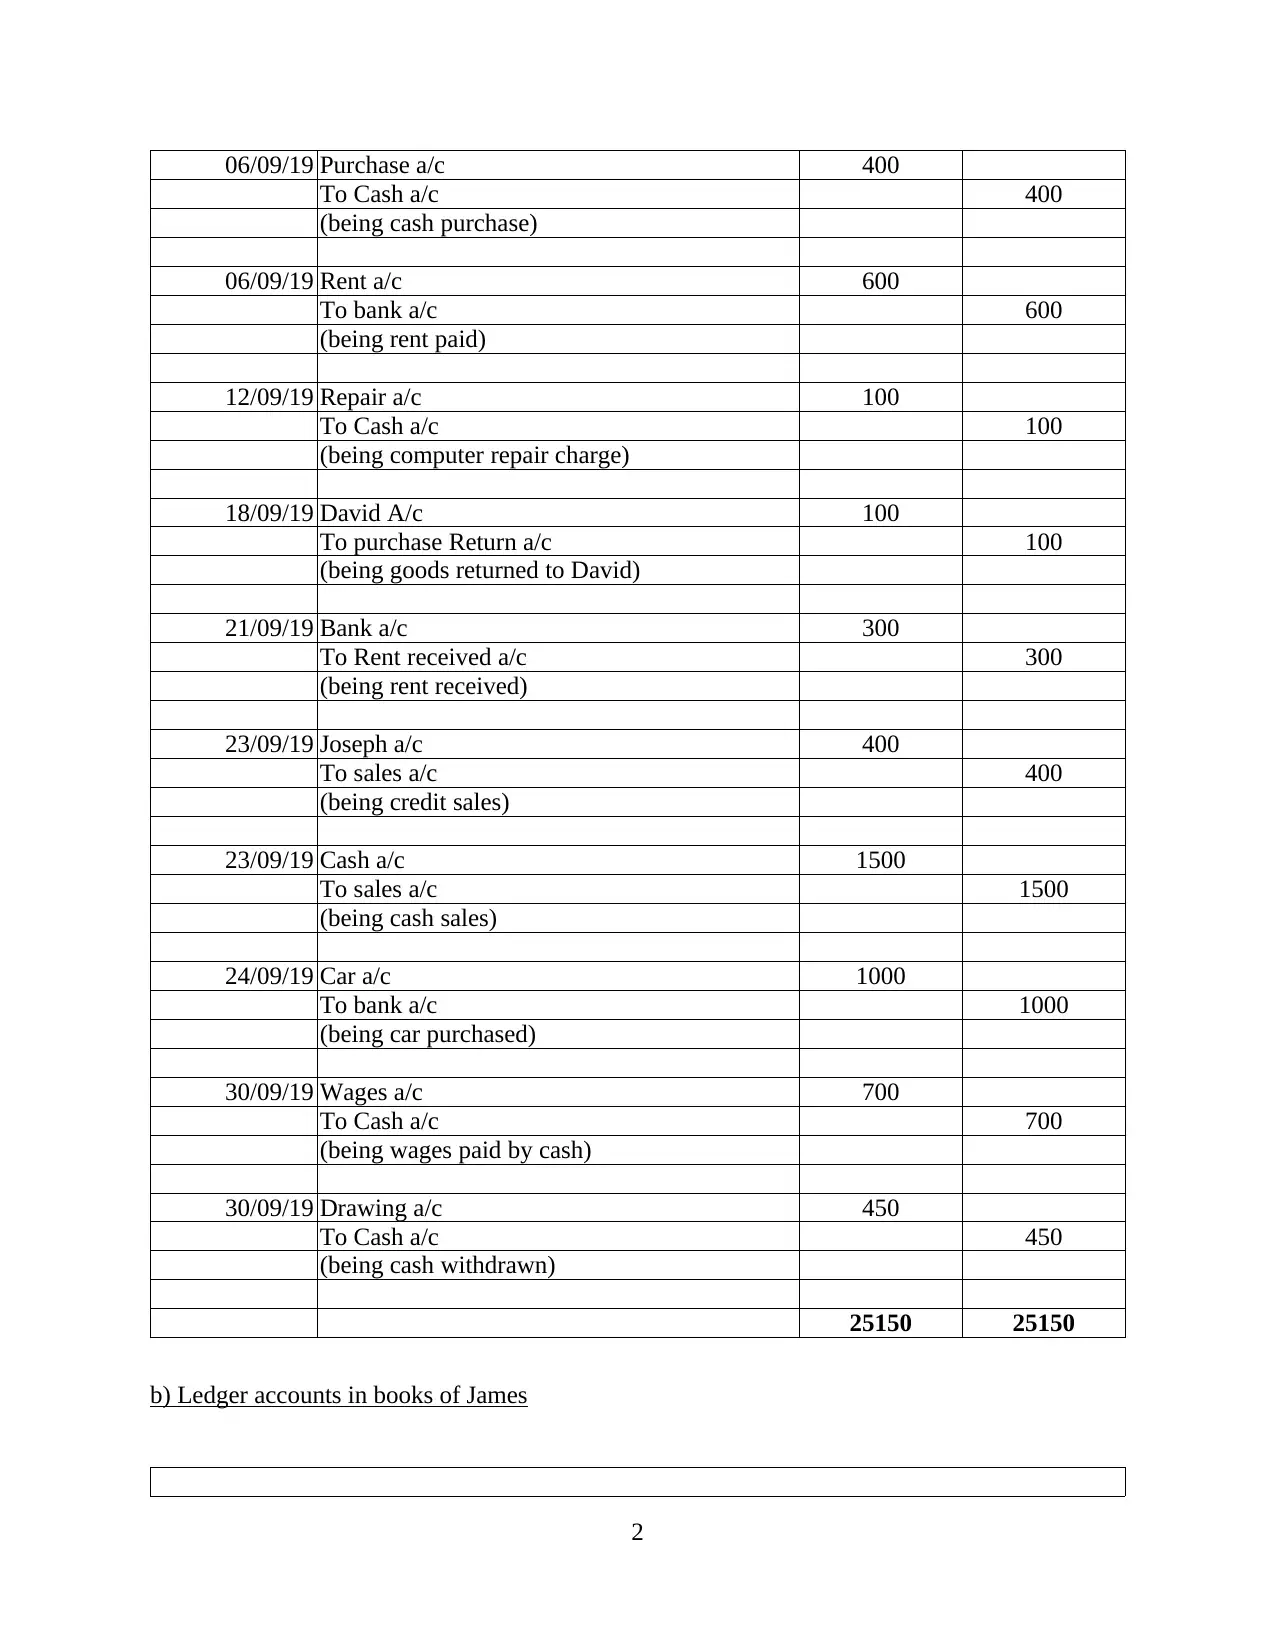
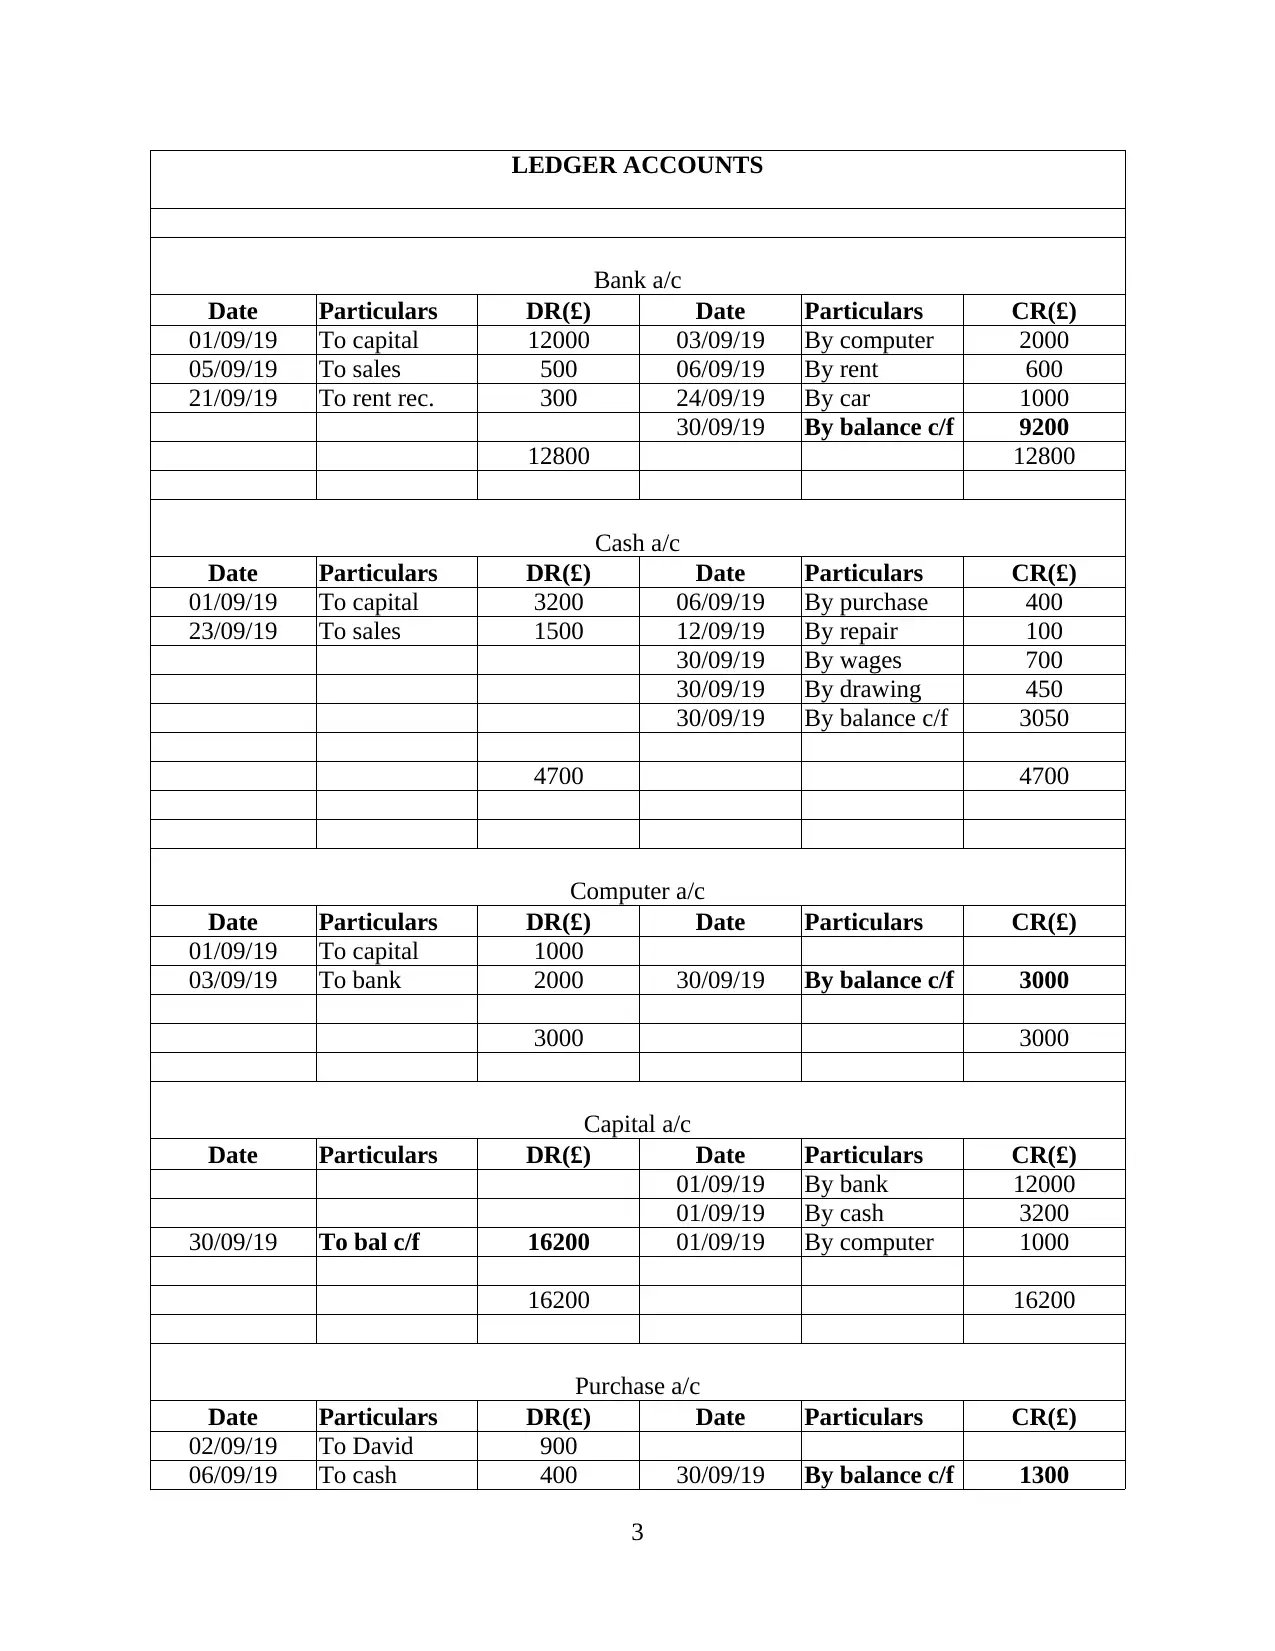
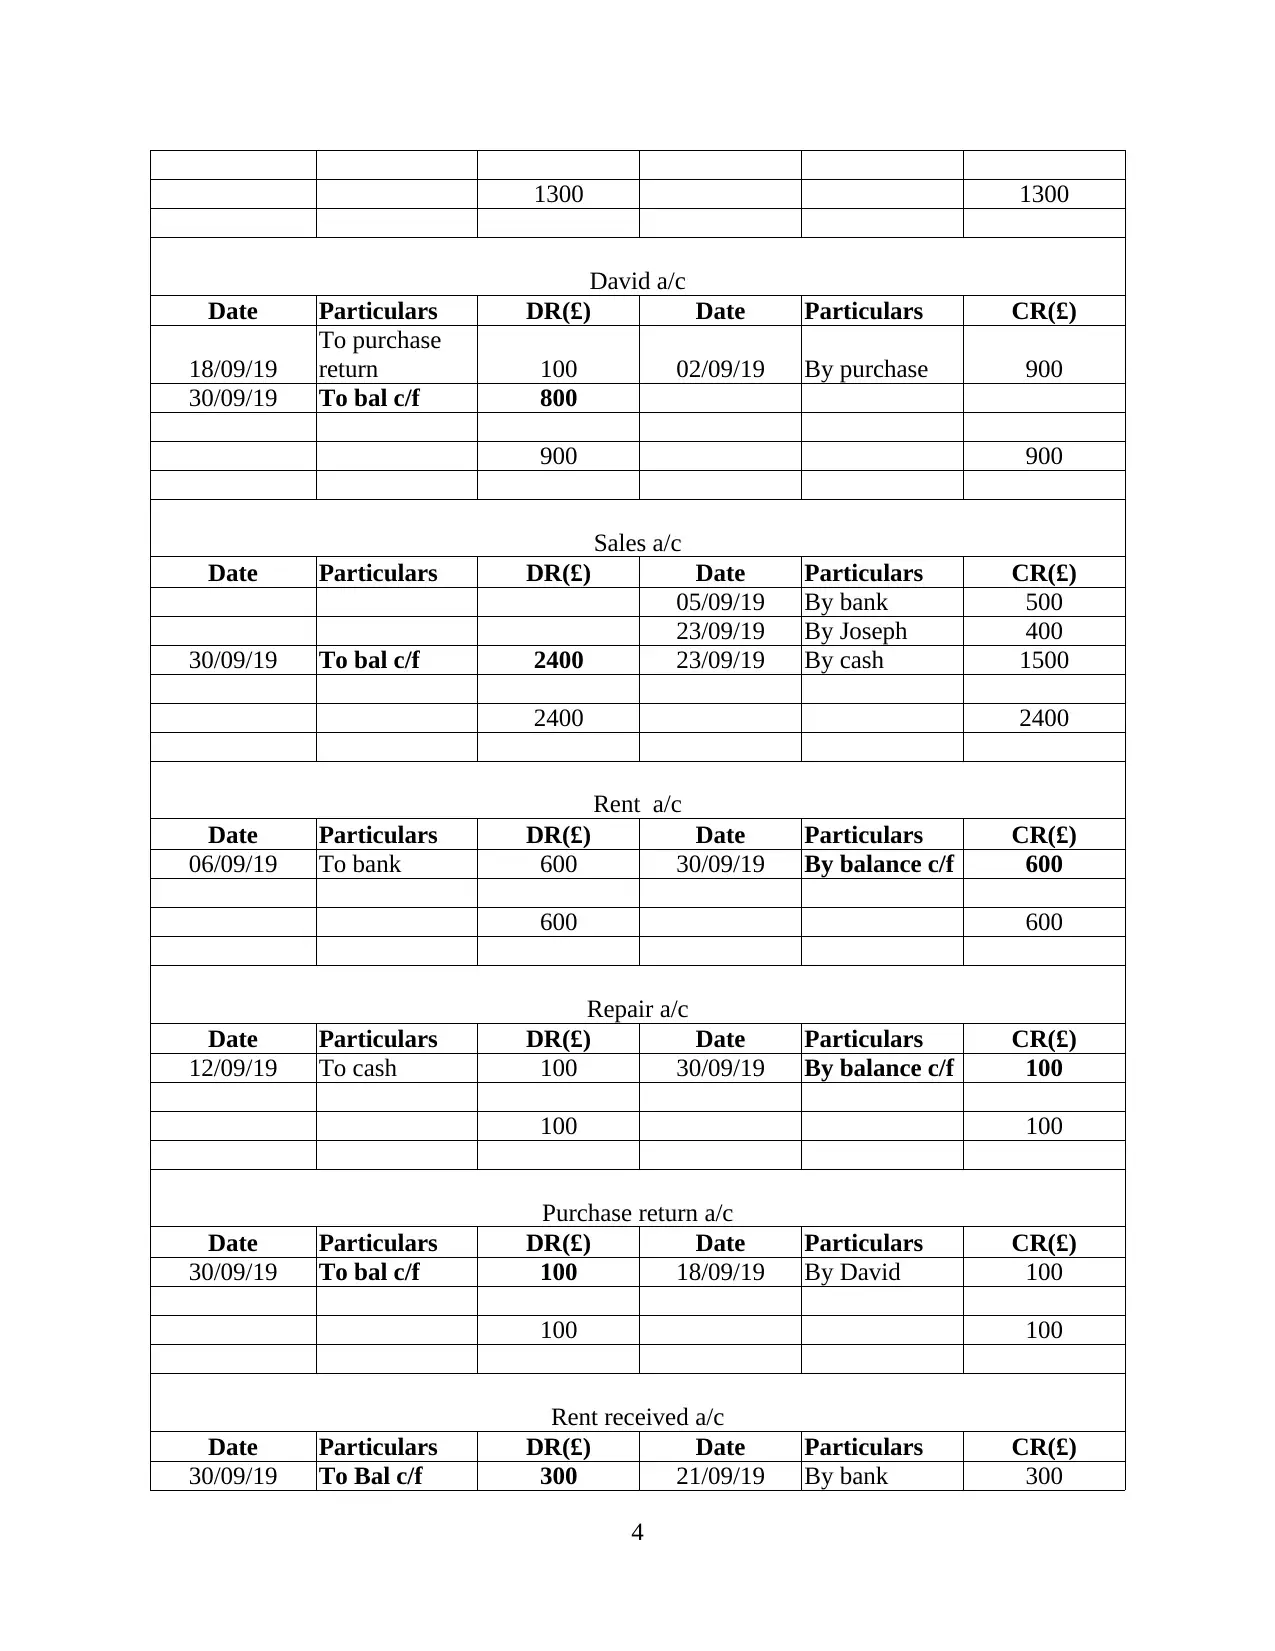
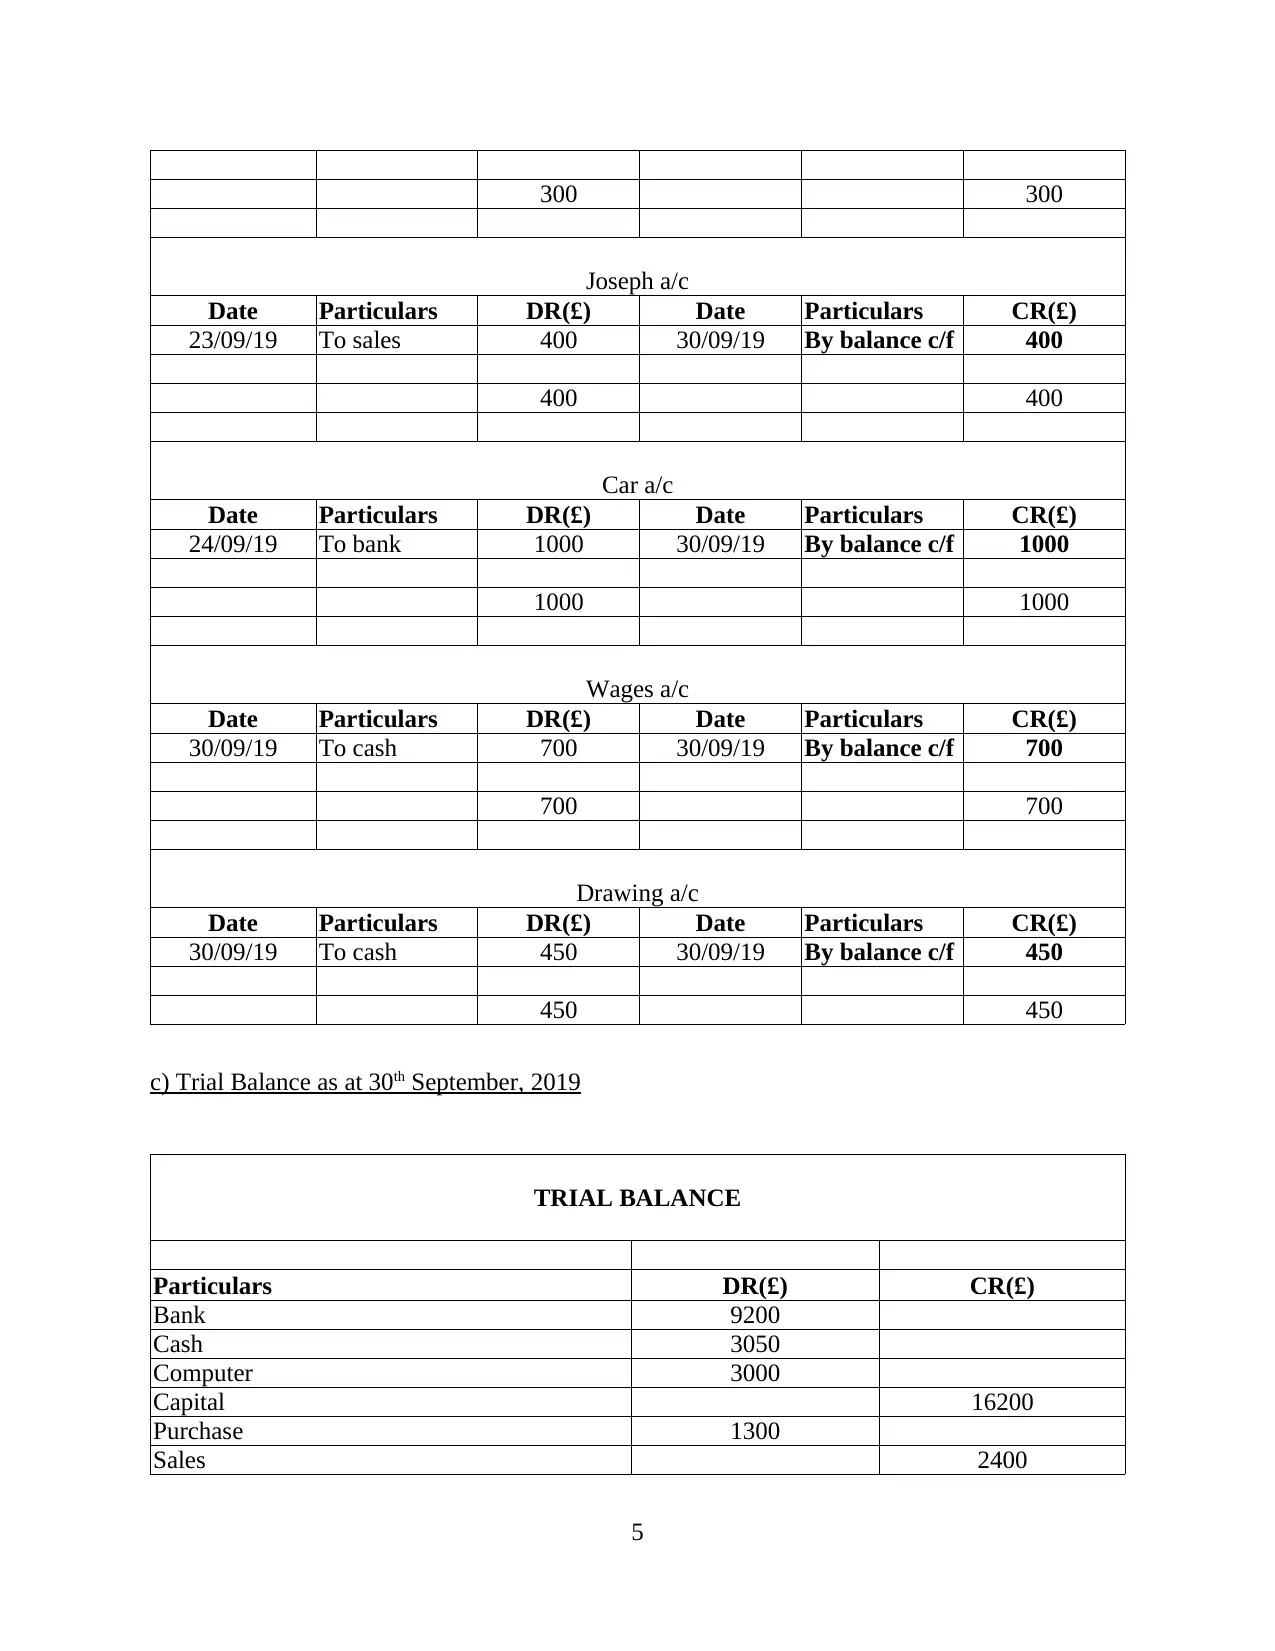
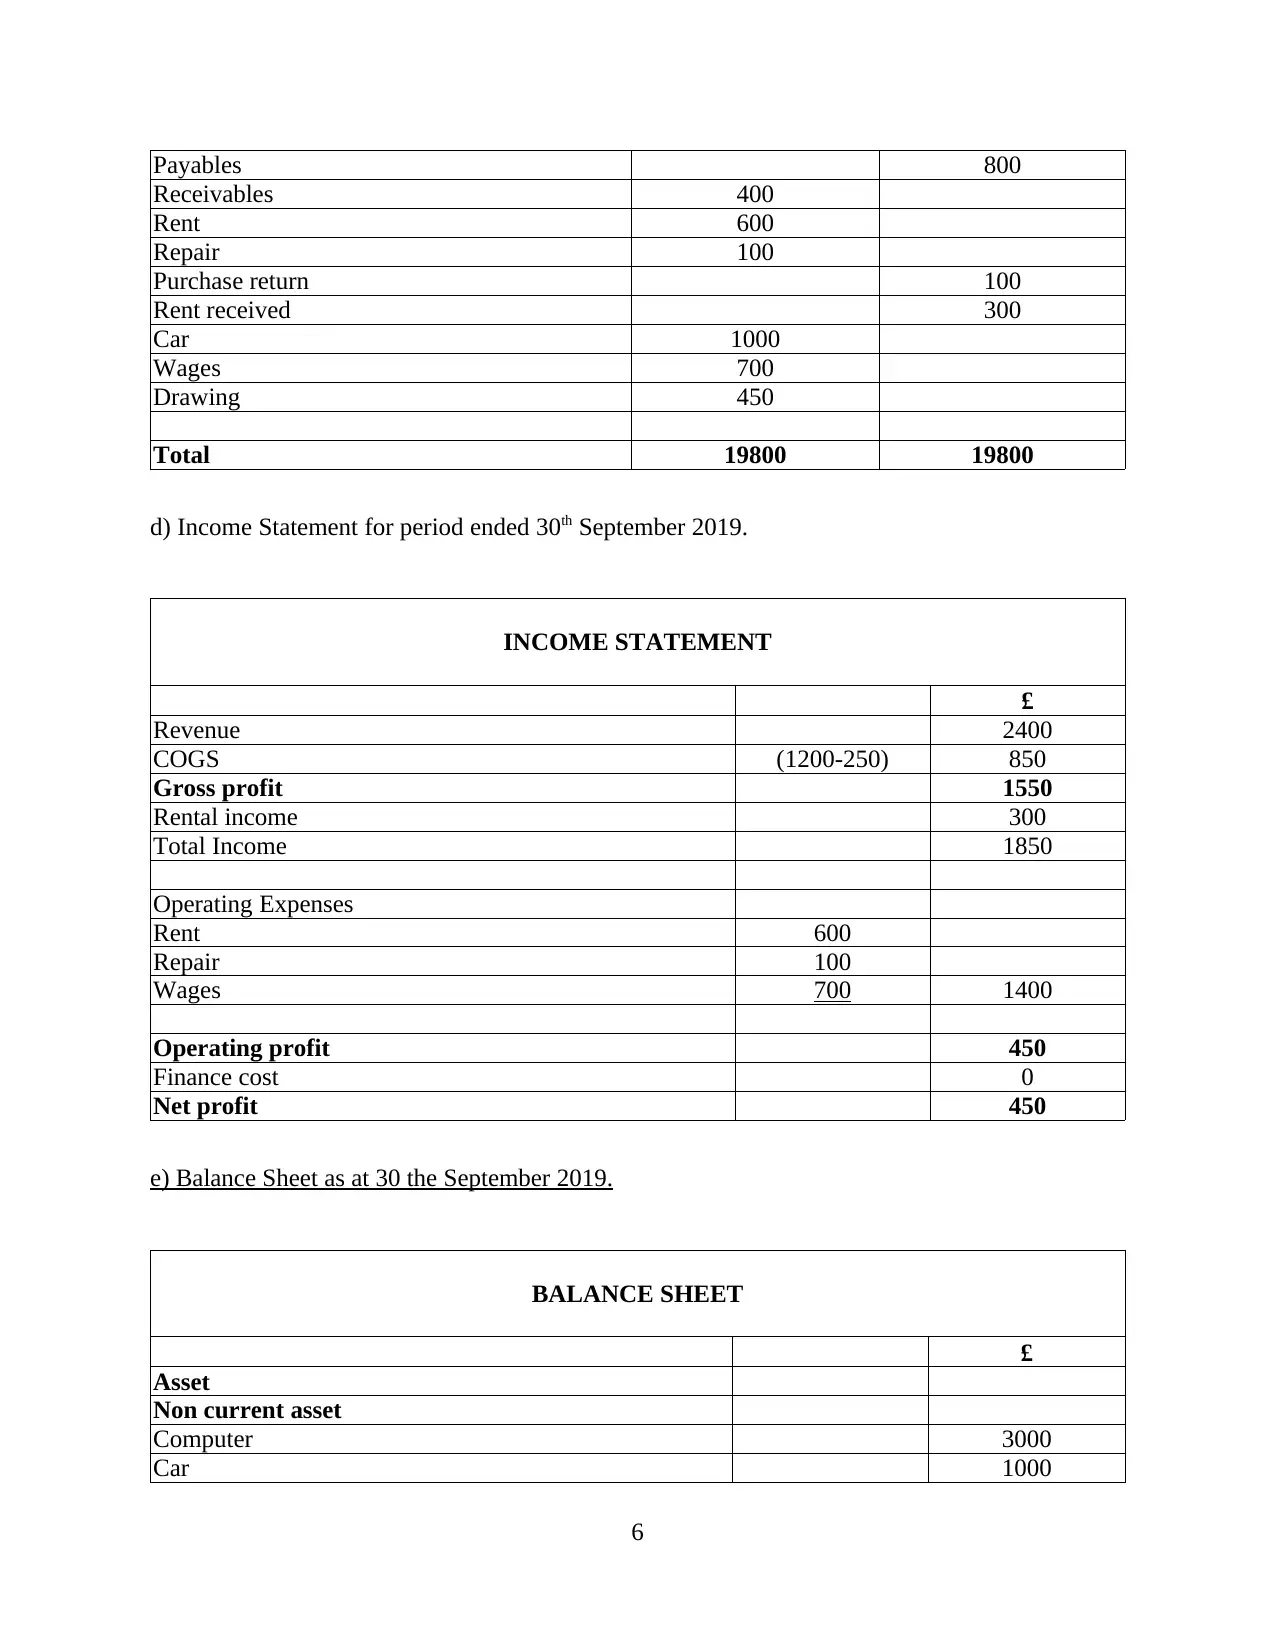
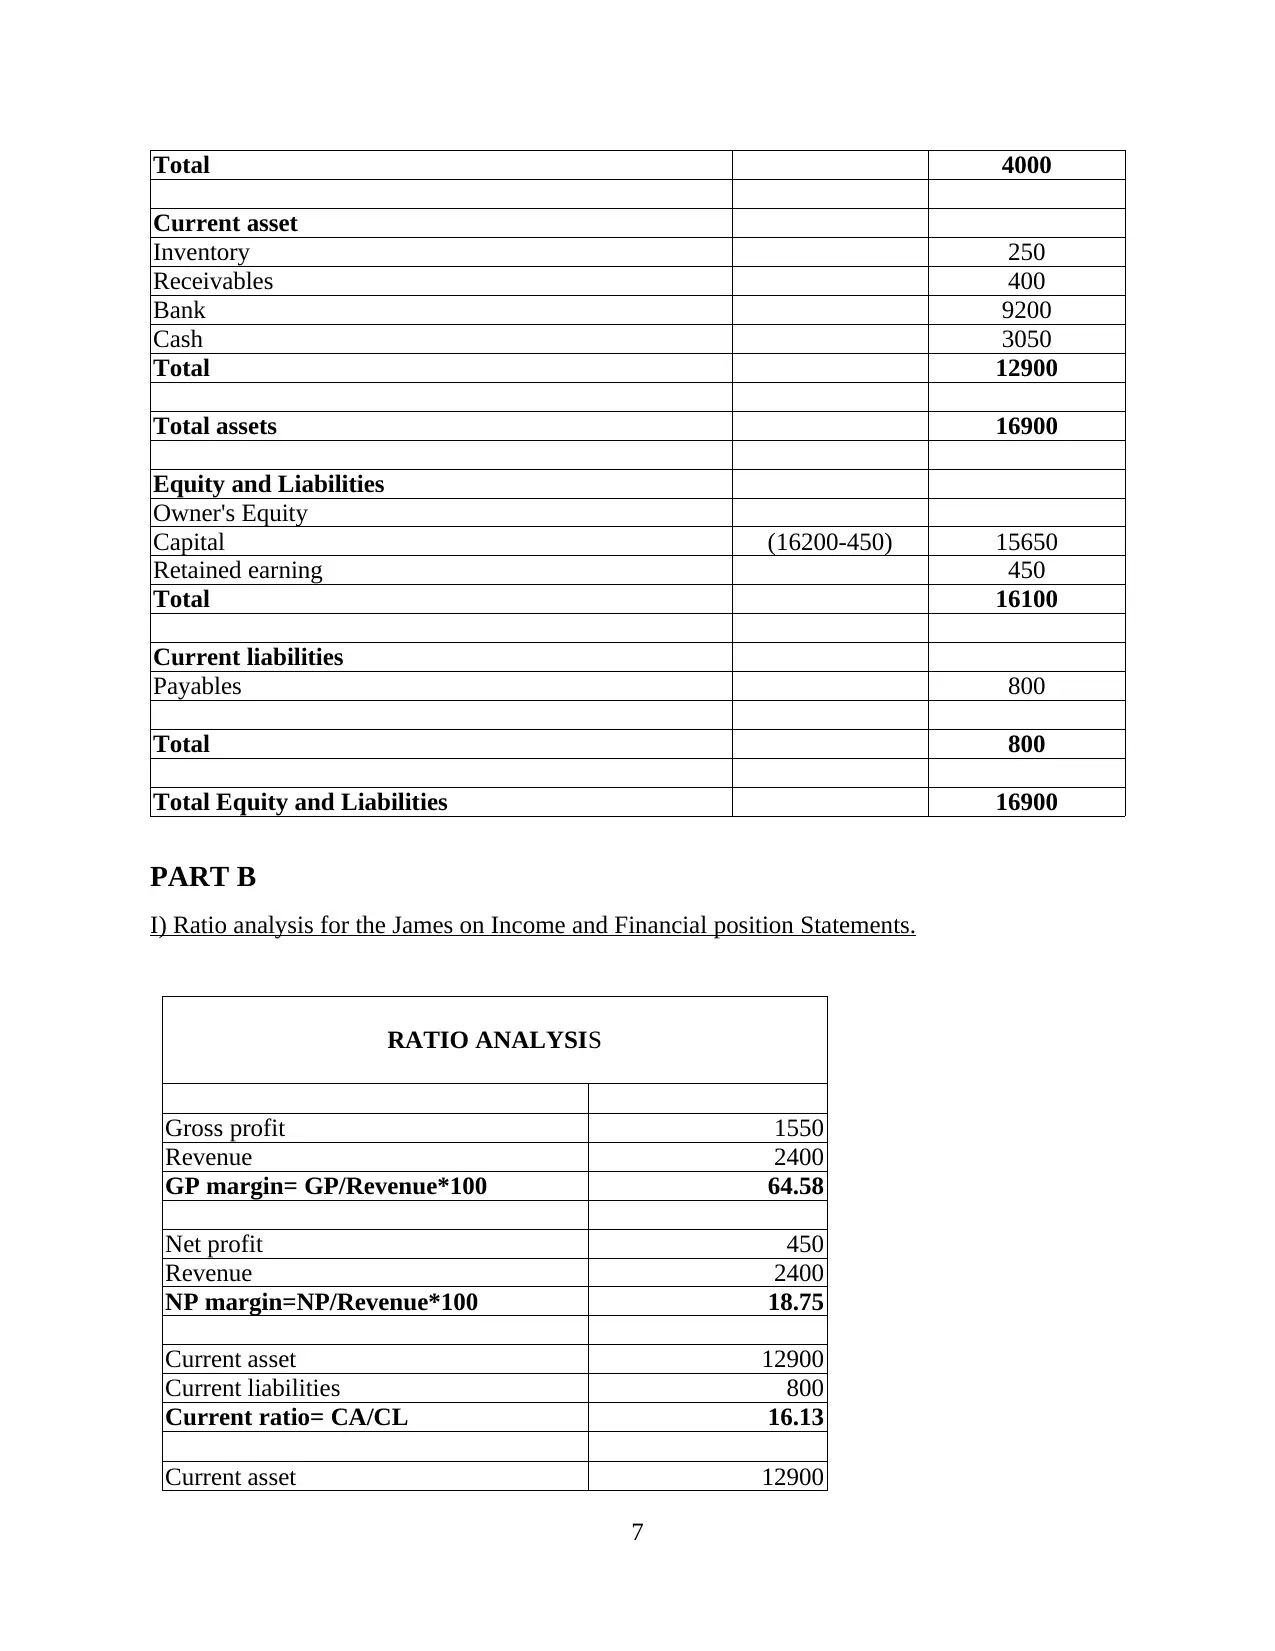
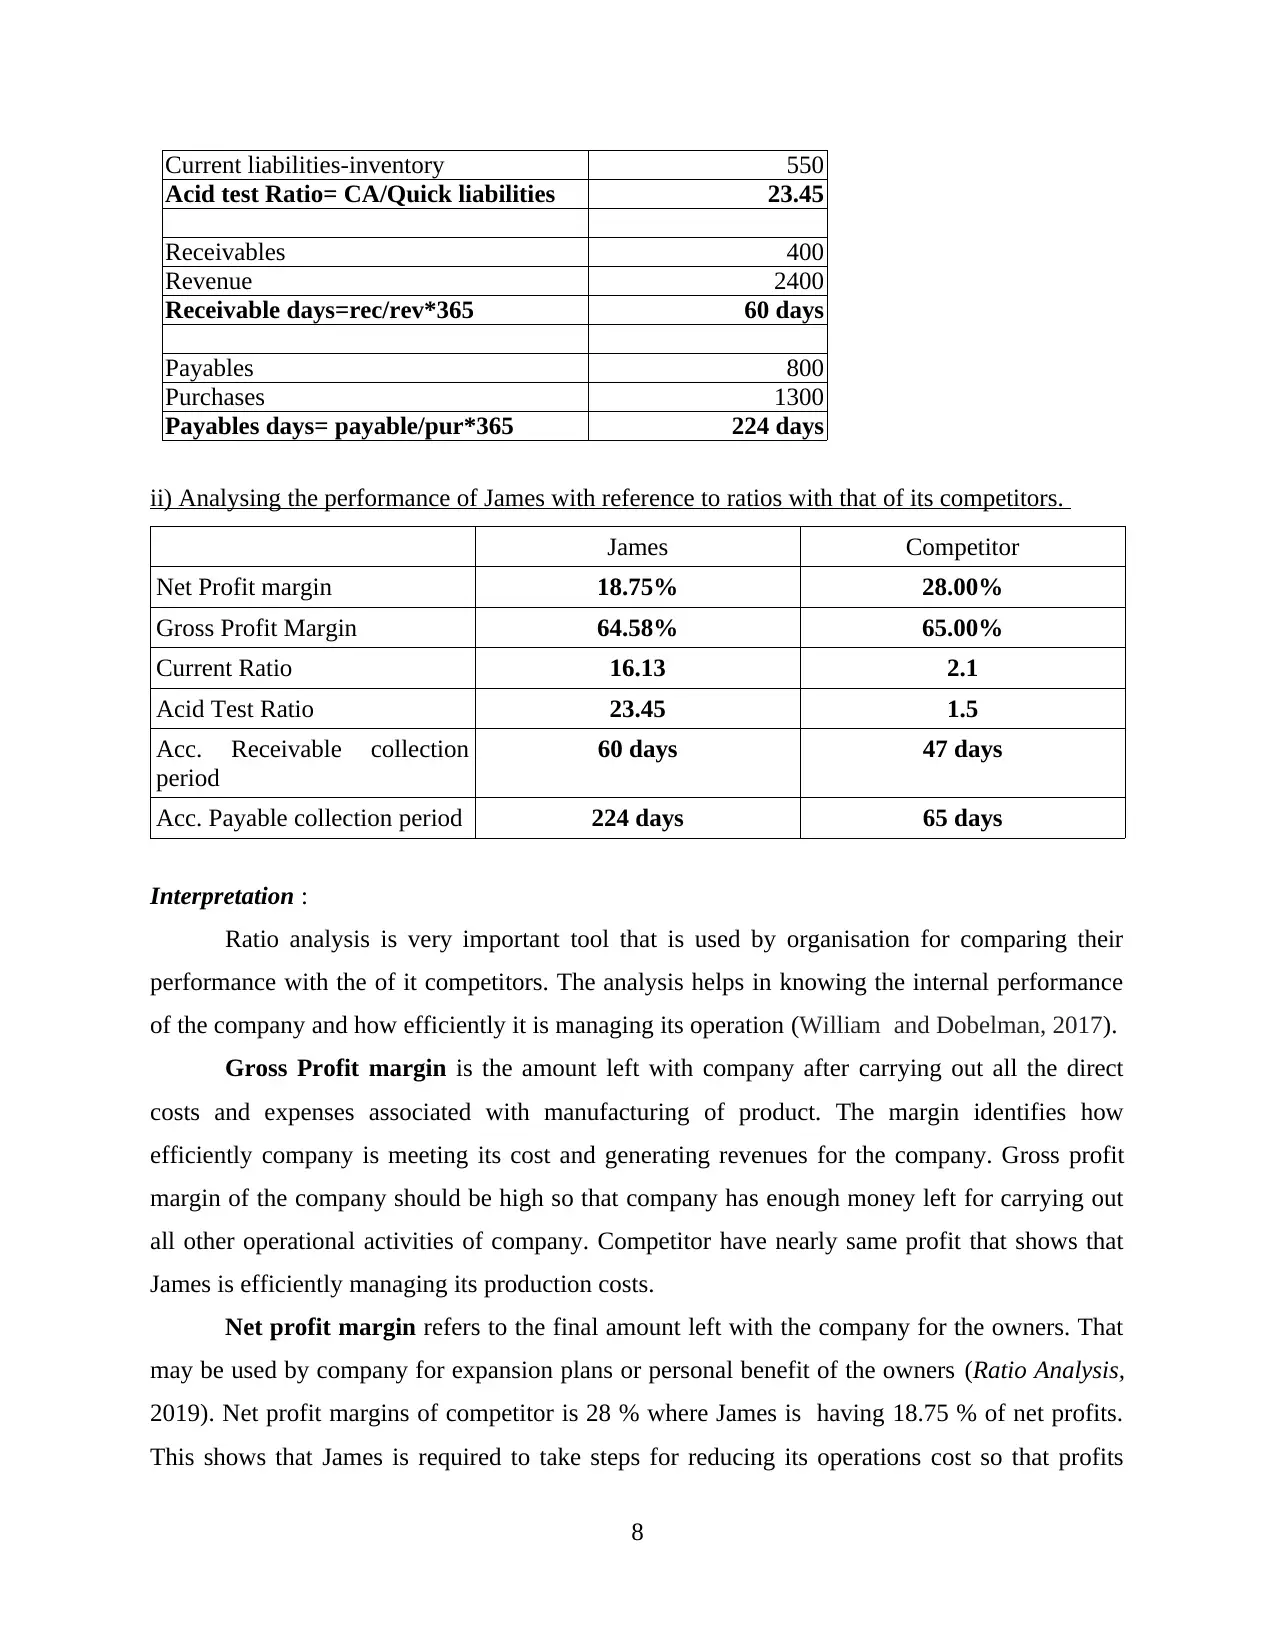
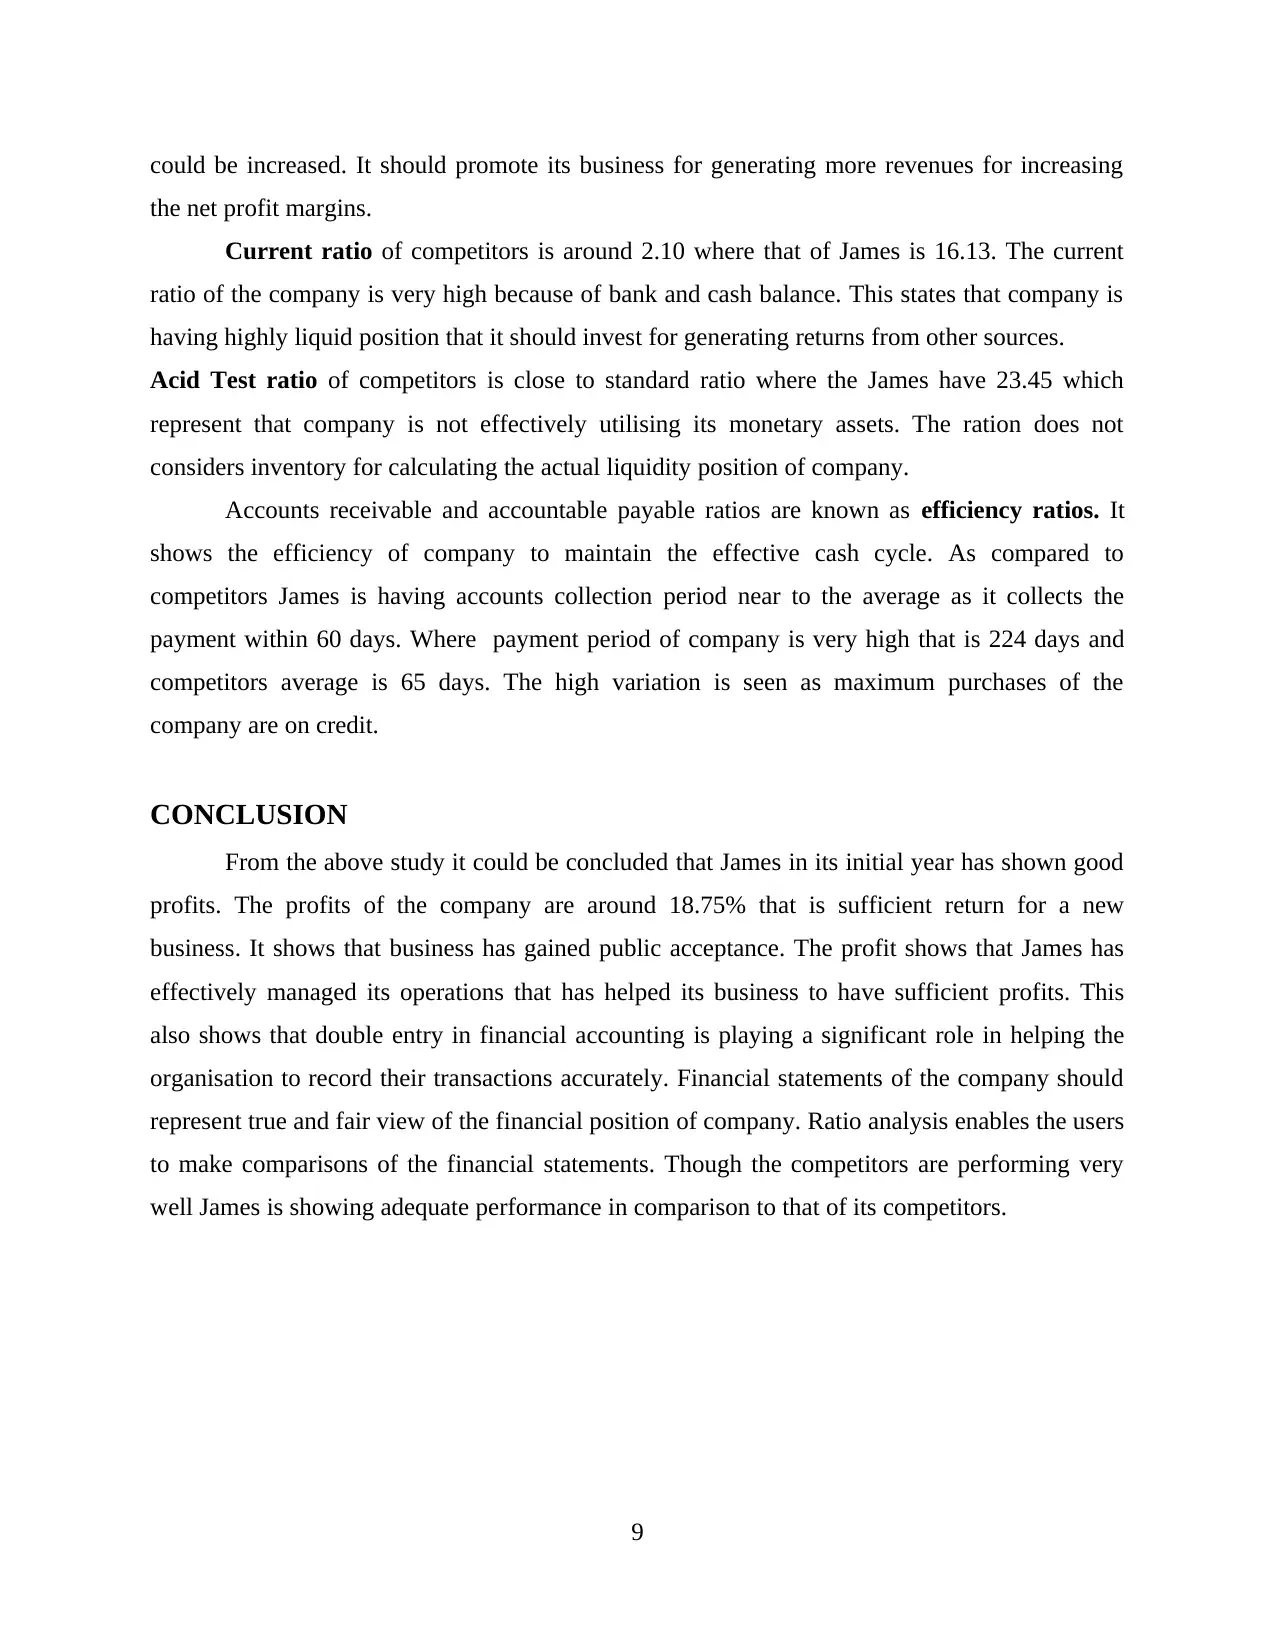
This project provides a comprehensive financial accounting analysis of James' business, which commenced operations in London on September 1, 2019. It begins with detailed journal entries for September, followed by the creation of ledger accounts. A trial balance as of September 30, 2019, is presented, along with an income statement and balance sheet. Part B focuses on ratio analysis, calculating gross profit margin, net profit margin, current ratio, acid-test ratio, and other relevant ratios to evaluate James' financial performance. The project includes a comparison of James' financial ratios with those of its competitors, providing insights into its operational efficiency and profitability. The analysis highlights areas for improvement, such as reducing operating costs and improving payment cycles, and concludes with an assessment of James' performance and financial standing.
Contribute Materials
Your contribution can guide someone’s learning journey. Share your
documents today.

PROJECT
Secure Best Marks with AI Grader
Need help grading? Try our AI Grader for instant feedback on your assignments.

TABLE OF CONTENTS
INTRODUCTION...........................................................................................................................1
PART A...........................................................................................................................................1
a) Journal entries..........................................................................................................................1
b) Ledger accounts in books of James.........................................................................................2
c) Trial Balance as at 30th September, 2019...............................................................................5
e) Balance Sheet as at 30 the September 2019............................................................................6
PART B............................................................................................................................................7
I) Ratio analysis for the James on Income and Financial position Statements............................7
ii) Analysing the performance of James with reference to ratios with that of its competitors. . .8
CONCLUSION................................................................................................................................9
REFERENCES..............................................................................................................................10

INTRODUCTION
Financial accounting deals with bookkeeping of financial transactions through
classification, analysis, summarising and recording financial transactions like sales, purchases,
payables and receivables and prepaying finally financial statements that includes balance sheet,
income statement and the cash flows. Objective of financial accounting is to present true and fair
positions of the financial affairs of company (Schroeder, Clark and Cathey, 2019). For
understanding it in a better and presentable format double entry book keeping is required. Report
includes the solutions for the given question for providing better understanding of the financial
statements. For making effective comparisons users of financial statements use ratio analysis for
knowing the actual position of company.
PART A
James has started a business in London on September 1, 2019. Accounts are prepared for
September 30, 2019.
a) Journal entries.
JOURNAL ENTRIES
Date Particulars DR.(£) CR.(£)
01/09/19 Bank a/c 12000
Cash a/c 3200
Computer a/c 1000
To capital a/c 16200
(being business commenced)
02/09/19 Purchase a/c 900
To David a/c 900
( being purchase on credit)
03/09/19 Computer a/c 2000
To bank a/c 2000
(being new computer purchased)
05/09/19 Bank a/c 500
To sales a/c 500
(being sales of goods)
1

06/09/19 Purchase a/c 400
To Cash a/c 400
(being cash purchase)
06/09/19 Rent a/c 600
To bank a/c 600
(being rent paid)
12/09/19 Repair a/c 100
To Cash a/c 100
(being computer repair charge)
18/09/19 David A/c 100
To purchase Return a/c 100
(being goods returned to David)
21/09/19 Bank a/c 300
To Rent received a/c 300
(being rent received)
23/09/19 Joseph a/c 400
To sales a/c 400
(being credit sales)
23/09/19 Cash a/c 1500
To sales a/c 1500
(being cash sales)
24/09/19 Car a/c 1000
To bank a/c 1000
(being car purchased)
30/09/19 Wages a/c 700
To Cash a/c 700
(being wages paid by cash)
30/09/19 Drawing a/c 450
To Cash a/c 450
(being cash withdrawn)
25150 25150
b) Ledger accounts in books of James
2
Secure Best Marks with AI Grader
Need help grading? Try our AI Grader for instant feedback on your assignments.

LEDGER ACCOUNTS
Bank a/c
Date Particulars DR(£) Date Particulars CR(£)
01/09/19 To capital 12000 03/09/19 By computer 2000
05/09/19 To sales 500 06/09/19 By rent 600
21/09/19 To rent rec. 300 24/09/19 By car 1000
30/09/19 By balance c/f 9200
12800 12800
Cash a/c
Date Particulars DR(£) Date Particulars CR(£)
01/09/19 To capital 3200 06/09/19 By purchase 400
23/09/19 To sales 1500 12/09/19 By repair 100
30/09/19 By wages 700
30/09/19 By drawing 450
30/09/19 By balance c/f 3050
4700 4700
Computer a/c
Date Particulars DR(£) Date Particulars CR(£)
01/09/19 To capital 1000
03/09/19 To bank 2000 30/09/19 By balance c/f 3000
3000 3000
Capital a/c
Date Particulars DR(£) Date Particulars CR(£)
01/09/19 By bank 12000
01/09/19 By cash 3200
30/09/19 To bal c/f 16200 01/09/19 By computer 1000
16200 16200
Purchase a/c
Date Particulars DR(£) Date Particulars CR(£)
02/09/19 To David 900
06/09/19 To cash 400 30/09/19 By balance c/f 1300
3

1300 1300
David a/c
Date Particulars DR(£) Date Particulars CR(£)
18/09/19
To purchase
return 100 02/09/19 By purchase 900
30/09/19 To bal c/f 800
900 900
Sales a/c
Date Particulars DR(£) Date Particulars CR(£)
05/09/19 By bank 500
23/09/19 By Joseph 400
30/09/19 To bal c/f 2400 23/09/19 By cash 1500
2400 2400
Rent a/c
Date Particulars DR(£) Date Particulars CR(£)
06/09/19 To bank 600 30/09/19 By balance c/f 600
600 600
Repair a/c
Date Particulars DR(£) Date Particulars CR(£)
12/09/19 To cash 100 30/09/19 By balance c/f 100
100 100
Purchase return a/c
Date Particulars DR(£) Date Particulars CR(£)
30/09/19 To bal c/f 100 18/09/19 By David 100
100 100
Rent received a/c
Date Particulars DR(£) Date Particulars CR(£)
30/09/19 To Bal c/f 300 21/09/19 By bank 300
4

300 300
Joseph a/c
Date Particulars DR(£) Date Particulars CR(£)
23/09/19 To sales 400 30/09/19 By balance c/f 400
400 400
Car a/c
Date Particulars DR(£) Date Particulars CR(£)
24/09/19 To bank 1000 30/09/19 By balance c/f 1000
1000 1000
Wages a/c
Date Particulars DR(£) Date Particulars CR(£)
30/09/19 To cash 700 30/09/19 By balance c/f 700
700 700
Drawing a/c
Date Particulars DR(£) Date Particulars CR(£)
30/09/19 To cash 450 30/09/19 By balance c/f 450
450 450
c) Trial Balance as at 30th September, 2019
TRIAL BALANCE
Particulars DR(£) CR(£)
Bank 9200
Cash 3050
Computer 3000
Capital 16200
Purchase 1300
Sales 2400
5
Paraphrase This Document
Need a fresh take? Get an instant paraphrase of this document with our AI Paraphraser

Payables 800
Receivables 400
Rent 600
Repair 100
Purchase return 100
Rent received 300
Car 1000
Wages 700
Drawing 450
Total 19800 19800
d) Income Statement for period ended 30th September 2019.
INCOME STATEMENT
£
Revenue 2400
COGS (1200-250) 850
Gross profit 1550
Rental income 300
Total Income 1850
Operating Expenses
Rent 600
Repair 100
Wages 700 1400
Operating profit 450
Finance cost 0
Net profit 450
e) Balance Sheet as at 30 the September 2019.
BALANCE SHEET
£
Asset
Non current asset
Computer 3000
Car 1000
6

Total 4000
Current asset
Inventory 250
Receivables 400
Bank 9200
Cash 3050
Total 12900
Total assets 16900
Equity and Liabilities
Owner's Equity
Capital (16200-450) 15650
Retained earning 450
Total 16100
Current liabilities
Payables 800
Total 800
Total Equity and Liabilities 16900
PART B
I) Ratio analysis for the James on Income and Financial position Statements.
RATIO ANALYSIS
Gross profit 1550
Revenue 2400
GP margin= GP/Revenue*100 64.58
Net profit 450
Revenue 2400
NP margin=NP/Revenue*100 18.75
Current asset 12900
Current liabilities 800
Current ratio= CA/CL 16.13
Current asset 12900
7

Current liabilities-inventory 550
Acid test Ratio= CA/Quick liabilities 23.45
Receivables 400
Revenue 2400
Receivable days=rec/rev*365 60 days
Payables 800
Purchases 1300
Payables days= payable/pur*365 224 days
ii) Analysing the performance of James with reference to ratios with that of its competitors.
James Competitor
Net Profit margin 18.75% 28.00%
Gross Profit Margin 64.58% 65.00%
Current Ratio 16.13 2.1
Acid Test Ratio 23.45 1.5
Acc. Receivable collection
period
60 days 47 days
Acc. Payable collection period 224 days 65 days
Interpretation :
Ratio analysis is very important tool that is used by organisation for comparing their
performance with the of it competitors. The analysis helps in knowing the internal performance
of the company and how efficiently it is managing its operation (William and Dobelman, 2017).
Gross Profit margin is the amount left with company after carrying out all the direct
costs and expenses associated with manufacturing of product. The margin identifies how
efficiently company is meeting its cost and generating revenues for the company. Gross profit
margin of the company should be high so that company has enough money left for carrying out
all other operational activities of company. Competitor have nearly same profit that shows that
James is efficiently managing its production costs.
Net profit margin refers to the final amount left with the company for the owners. That
may be used by company for expansion plans or personal benefit of the owners (Ratio Analysis,
2019). Net profit margins of competitor is 28 % where James is having 18.75 % of net profits.
This shows that James is required to take steps for reducing its operations cost so that profits
8
Secure Best Marks with AI Grader
Need help grading? Try our AI Grader for instant feedback on your assignments.

could be increased. It should promote its business for generating more revenues for increasing
the net profit margins.
Current ratio of competitors is around 2.10 where that of James is 16.13. The current
ratio of the company is very high because of bank and cash balance. This states that company is
having highly liquid position that it should invest for generating returns from other sources.
Acid Test ratio of competitors is close to standard ratio where the James have 23.45 which
represent that company is not effectively utilising its monetary assets. The ration does not
considers inventory for calculating the actual liquidity position of company.
Accounts receivable and accountable payable ratios are known as efficiency ratios. It
shows the efficiency of company to maintain the effective cash cycle. As compared to
competitors James is having accounts collection period near to the average as it collects the
payment within 60 days. Where payment period of company is very high that is 224 days and
competitors average is 65 days. The high variation is seen as maximum purchases of the
company are on credit.
CONCLUSION
From the above study it could be concluded that James in its initial year has shown good
profits. The profits of the company are around 18.75% that is sufficient return for a new
business. It shows that business has gained public acceptance. The profit shows that James has
effectively managed its operations that has helped its business to have sufficient profits. This
also shows that double entry in financial accounting is playing a significant role in helping the
organisation to record their transactions accurately. Financial statements of the company should
represent true and fair view of the financial position of company. Ratio analysis enables the users
to make comparisons of the financial statements. Though the competitors are performing very
well James is showing adequate performance in comparison to that of its competitors.
9

REFERENCES
Books and Journals
Schroeder, R.G., Clark, M.W. and Cathey, J.M., 2019. Financial accounting theory and
analysis: text and cases. John Wiley & Sons.
Williams, E.E. and Dobelman, J.A., 2017. Financial statement analysis. World Scientific Book
Chapters. pp.109-169.
Online
Ratio Analysis. 2019. [Online]. Available through :
<https://corporatefinanceinstitute.com/resources/knowledge/finance/ratio-analysis/>.
10
1 out of 12
Related Documents

Your All-in-One AI-Powered Toolkit for Academic Success.
 +13062052269
info@desklib.com
Available 24*7 on WhatsApp / Email
Unlock your academic potential
© 2024  |  Zucol Services PVT LTD  |  All rights reserved.