Financial Performance Analysis: James Halstead vs. Michelmersh
VerifiedAdded on 2022/08/22
|17
|3718
|30
Report
AI Summary
This report critically analyzes the financial performance of James Halstead Plc, a company in the construction and materials sector, and compares it to its competitor, Michelmersh Brick Holdings Plc. Using financial data from the companies' annual reports over a five-year period, the report employs ratio analysis to evaluate profitability, liquidity, efficiency, solvency, and investment ratios, along with non-financial metrics such as employee turnover. The analysis reveals that James Halstead Plc generally outperforms Michelmersh Brick Holdings Plc in key financial areas, demonstrating higher profitability, better liquidity, and more efficient asset management. The report also assesses the corporate governance of James Halstead Plc and considers the dividend payout and price-earnings ratios to gauge investment potential. The conclusion highlights James Halstead's stronger financial position and discusses the implications of the findings.

Running head: FINANCIAL DECISION MAKING
Financial decision making
Name of the Student
Name of the University
Author Note
Financial decision making
Name of the Student
Name of the University
Author Note
Paraphrase This Document
Need a fresh take? Get an instant paraphrase of this document with our AI Paraphraser
FINANCIAL DECISION MAKING
Abstract:
In the paper, a critical examination of the financial performance of the companies listed on
London stock exchange has been demonstrated. The report is prepared to be presented to the
board of directors on the financial performance of the company and comparing the
performance with its competitor. The chosen company for analysis and its competitor is
James Halstead Plc and Mihelmersh Brick holdings Plc. Financial data has been analyzed for
the last five years which has been retrieved from the financial reports published by the
companies. The interpretation of the financial results of the companies reveals the fact the
James Plc has outperformed Michel over the years.
Table of Contents
FINANCIAL DECISION MAKING
Introduction:...............................................................................................................................3
Discussion:.................................................................................................................................3
Section A:...................................................................................................................................3
Section B:.................................................................................................................................11
Conclusion:..............................................................................................................................12
References list:.........................................................................................................................14
Introduction:
The report intends to critically analyze the financial performance of the company
operating in construction and material sector. The chosen companies for analysis is James
Halstead Plc and one of its competitors named Michelmersh brick holdings plc. Financial
⊘ This is a preview!⊘
Do you want full access?
Subscribe today to unlock all pages.
Trusted by 1+ million students worldwide
FINANCIAL DECISION MAKING
performance of the main company is compared with its competitor using the ratio analysis
technique for the financial data retrieved from its annual report of the past five years. In
addition to this, the corporate governance of James Halstead Plc has been evaluated.
James Halstead is a company engaged in the manufacturing and distribution of
flooring products and was founded in year 1915. The company was established to innovate
new products and it further expanded its manufacturing capabilities of producing flooring
products. With the growth in demand, the company made heavy investment in the flooring
items and developed its sales and manufacturing capabilities overseas in countries such as
South Africa, Australia and New Zealand. James Halstead has a wide portfolio of the
products that is sourced from outside as well as manufactured. Flooring manufacture is the
major product of the company and their technologists are capable of making a homogenous
vinyl sheet product (jameshalstead.com 2020). The company carries out its operation in
various economic environment and forms a contributor to the gross domestic product of the
company.
Discussion:
Section A:
The financial performance of James Halstead is evaluated using the technique of ratio
analysis and evaluation of the financial stability of the company is done by comparing it with
the competitor. Several ratios such as profitability, solvency, efficiency, liquidity have been
examined to assess the financial performance of the company. In addition to this, some non-
financial ratios such as employee turnover and customer retention ratios have been computed
to analyze its non-financial performance and its relationship with key stakeholders such as
Paraphrase This Document
Need a fresh take? Get an instant paraphrase of this document with our AI Paraphraser
FINANCIAL DECISION MAKING
employees and customers. Interpretation of the financial figures would help in identifying the
favorable or unfavorable movements of the financial figures (Danoshana and Ravivathani
2019).
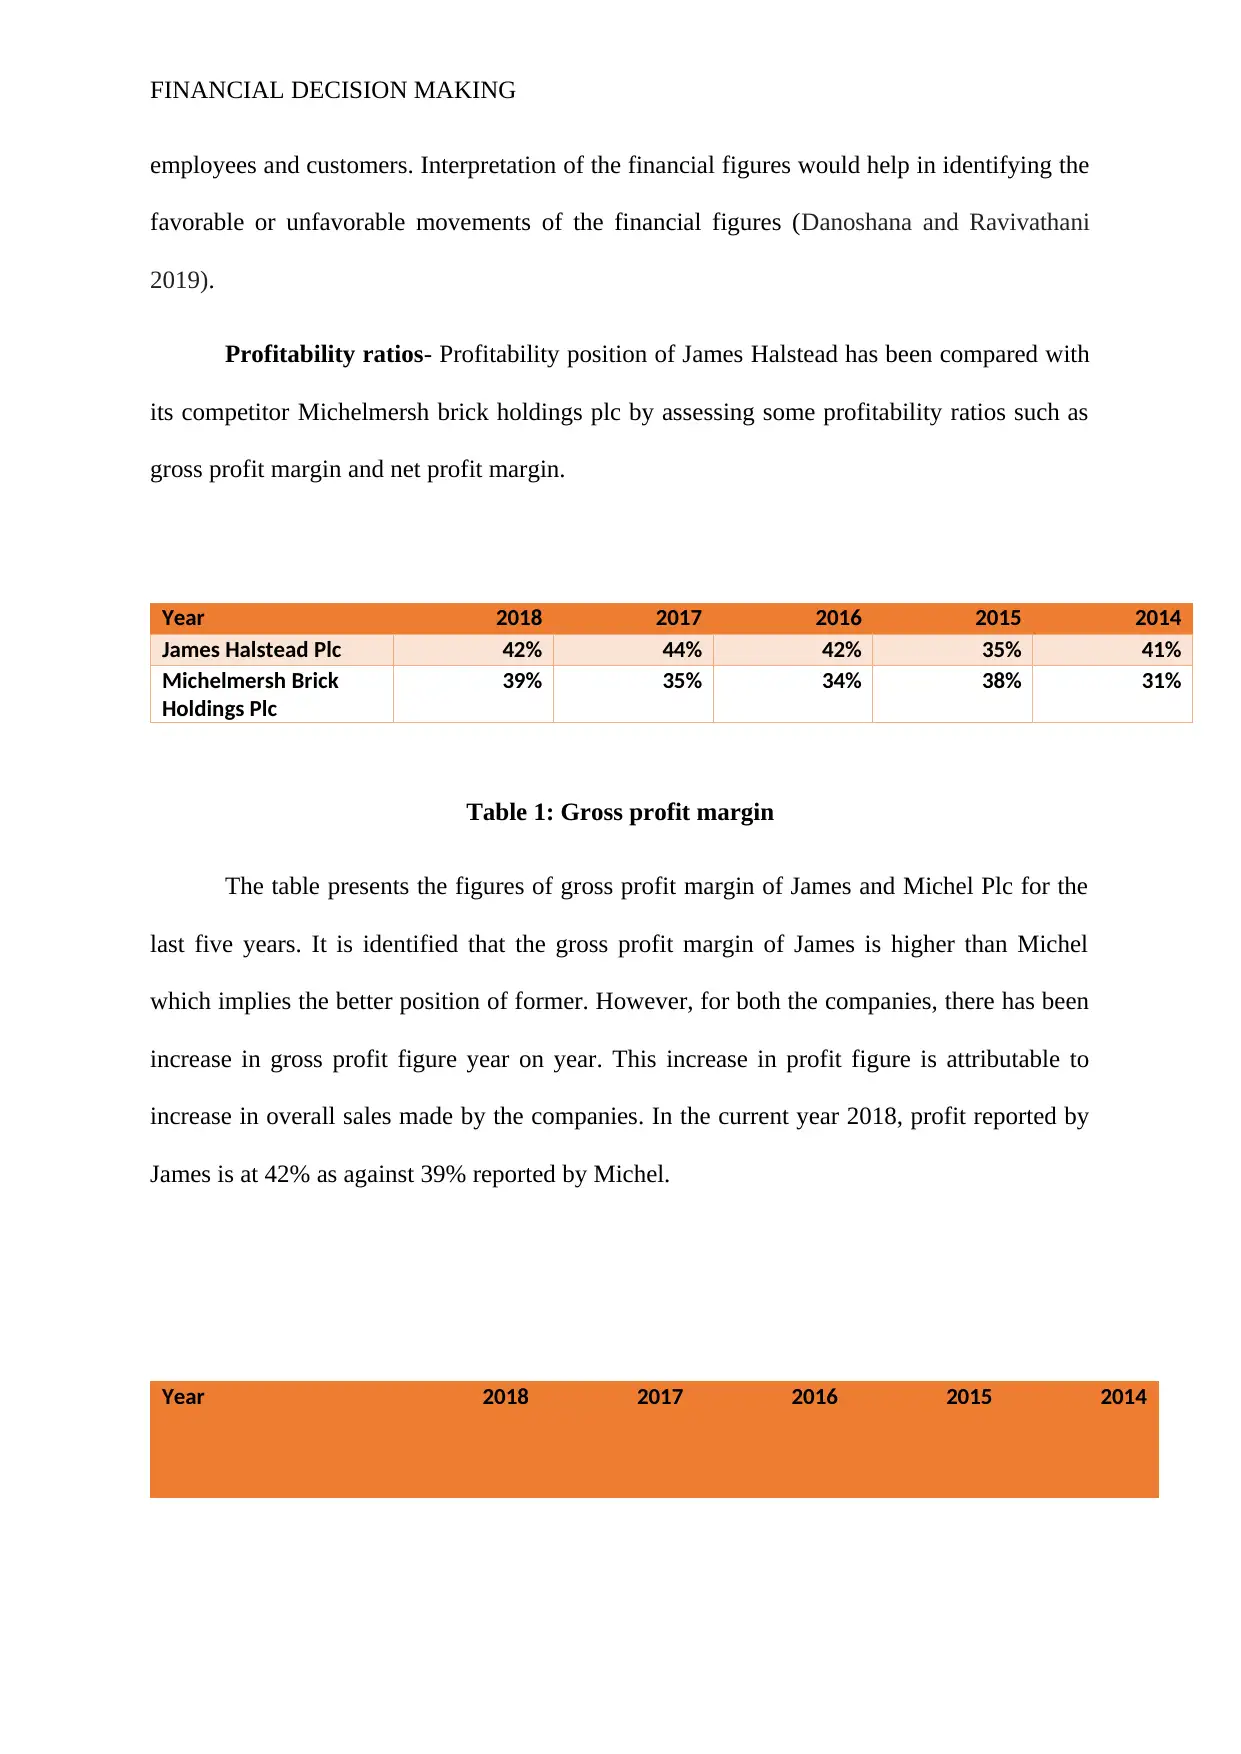
Profitability ratios- Profitability position of James Halstead has been compared with
its competitor Michelmersh brick holdings plc by assessing some profitability ratios such as
gross profit margin and net profit margin.
Year 2018 2017 2016 2015 2014
James Halstead Plc 42% 44% 42% 35% 41%
Michelmersh Brick
Holdings Plc
39% 35% 34% 38% 31%
Table 1: Gross profit margin
The table presents the figures of gross profit margin of James and Michel Plc for the
last five years. It is identified that the gross profit margin of James is higher than Michel
which implies the better position of former. However, for both the companies, there has been
increase in gross profit figure year on year. This increase in profit figure is attributable to
increase in overall sales made by the companies. In the current year 2018, profit reported by
James is at 42% as against 39% reported by Michel.
Year 2018 2017 2016 2015 2014
employees and customers. Interpretation of the financial figures would help in identifying the
favorable or unfavorable movements of the financial figures (Danoshana and Ravivathani
2019).
Profitability ratios- Profitability position of James Halstead has been compared with
its competitor Michelmersh brick holdings plc by assessing some profitability ratios such as
gross profit margin and net profit margin.
Year 2018 2017 2016 2015 2014
James Halstead Plc 42% 44% 42% 35% 41%
Michelmersh Brick
Holdings Plc
39% 35% 34% 38% 31%
Table 1: Gross profit margin
The table presents the figures of gross profit margin of James and Michel Plc for the
last five years. It is identified that the gross profit margin of James is higher than Michel
which implies the better position of former. However, for both the companies, there has been
increase in gross profit figure year on year. This increase in profit figure is attributable to
increase in overall sales made by the companies. In the current year 2018, profit reported by
James is at 42% as against 39% reported by Michel.
Year 2018 2017 2016 2015 2014
FINANCIAL DECISION MAKING
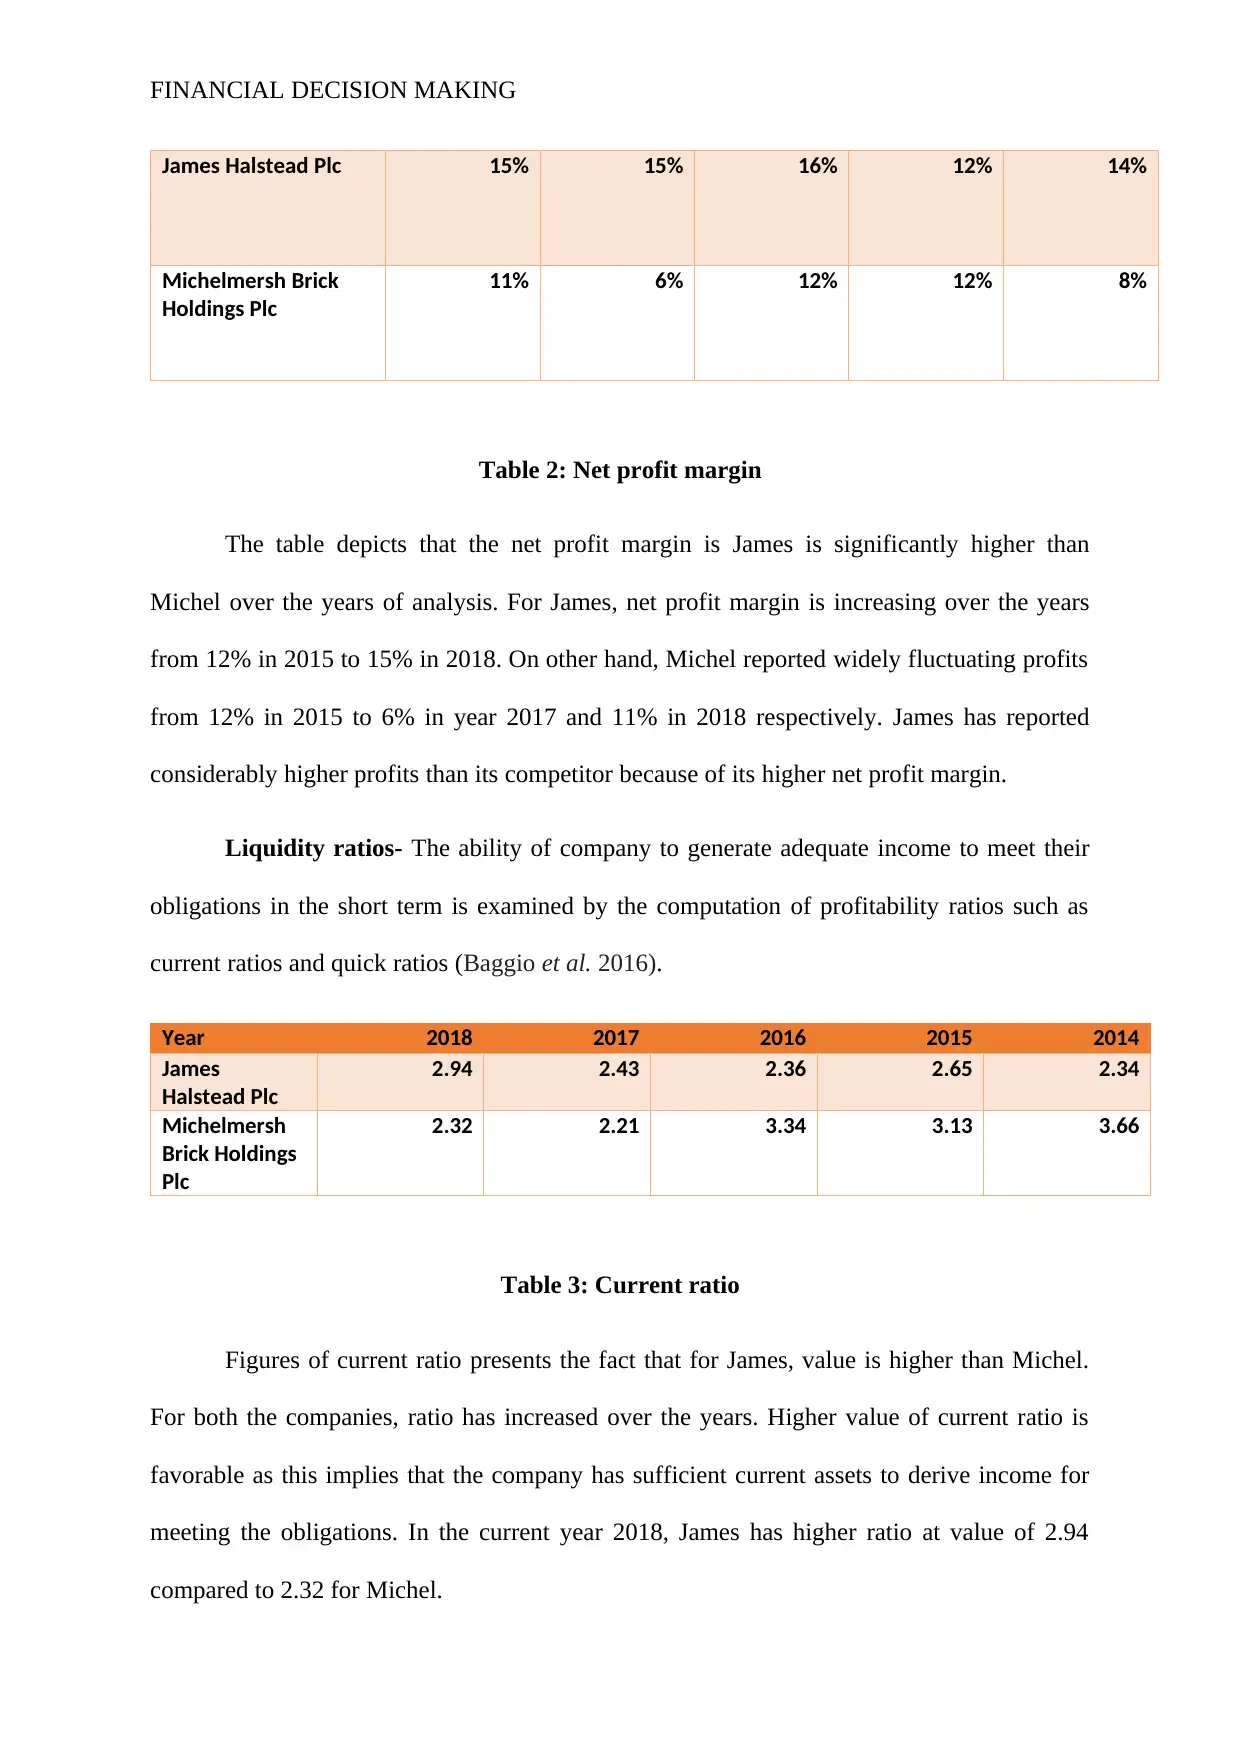
James Halstead Plc 15% 15% 16% 12% 14%
Michelmersh Brick
Holdings Plc
11% 6% 12% 12% 8%
Table 2: Net profit margin
The table depicts that the net profit margin is James is significantly higher than
Michel over the years of analysis. For James, net profit margin is increasing over the years
from 12% in 2015 to 15% in 2018. On other hand, Michel reported widely fluctuating profits
from 12% in 2015 to 6% in year 2017 and 11% in 2018 respectively. James has reported
considerably higher profits than its competitor because of its higher net profit margin.
Liquidity ratios- The ability of company to generate adequate income to meet their
obligations in the short term is examined by the computation of profitability ratios such as
current ratios and quick ratios (Baggio et al. 2016).
Year 2018 2017 2016 2015 2014
James
Halstead Plc
2.94 2.43 2.36 2.65 2.34
Michelmersh
Brick Holdings
Plc
2.32 2.21 3.34 3.13 3.66
Table 3: Current ratio
Figures of current ratio presents the fact that for James, value is higher than Michel.
For both the companies, ratio has increased over the years. Higher value of current ratio is
favorable as this implies that the company has sufficient current assets to derive income for
meeting the obligations. In the current year 2018, James has higher ratio at value of 2.94
compared to 2.32 for Michel.
⊘ This is a preview!⊘
Do you want full access?
Subscribe today to unlock all pages.
Trusted by 1+ million students worldwide
FINANCIAL DECISION MAKING
Year 2018 2017 2016 2015 2014
James
Halstead Plc
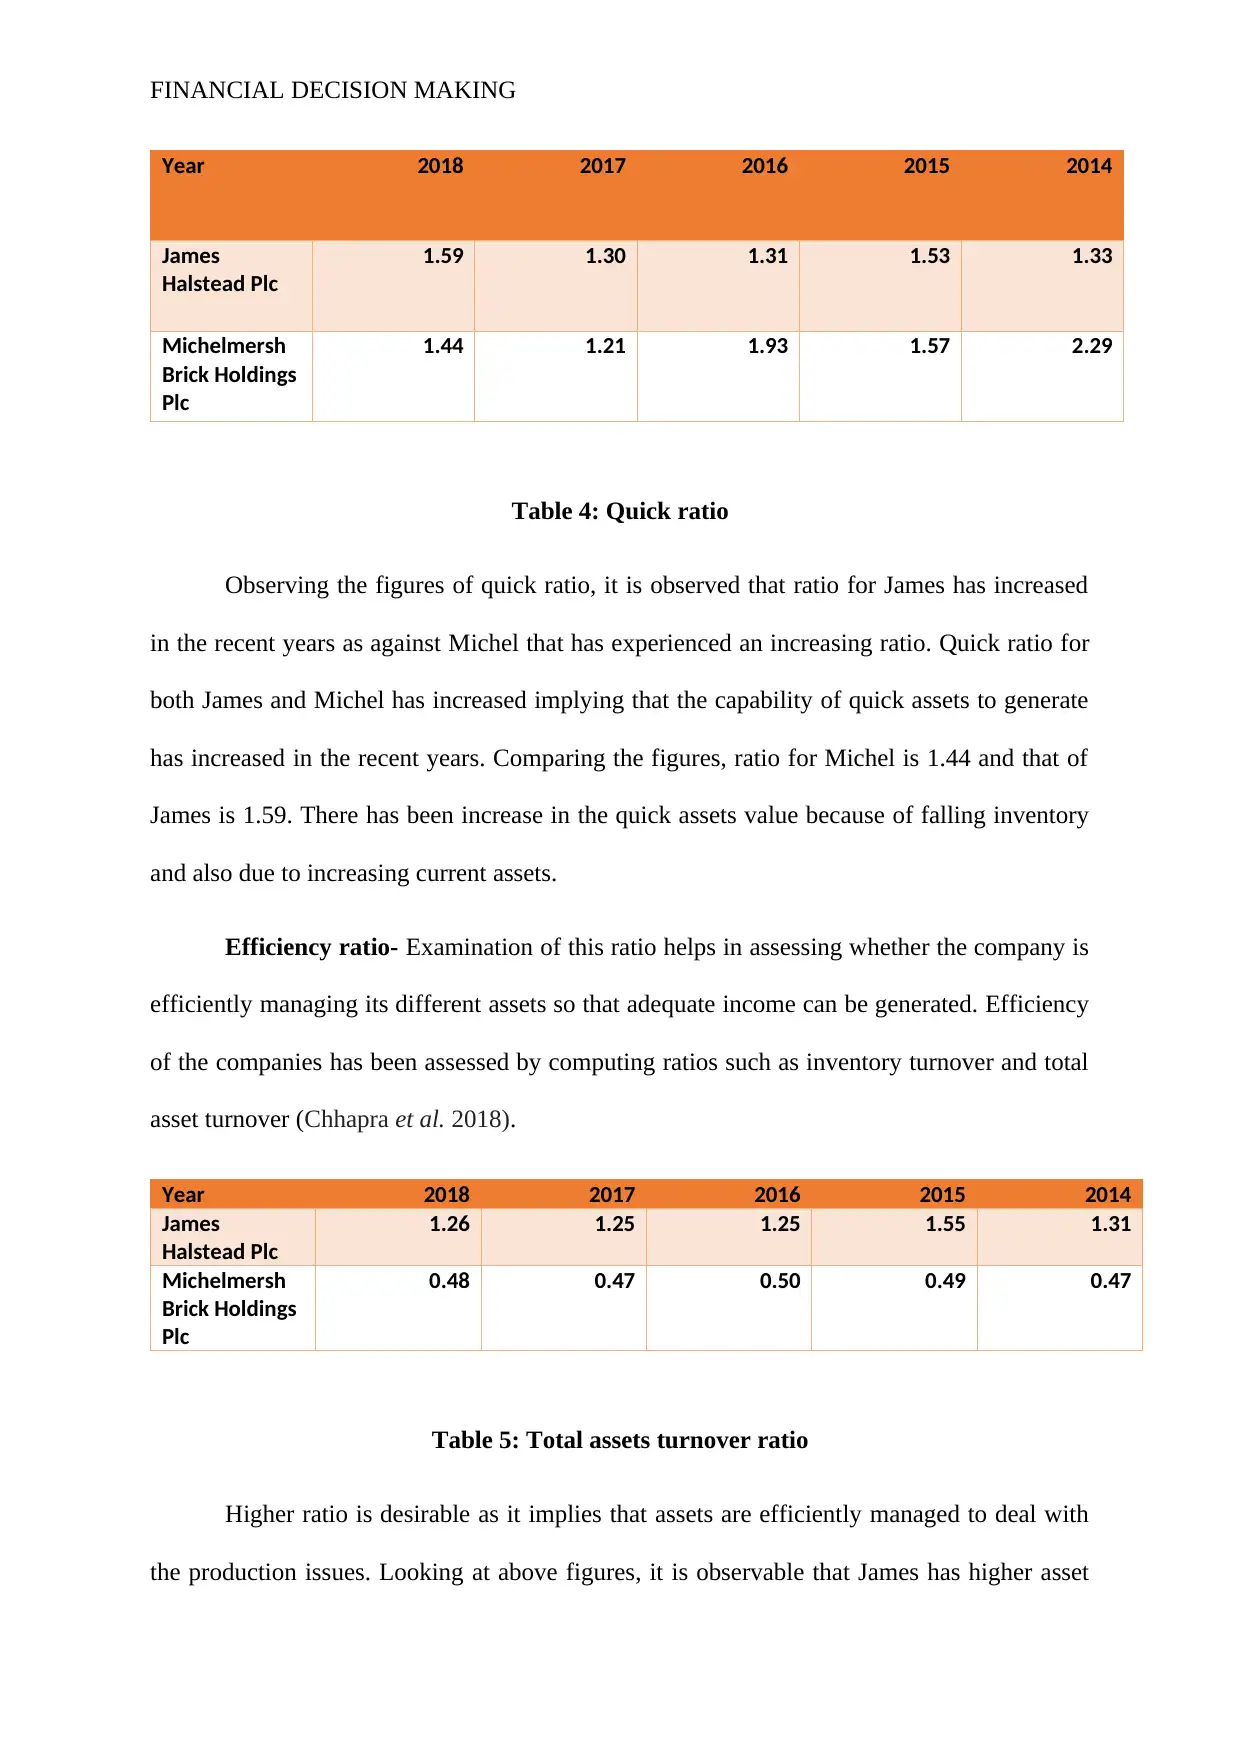
1.59 1.30 1.31 1.53 1.33
Michelmersh
Brick Holdings
Plc
1.44 1.21 1.93 1.57 2.29
Table 4: Quick ratio
Observing the figures of quick ratio, it is observed that ratio for James has increased
in the recent years as against Michel that has experienced an increasing ratio. Quick ratio for
both James and Michel has increased implying that the capability of quick assets to generate
has increased in the recent years. Comparing the figures, ratio for Michel is 1.44 and that of
James is 1.59. There has been increase in the quick assets value because of falling inventory
and also due to increasing current assets.
Efficiency ratio- Examination of this ratio helps in assessing whether the company is
efficiently managing its different assets so that adequate income can be generated. Efficiency
of the companies has been assessed by computing ratios such as inventory turnover and total
asset turnover (Chhapra et al. 2018).
Year 2018 2017 2016 2015 2014
James
Halstead Plc
1.26 1.25 1.25 1.55 1.31
Michelmersh
Brick Holdings
Plc
0.48 0.47 0.50 0.49 0.47
Table 5: Total assets turnover ratio
Higher ratio is desirable as it implies that assets are efficiently managed to deal with
the production issues. Looking at above figures, it is observable that James has higher asset
Year 2018 2017 2016 2015 2014
James
Halstead Plc
1.59 1.30 1.31 1.53 1.33
Michelmersh
Brick Holdings
Plc
1.44 1.21 1.93 1.57 2.29
Table 4: Quick ratio
Observing the figures of quick ratio, it is observed that ratio for James has increased
in the recent years as against Michel that has experienced an increasing ratio. Quick ratio for
both James and Michel has increased implying that the capability of quick assets to generate
has increased in the recent years. Comparing the figures, ratio for Michel is 1.44 and that of
James is 1.59. There has been increase in the quick assets value because of falling inventory
and also due to increasing current assets.
Efficiency ratio- Examination of this ratio helps in assessing whether the company is
efficiently managing its different assets so that adequate income can be generated. Efficiency
of the companies has been assessed by computing ratios such as inventory turnover and total
asset turnover (Chhapra et al. 2018).
Year 2018 2017 2016 2015 2014
James
Halstead Plc
1.26 1.25 1.25 1.55 1.31
Michelmersh
Brick Holdings
Plc
0.48 0.47 0.50 0.49 0.47
Table 5: Total assets turnover ratio
Higher ratio is desirable as it implies that assets are efficiently managed to deal with
the production issues. Looking at above figures, it is observable that James has higher asset
Paraphrase This Document
Need a fresh take? Get an instant paraphrase of this document with our AI Paraphraser
FINANCIAL DECISION MAKING
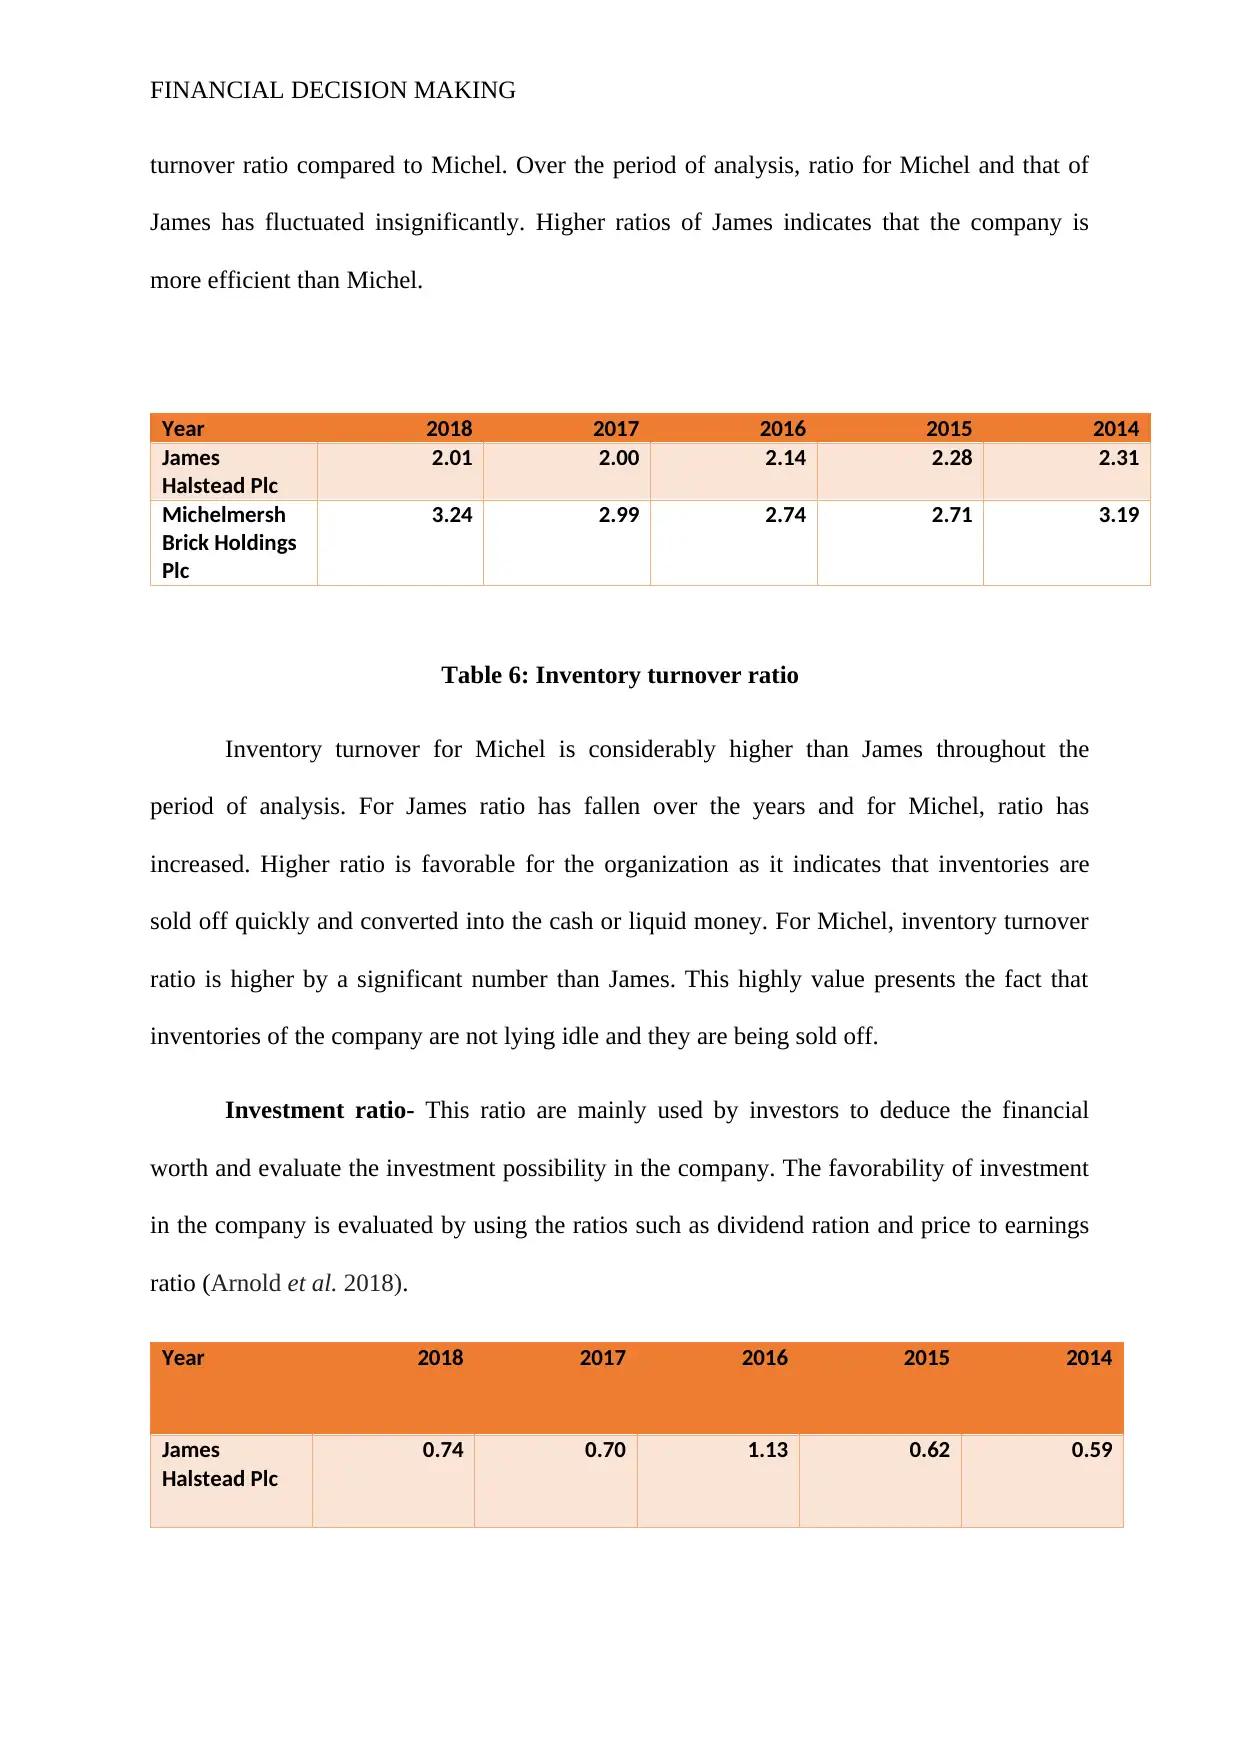
turnover ratio compared to Michel. Over the period of analysis, ratio for Michel and that of
James has fluctuated insignificantly. Higher ratios of James indicates that the company is
more efficient than Michel.
Year 2018 2017 2016 2015 2014
James
Halstead Plc
2.01 2.00 2.14 2.28 2.31
Michelmersh
Brick Holdings
Plc
3.24 2.99 2.74 2.71 3.19
Table 6: Inventory turnover ratio
Inventory turnover for Michel is considerably higher than James throughout the
period of analysis. For James ratio has fallen over the years and for Michel, ratio has
increased. Higher ratio is favorable for the organization as it indicates that inventories are
sold off quickly and converted into the cash or liquid money. For Michel, inventory turnover
ratio is higher by a significant number than James. This highly value presents the fact that
inventories of the company are not lying idle and they are being sold off.
Investment ratio- This ratio are mainly used by investors to deduce the financial
worth and evaluate the investment possibility in the company. The favorability of investment
in the company is evaluated by using the ratios such as dividend ration and price to earnings
ratio (Arnold et al. 2018).
Year 2018 2017 2016 2015 2014
James
Halstead Plc
0.74 0.70 1.13 0.62 0.59
FINANCIAL DECISION MAKING
Michelmersh
Brick Holdings
Plc
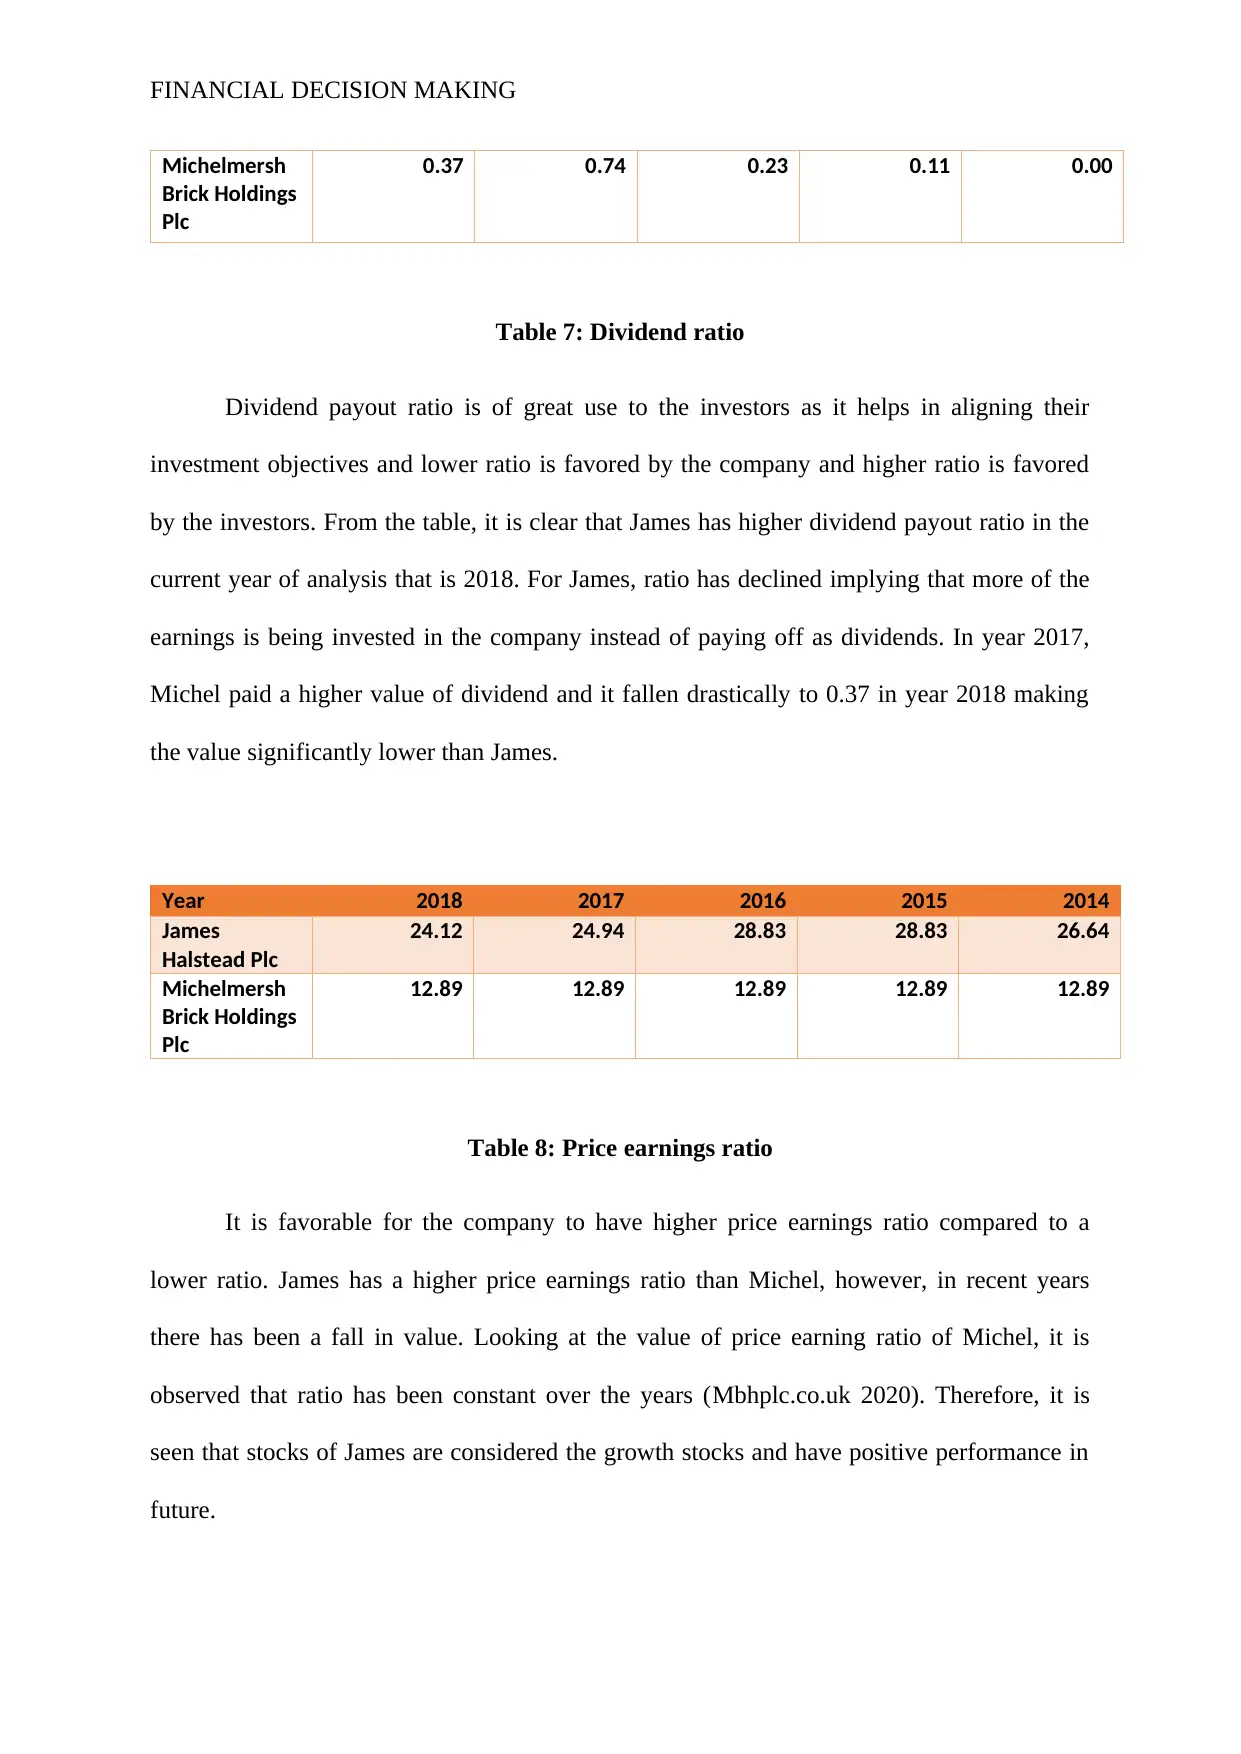
0.37 0.74 0.23 0.11 0.00
Table 7: Dividend ratio
Dividend payout ratio is of great use to the investors as it helps in aligning their
investment objectives and lower ratio is favored by the company and higher ratio is favored
by the investors. From the table, it is clear that James has higher dividend payout ratio in the
current year of analysis that is 2018. For James, ratio has declined implying that more of the
earnings is being invested in the company instead of paying off as dividends. In year 2017,
Michel paid a higher value of dividend and it fallen drastically to 0.37 in year 2018 making
the value significantly lower than James.
Year 2018 2017 2016 2015 2014
James
Halstead Plc
24.12 24.94 28.83 28.83 26.64
Michelmersh
Brick Holdings
Plc
12.89 12.89 12.89 12.89 12.89
Table 8: Price earnings ratio
It is favorable for the company to have higher price earnings ratio compared to a
lower ratio. James has a higher price earnings ratio than Michel, however, in recent years
there has been a fall in value. Looking at the value of price earning ratio of Michel, it is
observed that ratio has been constant over the years (Mbhplc.co.uk 2020). Therefore, it is
seen that stocks of James are considered the growth stocks and have positive performance in
future.
Michelmersh
Brick Holdings
Plc
0.37 0.74 0.23 0.11 0.00
Table 7: Dividend ratio
Dividend payout ratio is of great use to the investors as it helps in aligning their
investment objectives and lower ratio is favored by the company and higher ratio is favored
by the investors. From the table, it is clear that James has higher dividend payout ratio in the
current year of analysis that is 2018. For James, ratio has declined implying that more of the
earnings is being invested in the company instead of paying off as dividends. In year 2017,
Michel paid a higher value of dividend and it fallen drastically to 0.37 in year 2018 making
the value significantly lower than James.
Year 2018 2017 2016 2015 2014
James
Halstead Plc
24.12 24.94 28.83 28.83 26.64
Michelmersh
Brick Holdings
Plc
12.89 12.89 12.89 12.89 12.89
Table 8: Price earnings ratio
It is favorable for the company to have higher price earnings ratio compared to a
lower ratio. James has a higher price earnings ratio than Michel, however, in recent years
there has been a fall in value. Looking at the value of price earning ratio of Michel, it is
observed that ratio has been constant over the years (Mbhplc.co.uk 2020). Therefore, it is
seen that stocks of James are considered the growth stocks and have positive performance in
future.
⊘ This is a preview!⊘
Do you want full access?
Subscribe today to unlock all pages.
Trusted by 1+ million students worldwide
FINANCIAL DECISION MAKING
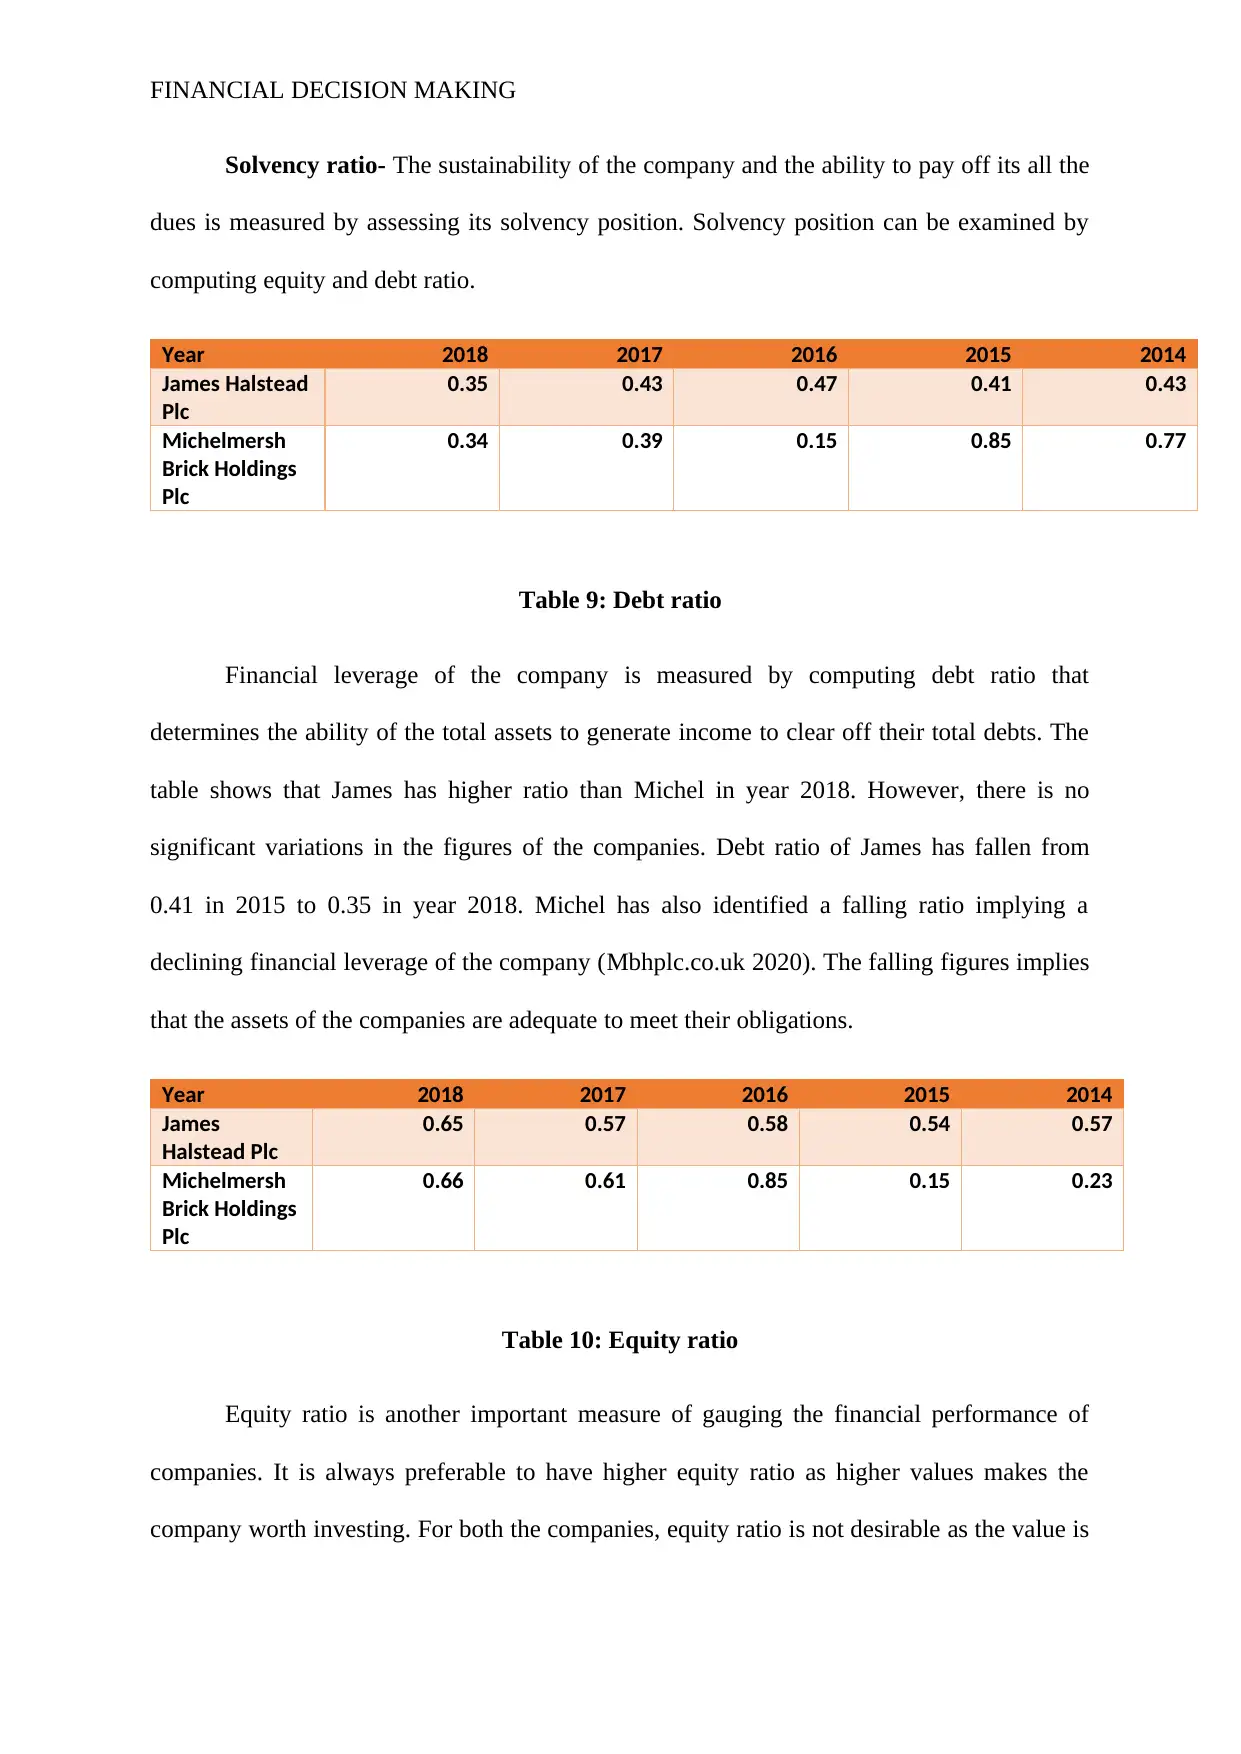
Solvency ratio- The sustainability of the company and the ability to pay off its all the
dues is measured by assessing its solvency position. Solvency position can be examined by
computing equity and debt ratio.
Year 2018 2017 2016 2015 2014
James Halstead
Plc
0.35 0.43 0.47 0.41 0.43
Michelmersh
Brick Holdings
Plc
0.34 0.39 0.15 0.85 0.77
Table 9: Debt ratio
Financial leverage of the company is measured by computing debt ratio that
determines the ability of the total assets to generate income to clear off their total debts. The
table shows that James has higher ratio than Michel in year 2018. However, there is no
significant variations in the figures of the companies. Debt ratio of James has fallen from
0.41 in 2015 to 0.35 in year 2018. Michel has also identified a falling ratio implying a
declining financial leverage of the company (Mbhplc.co.uk 2020). The falling figures implies
that the assets of the companies are adequate to meet their obligations.
Year 2018 2017 2016 2015 2014
James
Halstead Plc
0.65 0.57 0.58 0.54 0.57
Michelmersh
Brick Holdings
Plc
0.66 0.61 0.85 0.15 0.23
Table 10: Equity ratio
Equity ratio is another important measure of gauging the financial performance of
companies. It is always preferable to have higher equity ratio as higher values makes the
company worth investing. For both the companies, equity ratio is not desirable as the value is
Paraphrase This Document
Need a fresh take? Get an instant paraphrase of this document with our AI Paraphraser

FINANCIAL DECISION MAKING
less than 1 and implies that investors are not increasing their investment by a significant
amount. Nevertheless, the companies have identified increase equity ratio over the years.
Non-financial performance of the company is evaluated by computing ratio such as
employee turnover. A company desires to have lower employee turnover ratio as against
higher ratios. This is so because lower ratio implies satisfied employees and lower rate of
attrition. Higher ratio on other hand implies that poor performers are leaving the company or
the company is performing poorly due to which they are facing higher attrition rate (Liu
2019).
Year 2018 2017 2016 2015 2014
James
Halstead Plc
1.21 0.97 0.72 0.00 0.12
Michelmersh
Brick Holdings
Plc
3.42 2.68 0.67 1.73 2.52
Table 11: Employee turnover ratio
The table depicts that Michel is having a higher employee turnover ratio than James.
Employee turnover of Michel has increased every year implying that most of the employees
are leaving the company. On other hand, employees of James are much satisfied because of
the satisfactory performance of the organization which is satisfying the employees and they
are facing lower employee turnover ratio (Ahmed et al. 2017).
Interpretation of the financial figures of James Halstead Plc and Michelmersh brick
holdings plc implies that the overall financial performance of former is better than latter.
James is considerably profitable than Michel as they have higher capability to generate profit
from selling the products. On other hand, both the organizations are witnessing higher cost of
sales which is lower down their net profit margin. It is required to manage their cost of
acquiring inventory so that the cost sales reduces and profits are left less impacted
FINANCIAL DECISION MAKING
(Valaskova et al. 2016). When it comes to managing the assets, James is in better position as
they are able to effectively generate income from utilizing their assets. From the perspective
of investment, James is more attractive to investors with its higher dividend payout and price
earnings ratios. Furthermore, financial leverage of Michel is higher than that of James which
indicates that company relies more on debt compared to equity. In the event of excess
dependence on debts, management is required to investigate the matters.
Section B:
James Halstead plc complies well with the corporate governance as per their
published corporate governance reports. This organization follows Quoted Company Alliance
(QCA) code which is made of ten principles to ensure the framework in the organization. The
size of the operation in this firm is appropriate with this code. The chairman has taken the
responsibility to manage the issues around their business. As per QCA principles, James
Halstead plc established proper strategy which helped the organization in promoting long
term value to the shareholders (James Halstead, 2020). It also helped them to mitigate the risk
factors as discussed in their report which can be helpful in reaching the target as discussed in
the plans. QCA also helped the firm to understand the increase of dividend over years also
has encouraged the board in payment of dividend over years (Baggio et.al,2016).
Understanding of dividend is necessary as it helps the organization to reach their goals.
Along with this, the company also understands the responsibility of the stakeholders in terms
of any impact on their business environment and manufacture. The board recognizes their
employers, customers, suppliers in their operations who have effect on the products and the
market of the organization. James Halstead also reports their risk management annually in
their reports. The communication in their firms helps to operate risk factors effectively in
⊘ This is a preview!⊘
Do you want full access?
Subscribe today to unlock all pages.
Trusted by 1+ million students worldwide
1 out of 17
Related Documents


Your All-in-One AI-Powered Toolkit for Academic Success.
+13062052269
info@desklib.com
Available 24*7 on WhatsApp / Email
![[object Object]](/_next/static/media/star-bottom.7253800d.svg)
Unlock your academic potential
Copyright © 2020–2026 A2Z Services. All Rights Reserved. Developed and managed by ZUCOL.