Java Project: Analyzing the NYC Flights Dataset from CSV

Verified

Added on  2023/06/10

|26
|1439
|140
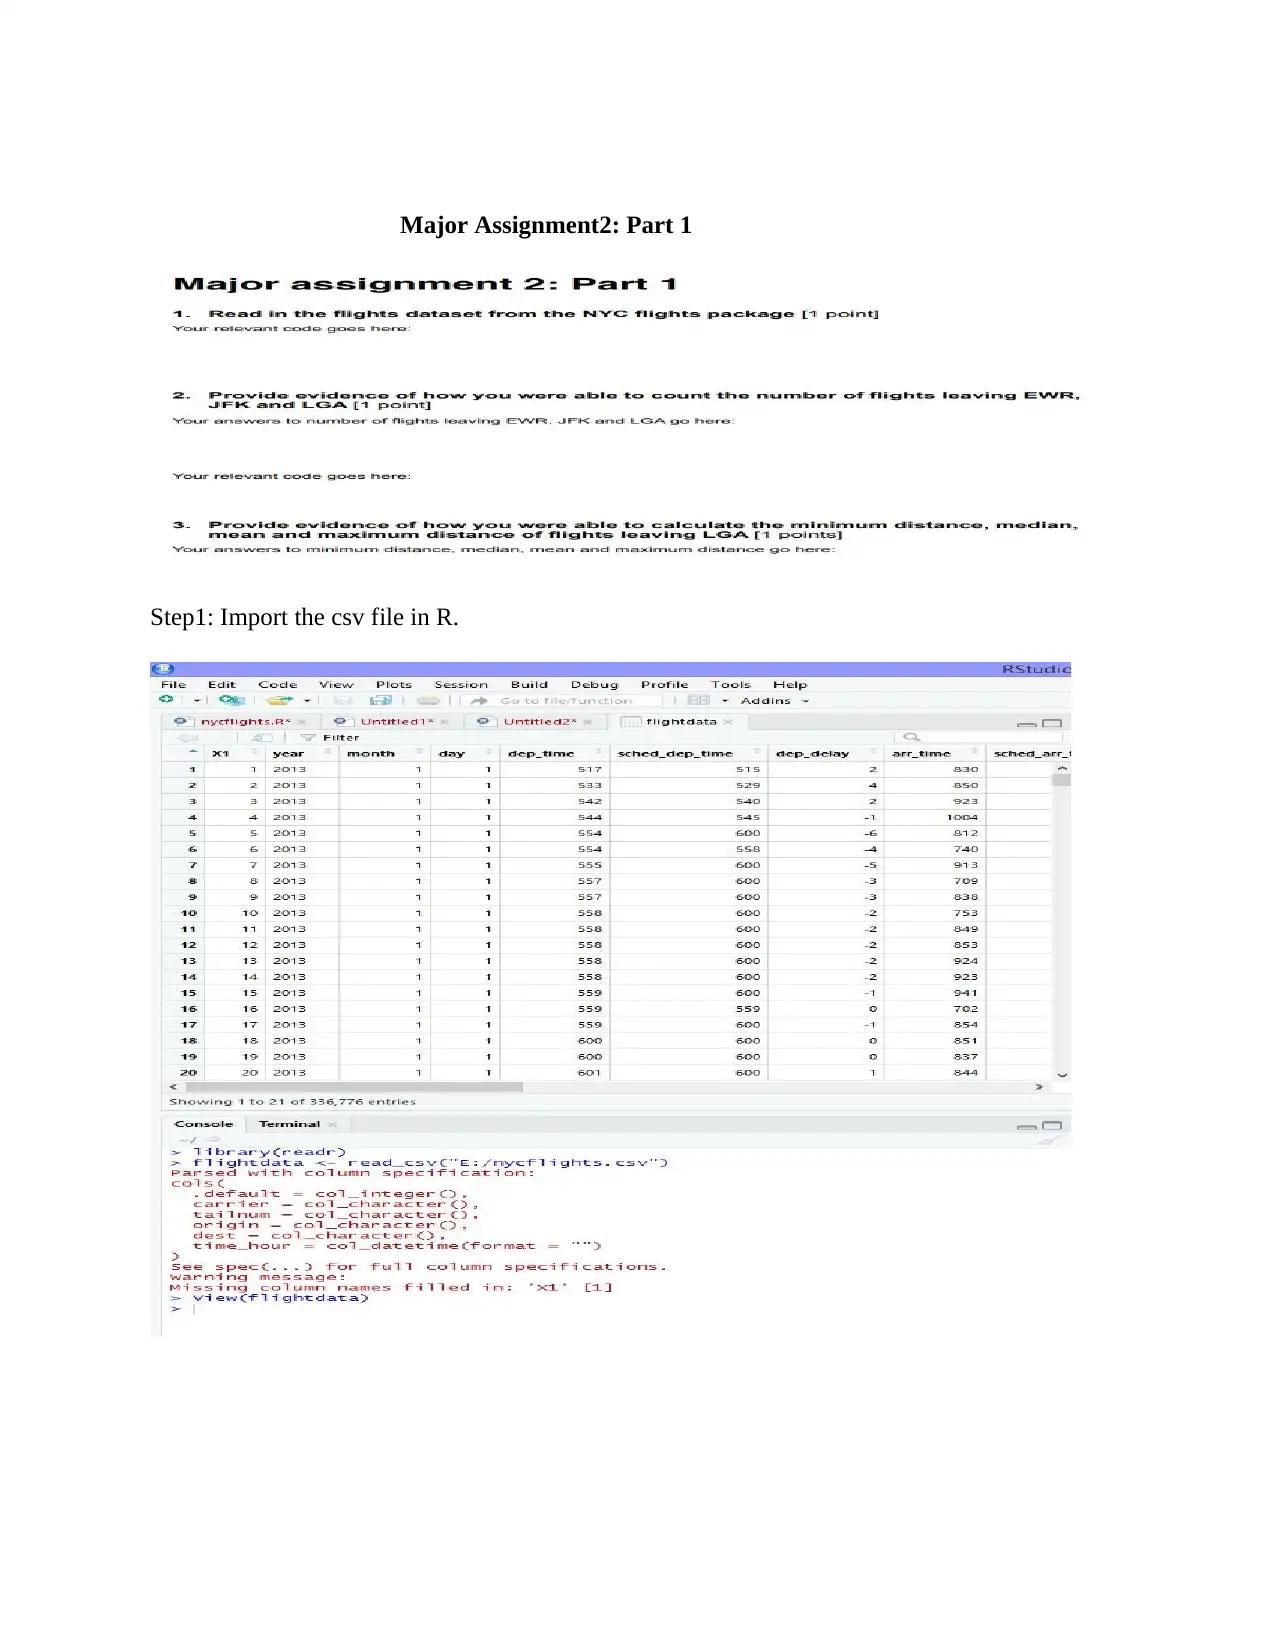
Practical Assignment
AI Summary
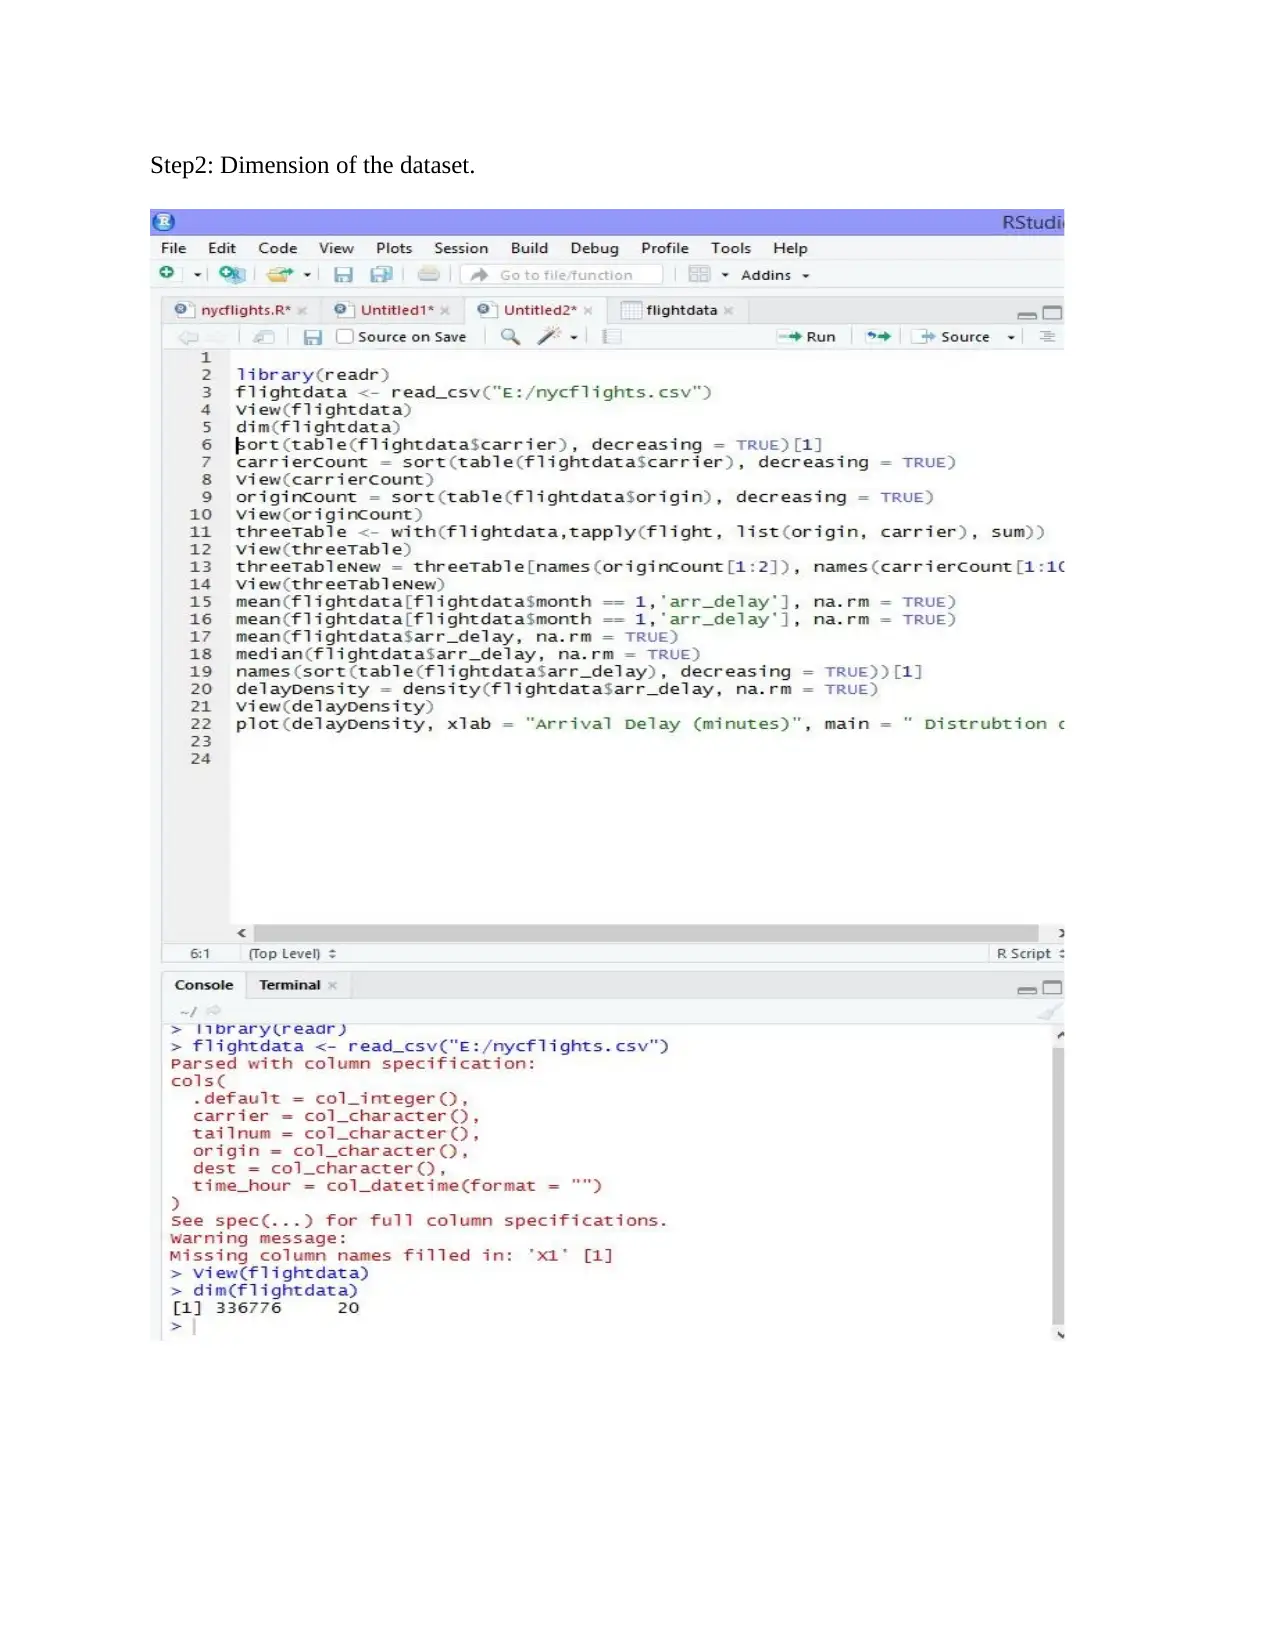
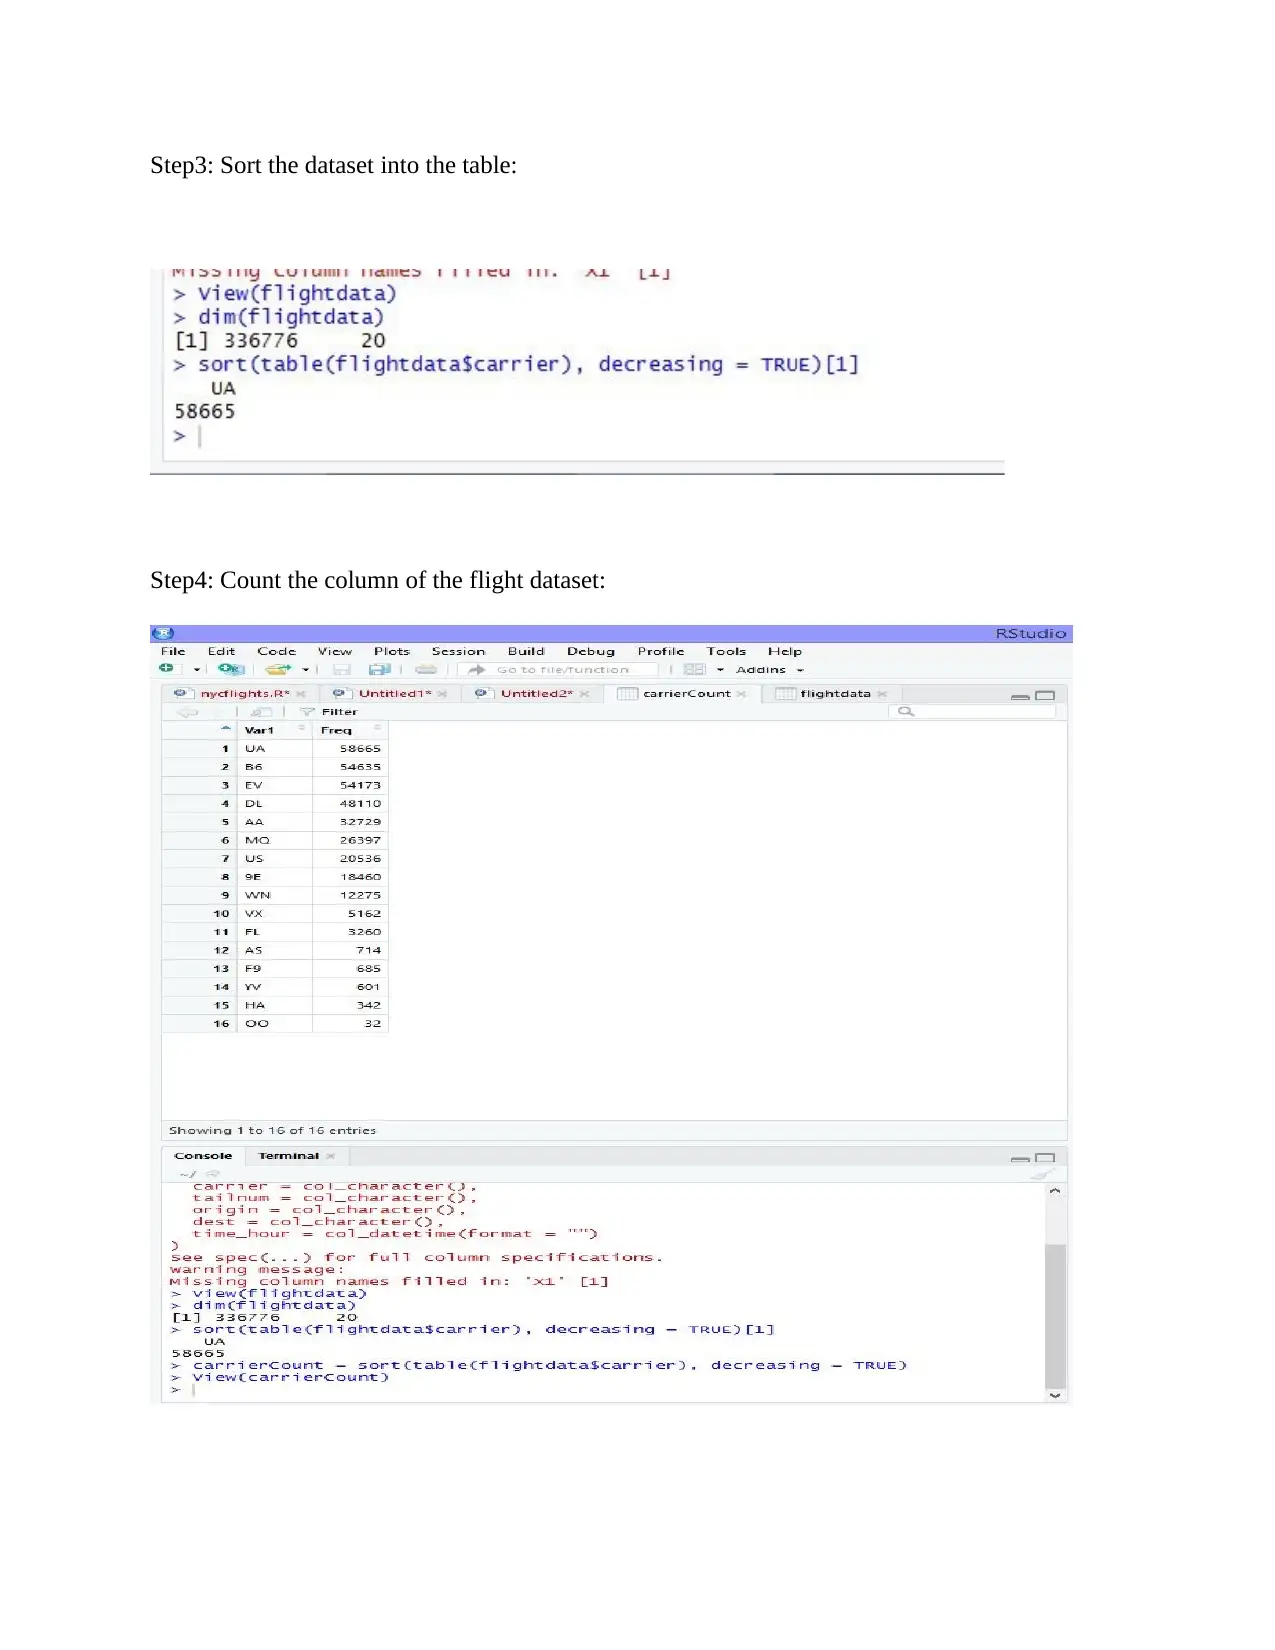
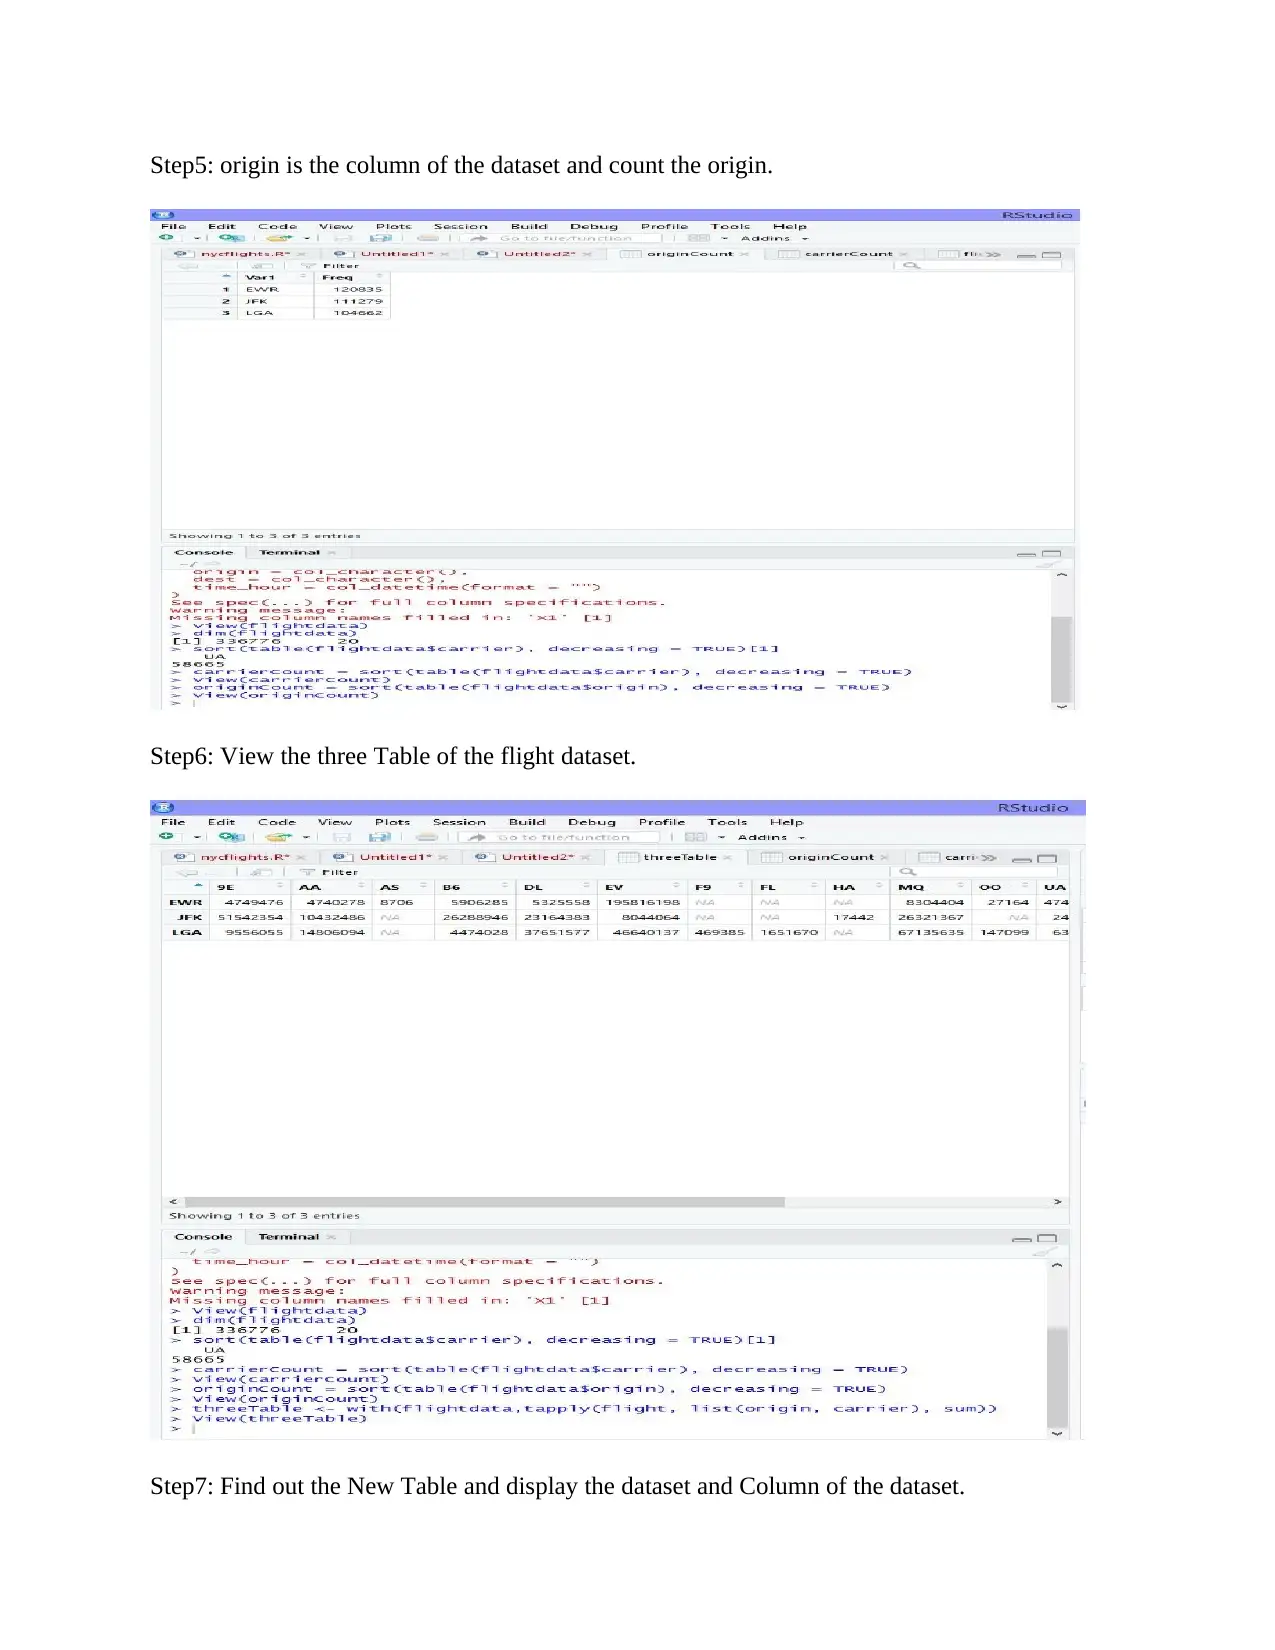
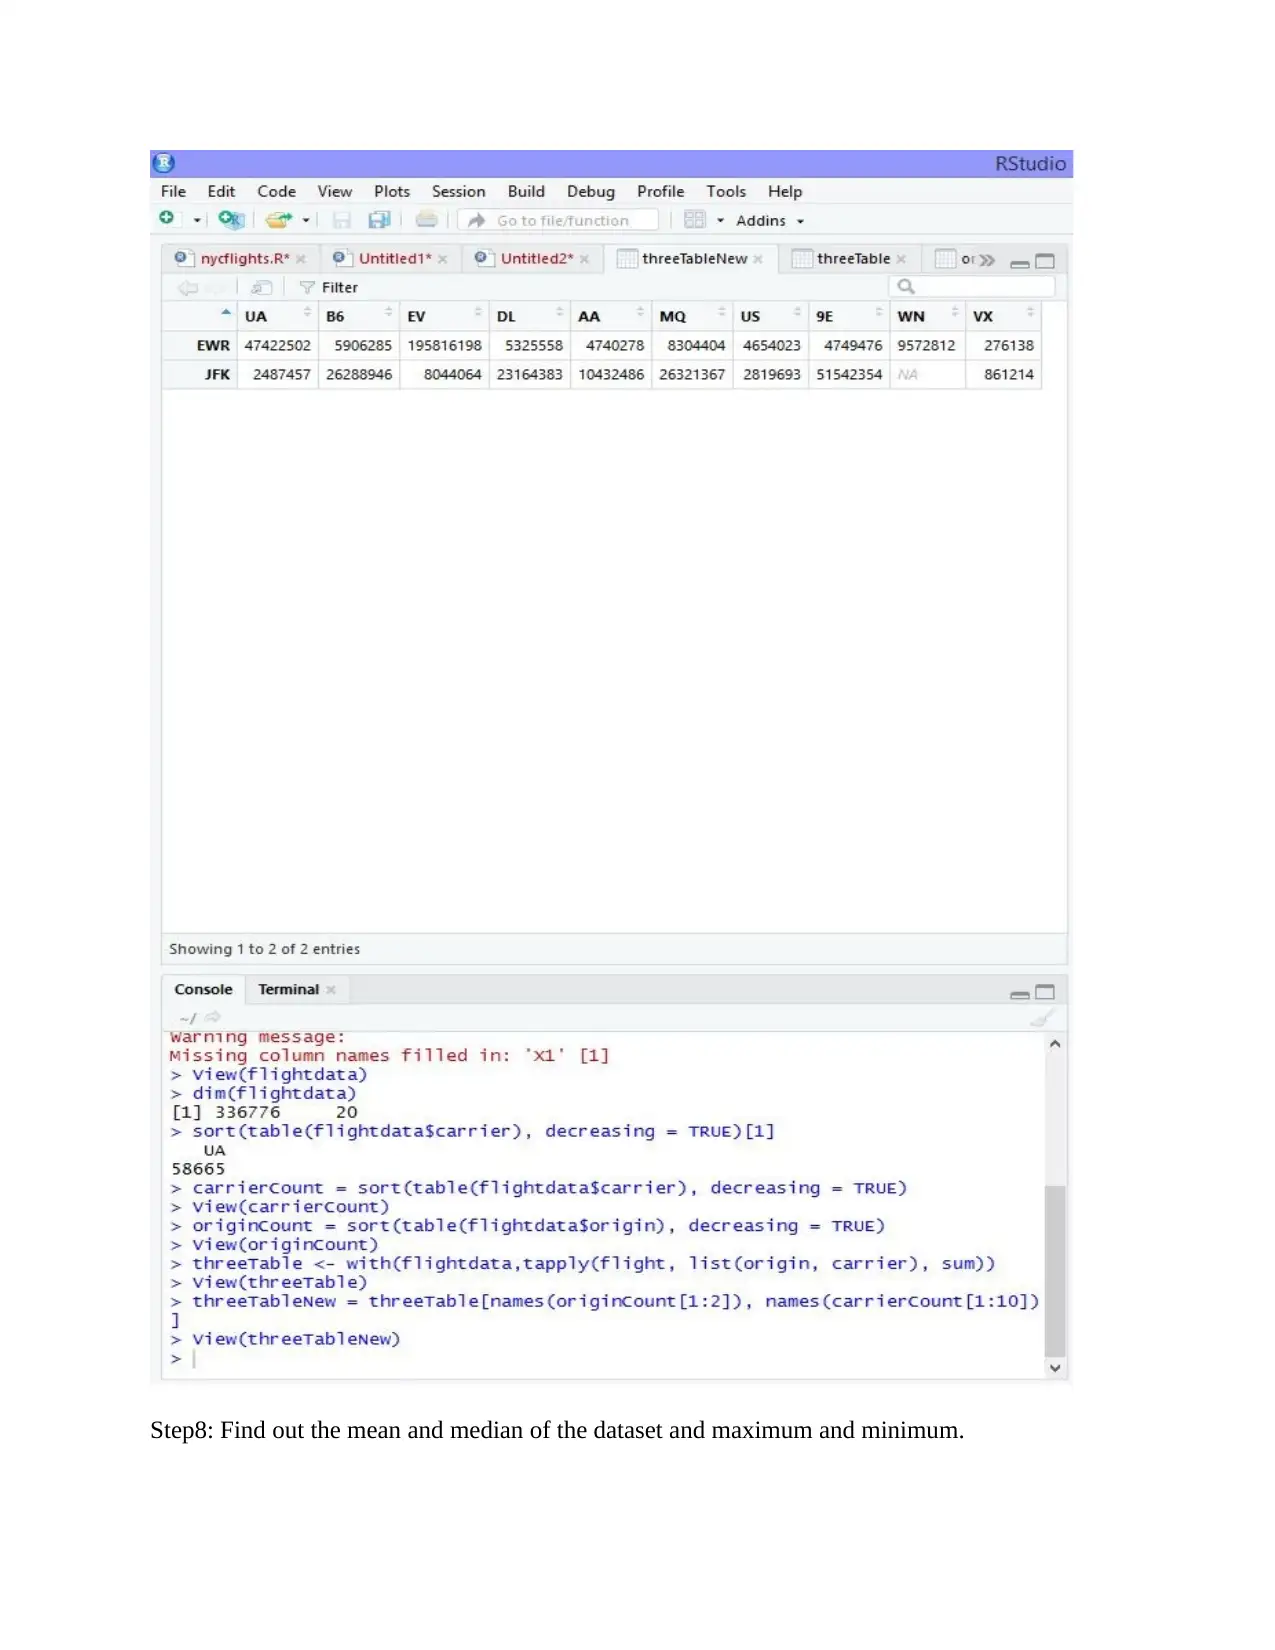
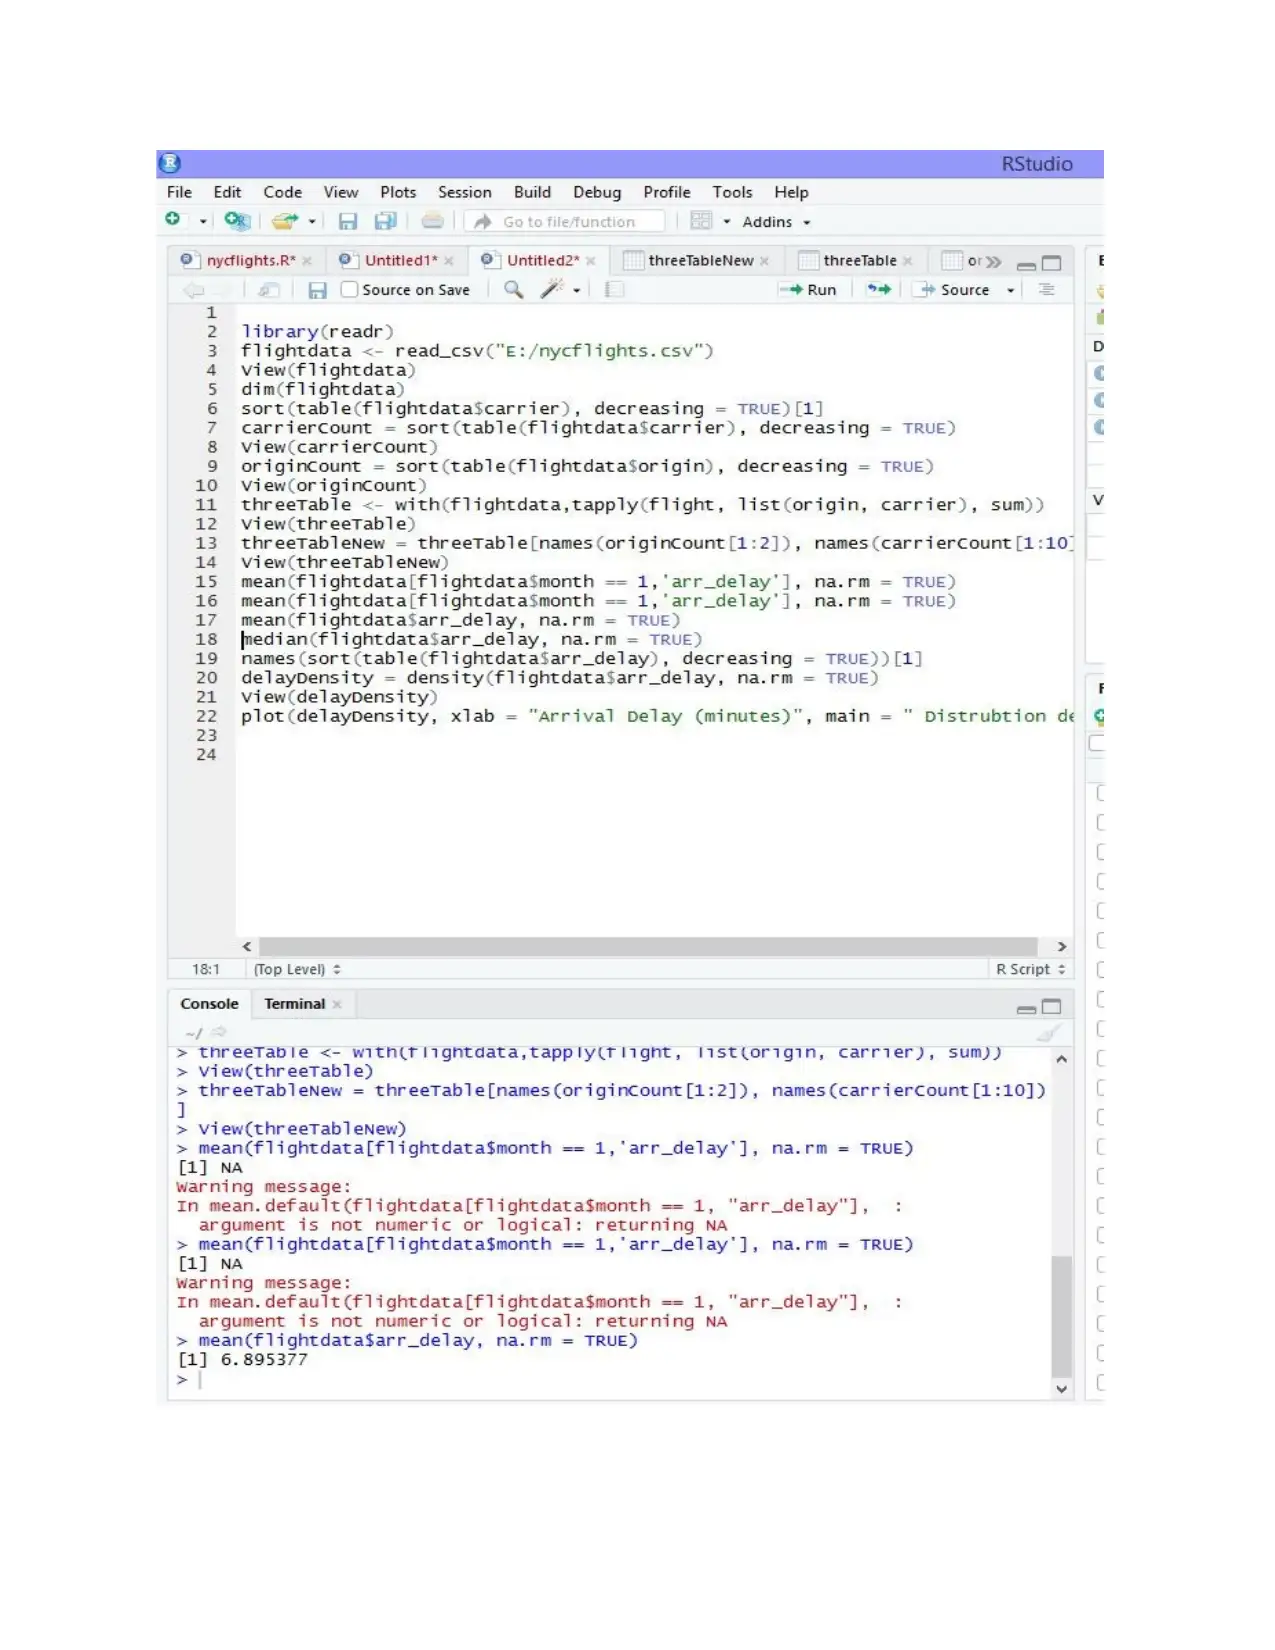
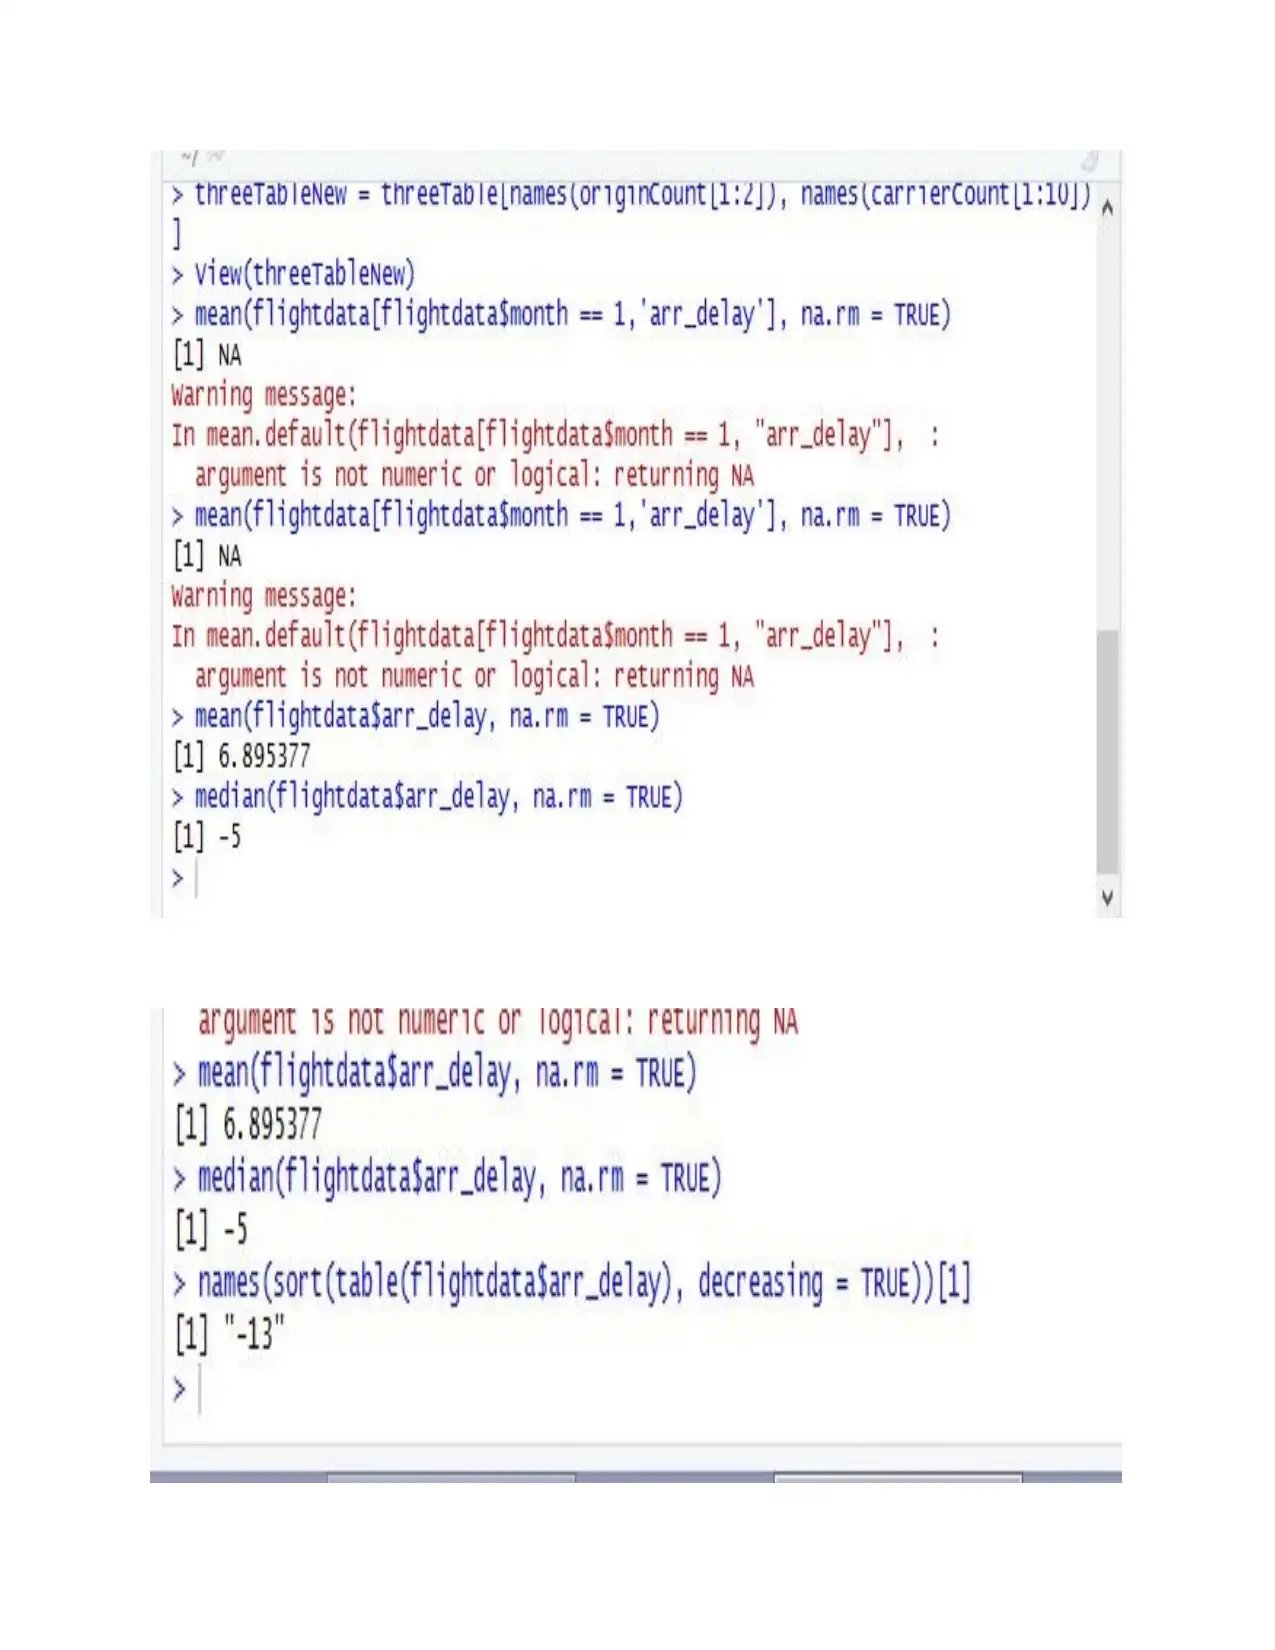
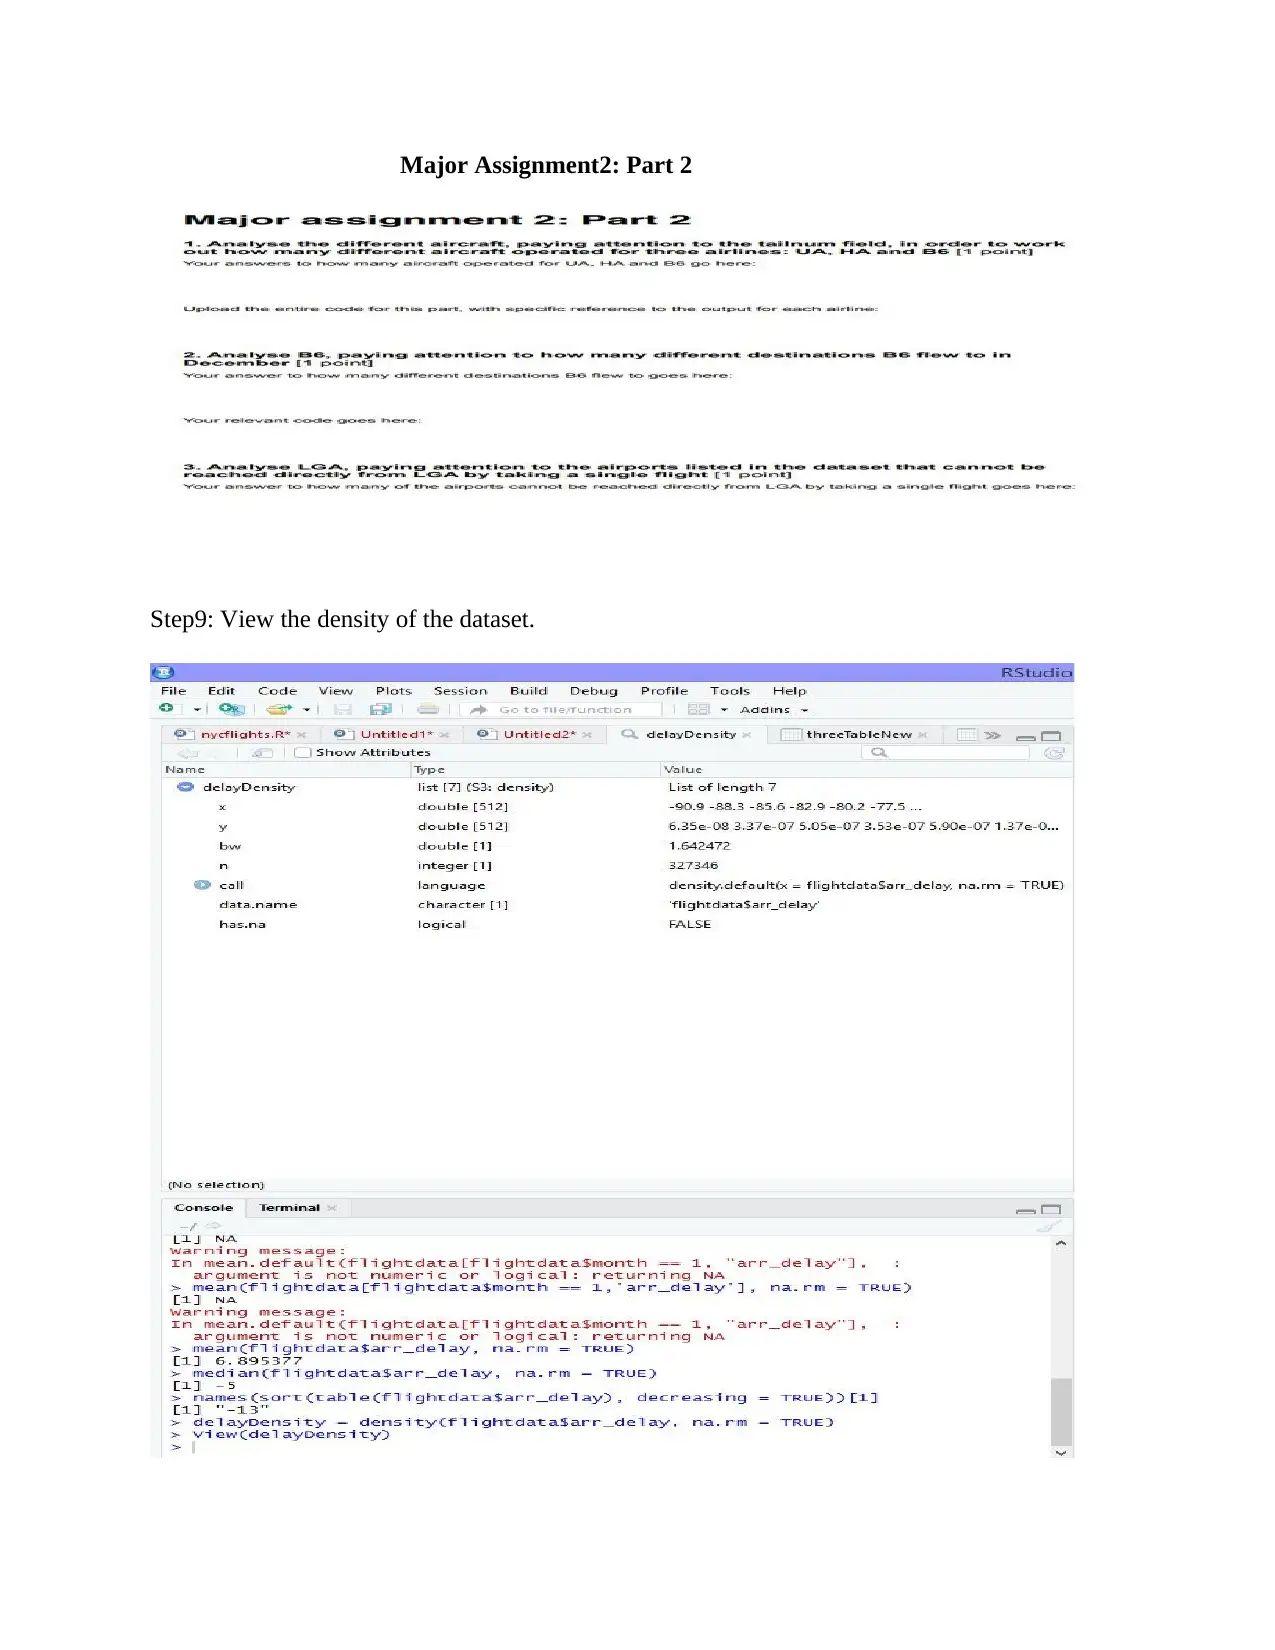
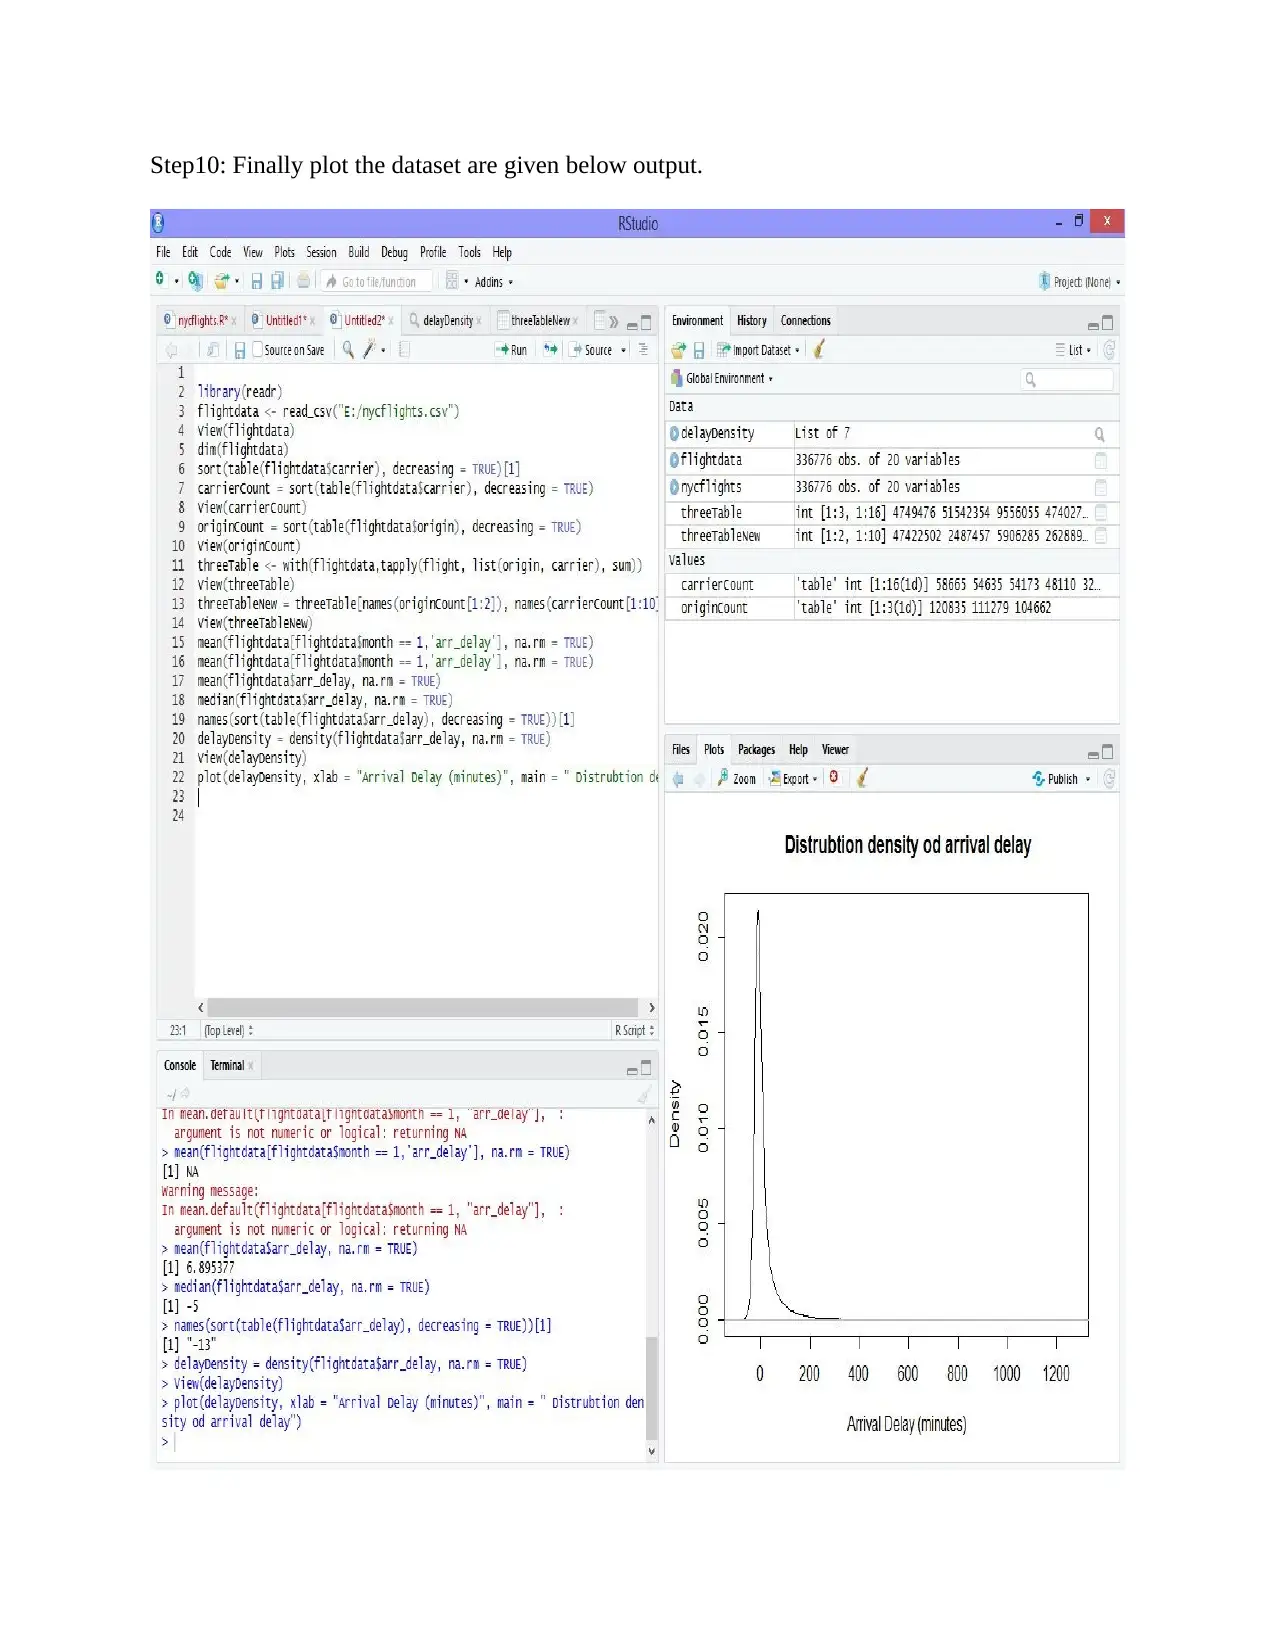
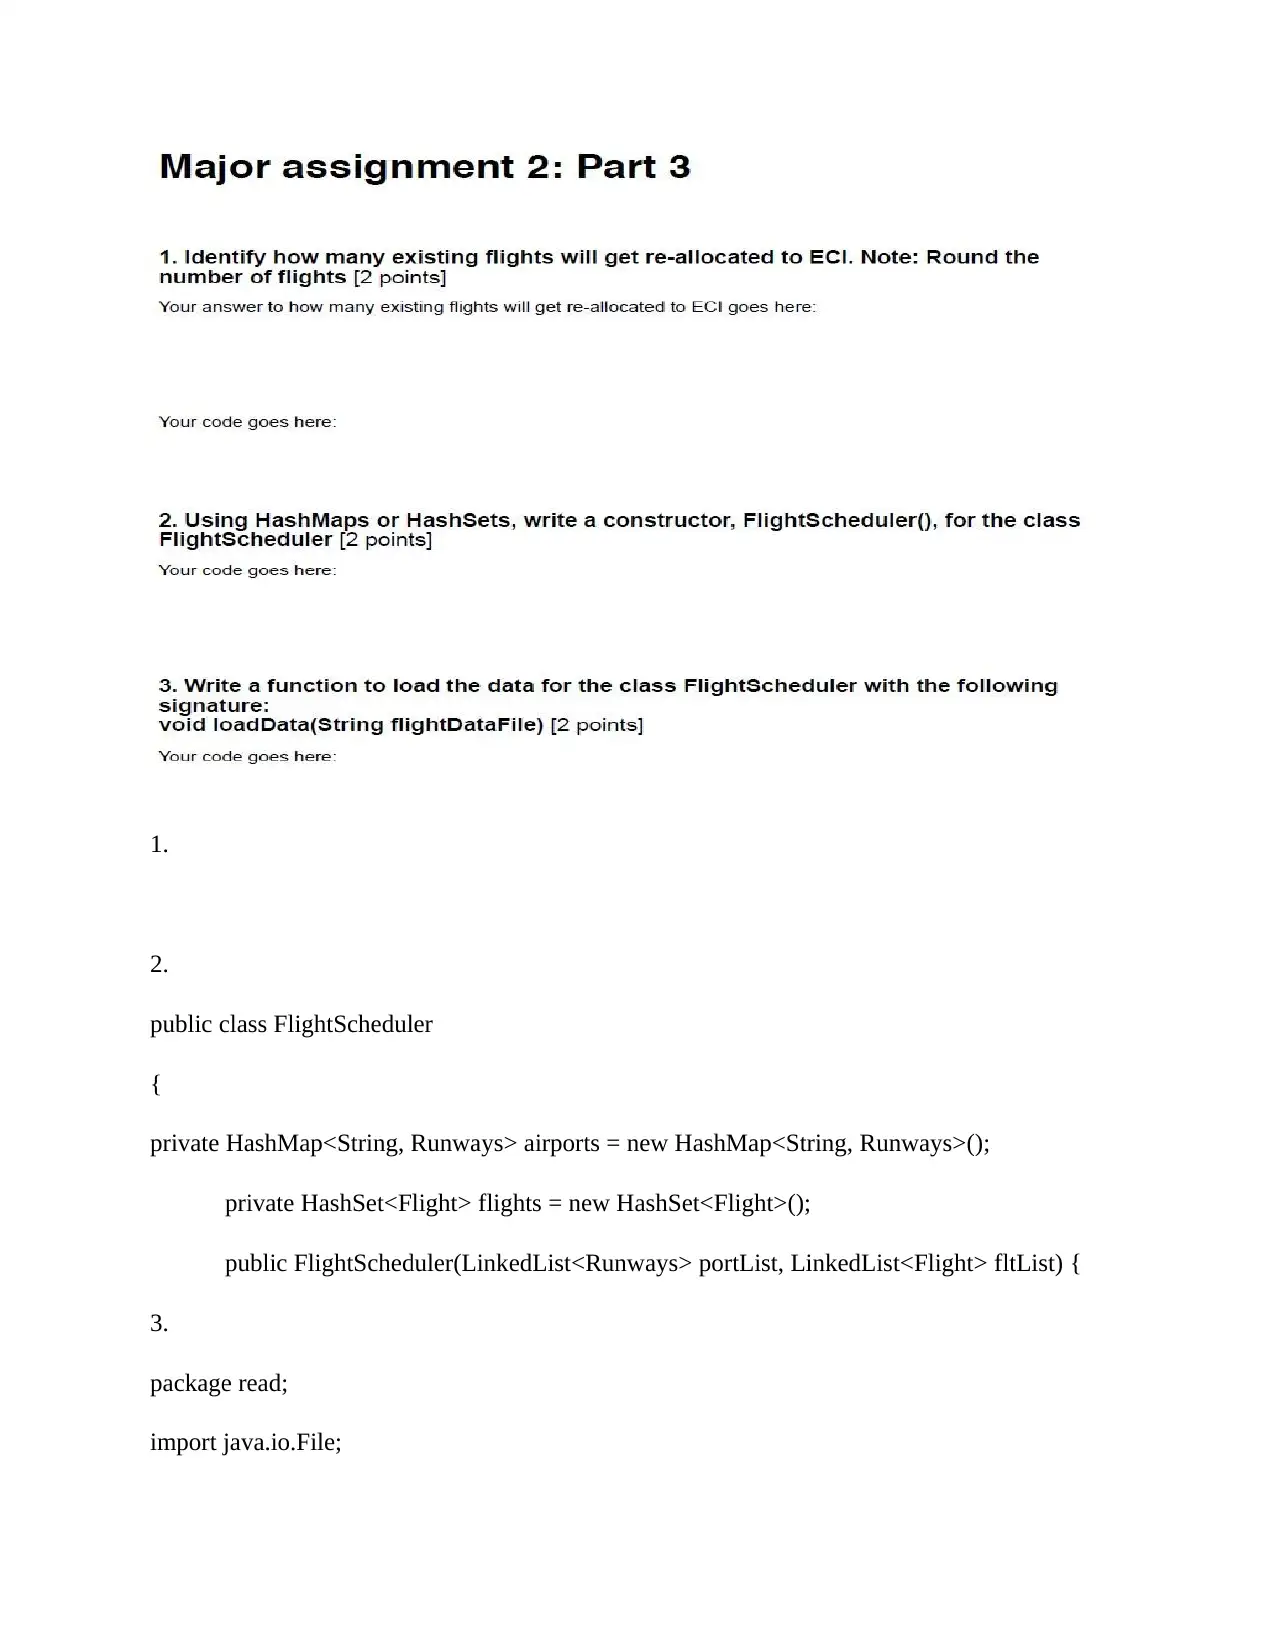
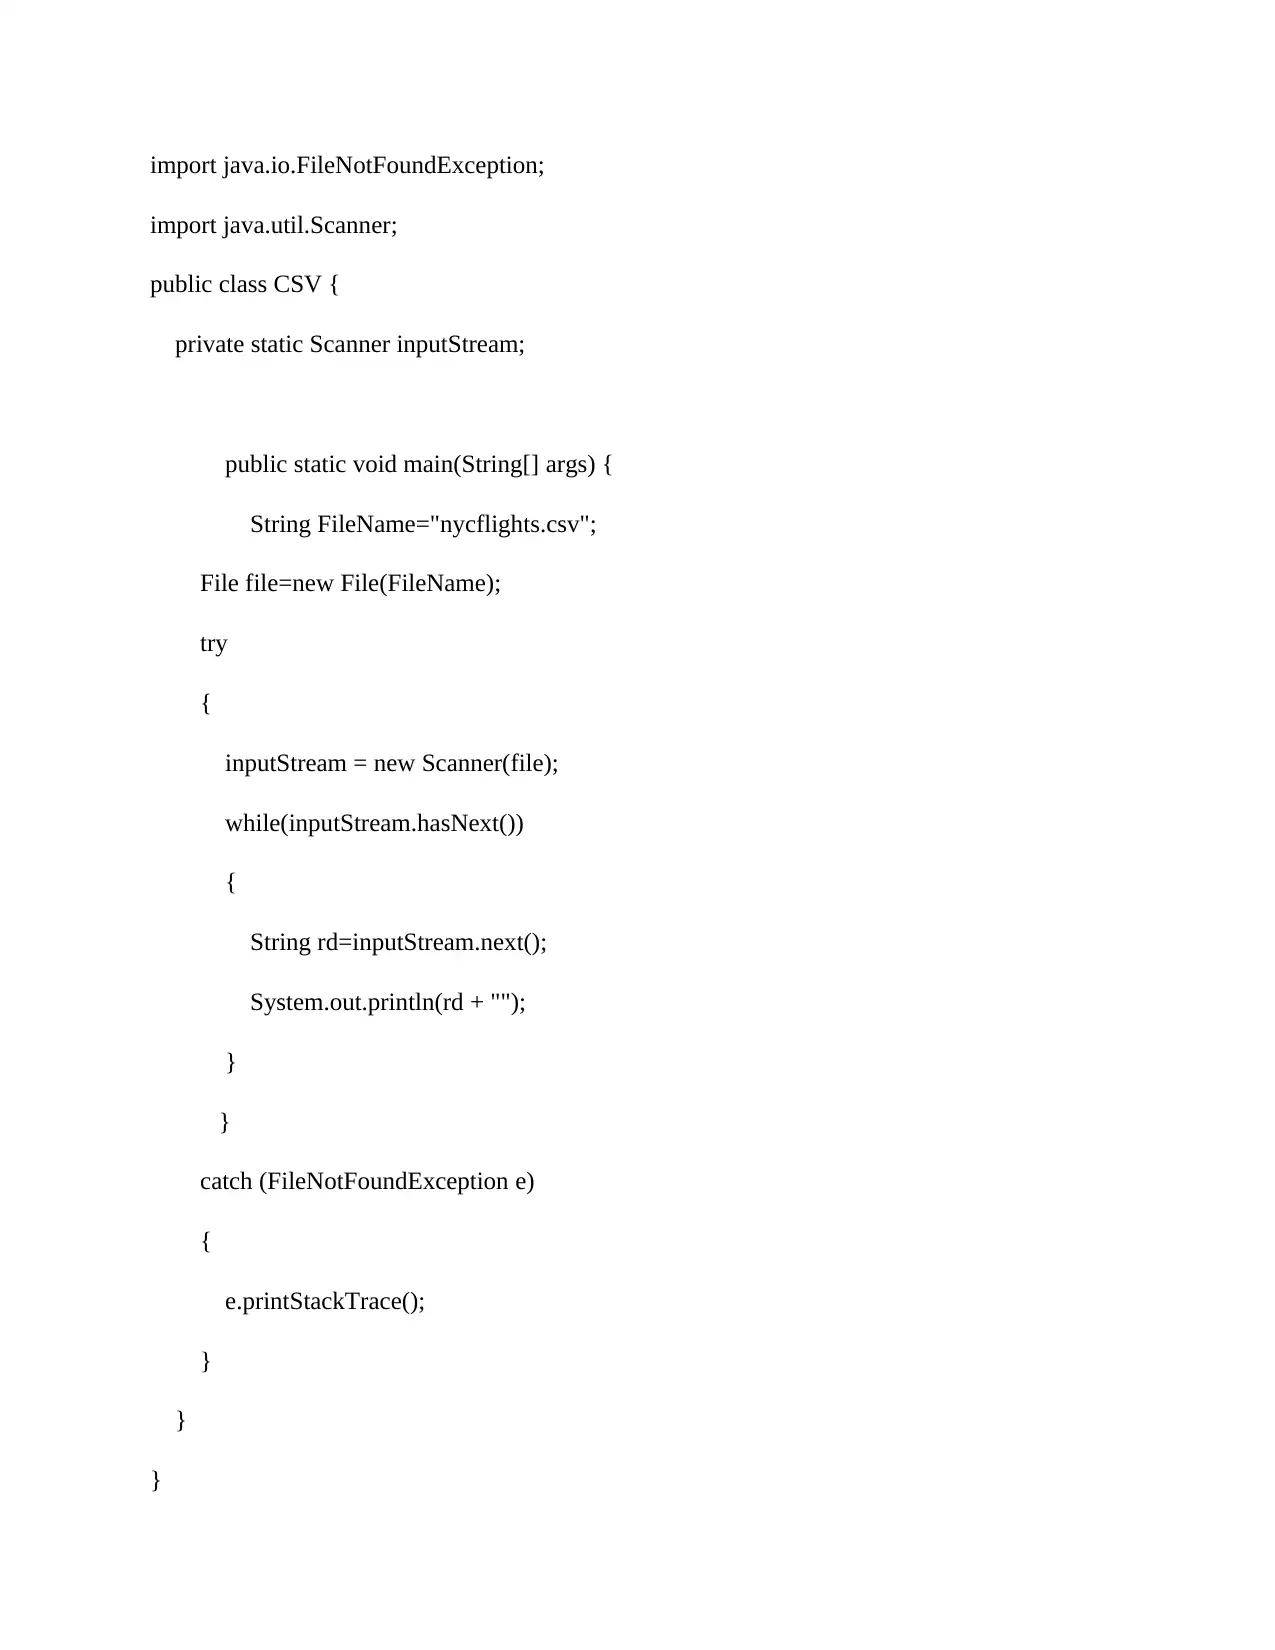
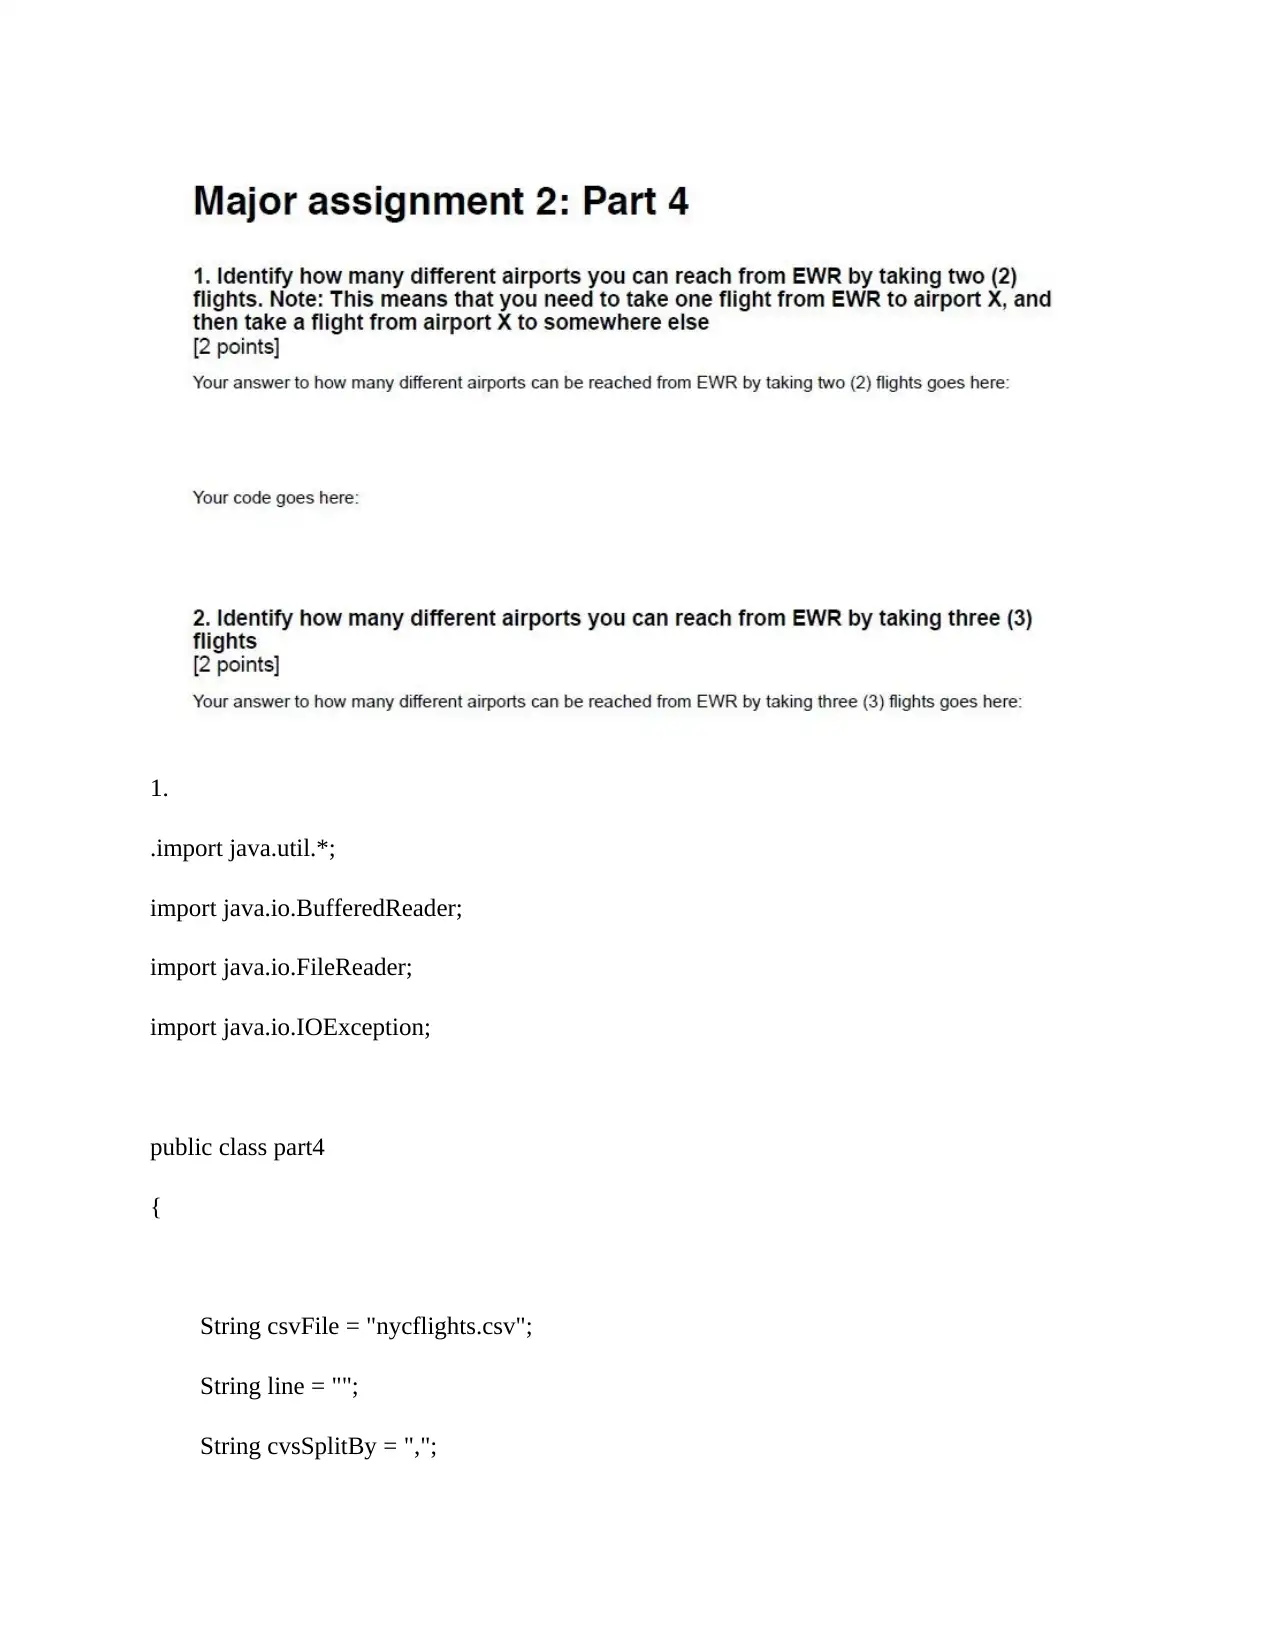
This assignment provides a Java-based solution for analyzing the NYC flights dataset, which is converted into a CSV format for easier processing. The code includes steps for importing the CSV file, determining the dataset's dimensions, sorting the data into tables, counting columns, and counting flights originating from EWR, JFK, and LGA. It also demonstrates how to view portions of the dataset, calculate mean, median, maximum, and minimum values. The solution includes Java code snippets for reading the CSV file, creating a flight scheduler, and reallocating flights based on certain criteria. The assignment makes use of data structures like HashMaps and HashSets to manage airports and flights. The provided code also includes screenshots that show the implementation of the java codes. Desklib offers this solution along with other solved assignments and past papers to aid students in their studies.
Document Page
Major Assignment2: Part 1
Step1: Import the csv file in R.
tabler-icon-diamond-filled.svg

Paraphrase This Document

Need a fresh take? Get an instant paraphrase of this document with our AI Paraphraser
Document Page
Step2: Dimension of the dataset.
Document Page
Step3: Sort the dataset into the table:
Step4: Count the column of the flight dataset:
Document Page
Step5: origin is the column of the dataset and count the origin.
Step6: View the three Table of the flight dataset.
Step7: Find out the New Table and display the dataset and Column of the dataset.
tabler-icon-diamond-filled.svg

Paraphrase This Document

Need a fresh take? Get an instant paraphrase of this document with our AI Paraphraser
Document Page
Step8: Find out the mean and median of the dataset and maximum and minimum.
Document Page
Document Page
tabler-icon-diamond-filled.svg

Paraphrase This Document

Need a fresh take? Get an instant paraphrase of this document with our AI Paraphraser
Document Page
Major Assignment2: Part 2
Step9: View the density of the dataset.
Document Page
Step10: Finally plot the dataset are given below output.
Document Page
1.
2.
public class FlightScheduler
{
private HashMap<String, Runways> airports = new HashMap<String, Runways>();
private HashSet<Flight> flights = new HashSet<Flight>();
public FlightScheduler(LinkedList<Runways> portList, LinkedList<Flight> fltList) {
3.
package read;
import java.io.File;
tabler-icon-diamond-filled.svg

Paraphrase This Document

Need a fresh take? Get an instant paraphrase of this document with our AI Paraphraser
Document Page
import java.io.FileNotFoundException;
import java.util.Scanner;
public class CSV {
private static Scanner inputStream;
public static void main(String[] args) {
String FileName="nycflights.csv";
File file=new File(FileName);
try
{
inputStream = new Scanner(file);
while(inputStream.hasNext())
{
String rd=inputStream.next();
System.out.println(rd + "");
}
}
catch (FileNotFoundException e)
{
e.printStackTrace();
}
}
}
Document Page
1.
.import java.util.*;
import java.io.BufferedReader;
import java.io.FileReader;
import java.io.IOException;
public class part4
{
String csvFile = "nycflights.csv";
String line = "";
String cvsSplitBy = ",";
chevron_up_icon
1 out of 26
circle_padding
hide_on_mobile
zoom_out_icon
[object Object]