ACC00724 Assignment 1: JB Hi-Fi Financial Performance and Analysis

Verified

Added on  2023/05/28

|9
|1771
|226
Homework Assignment
AI Summary
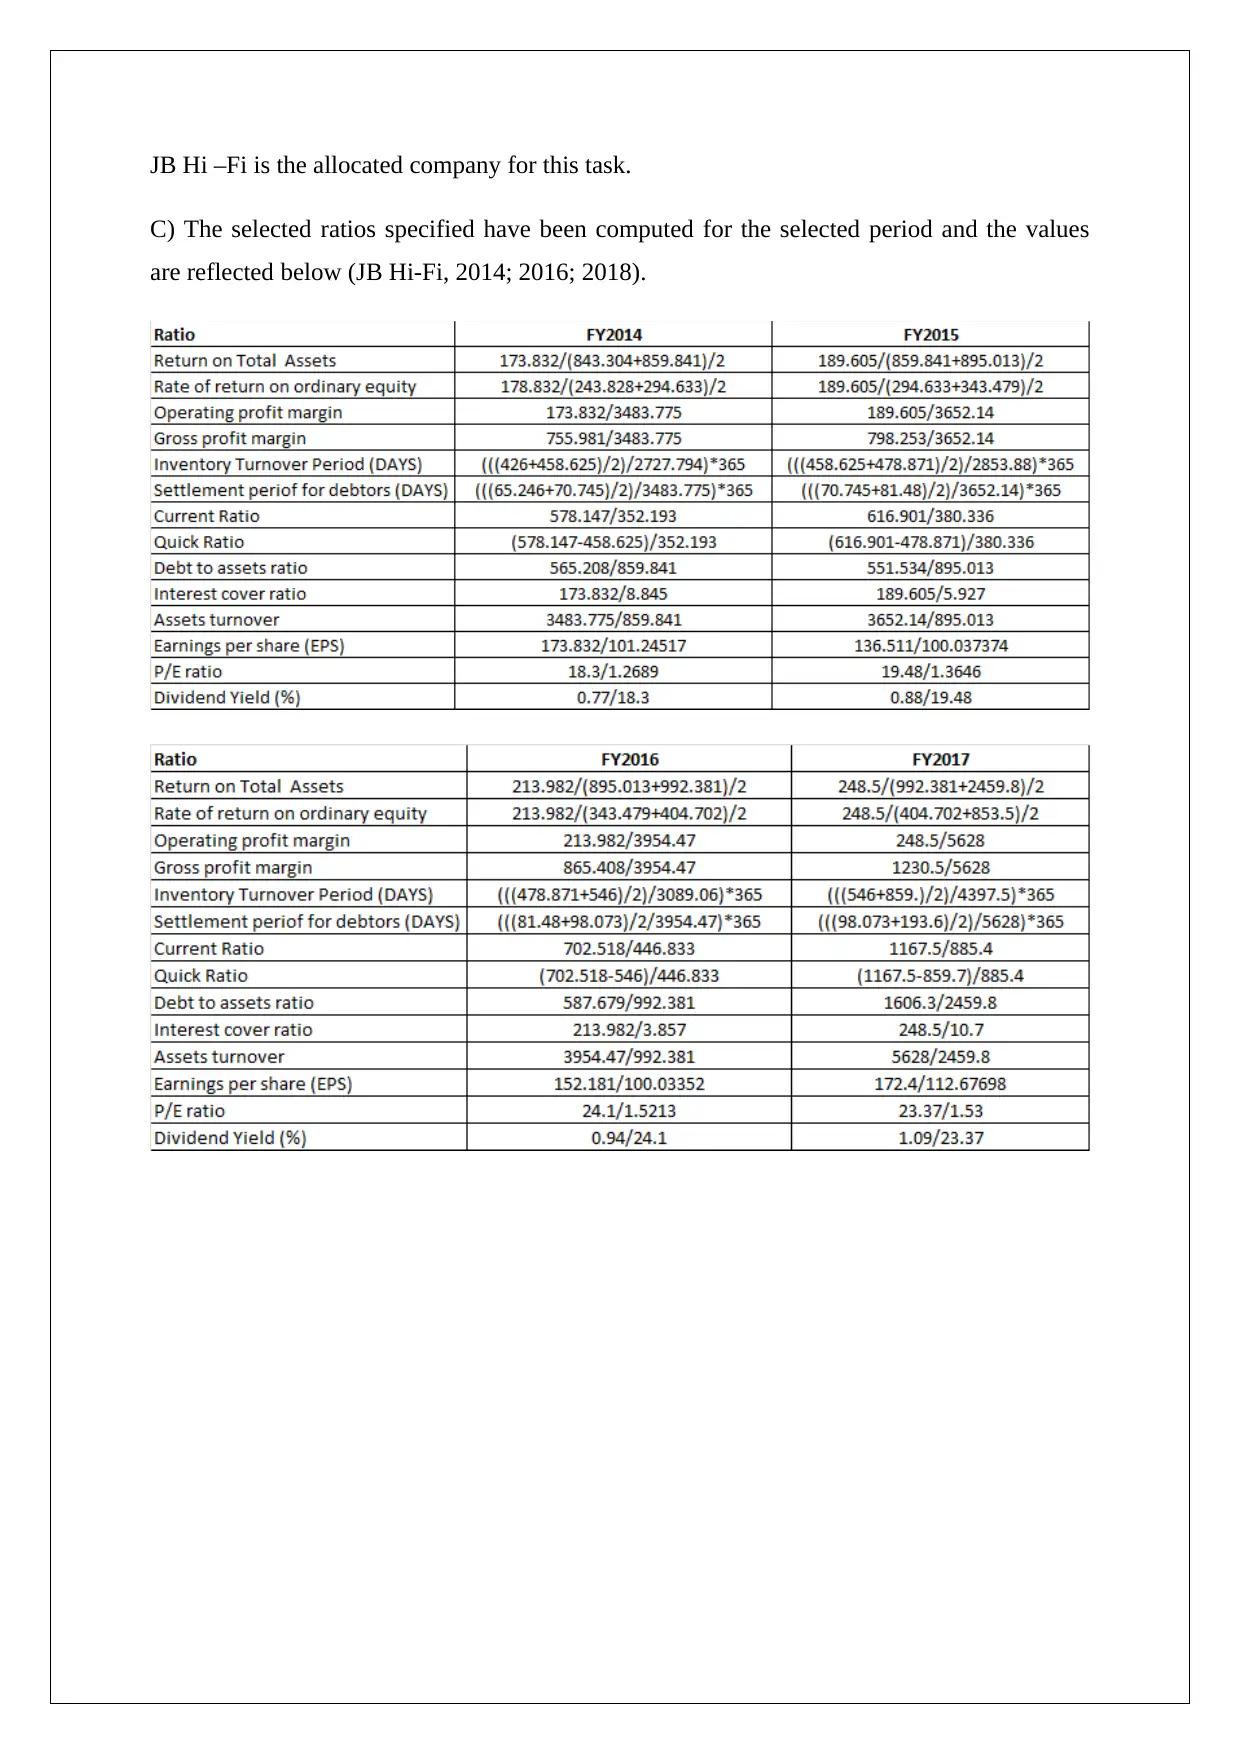
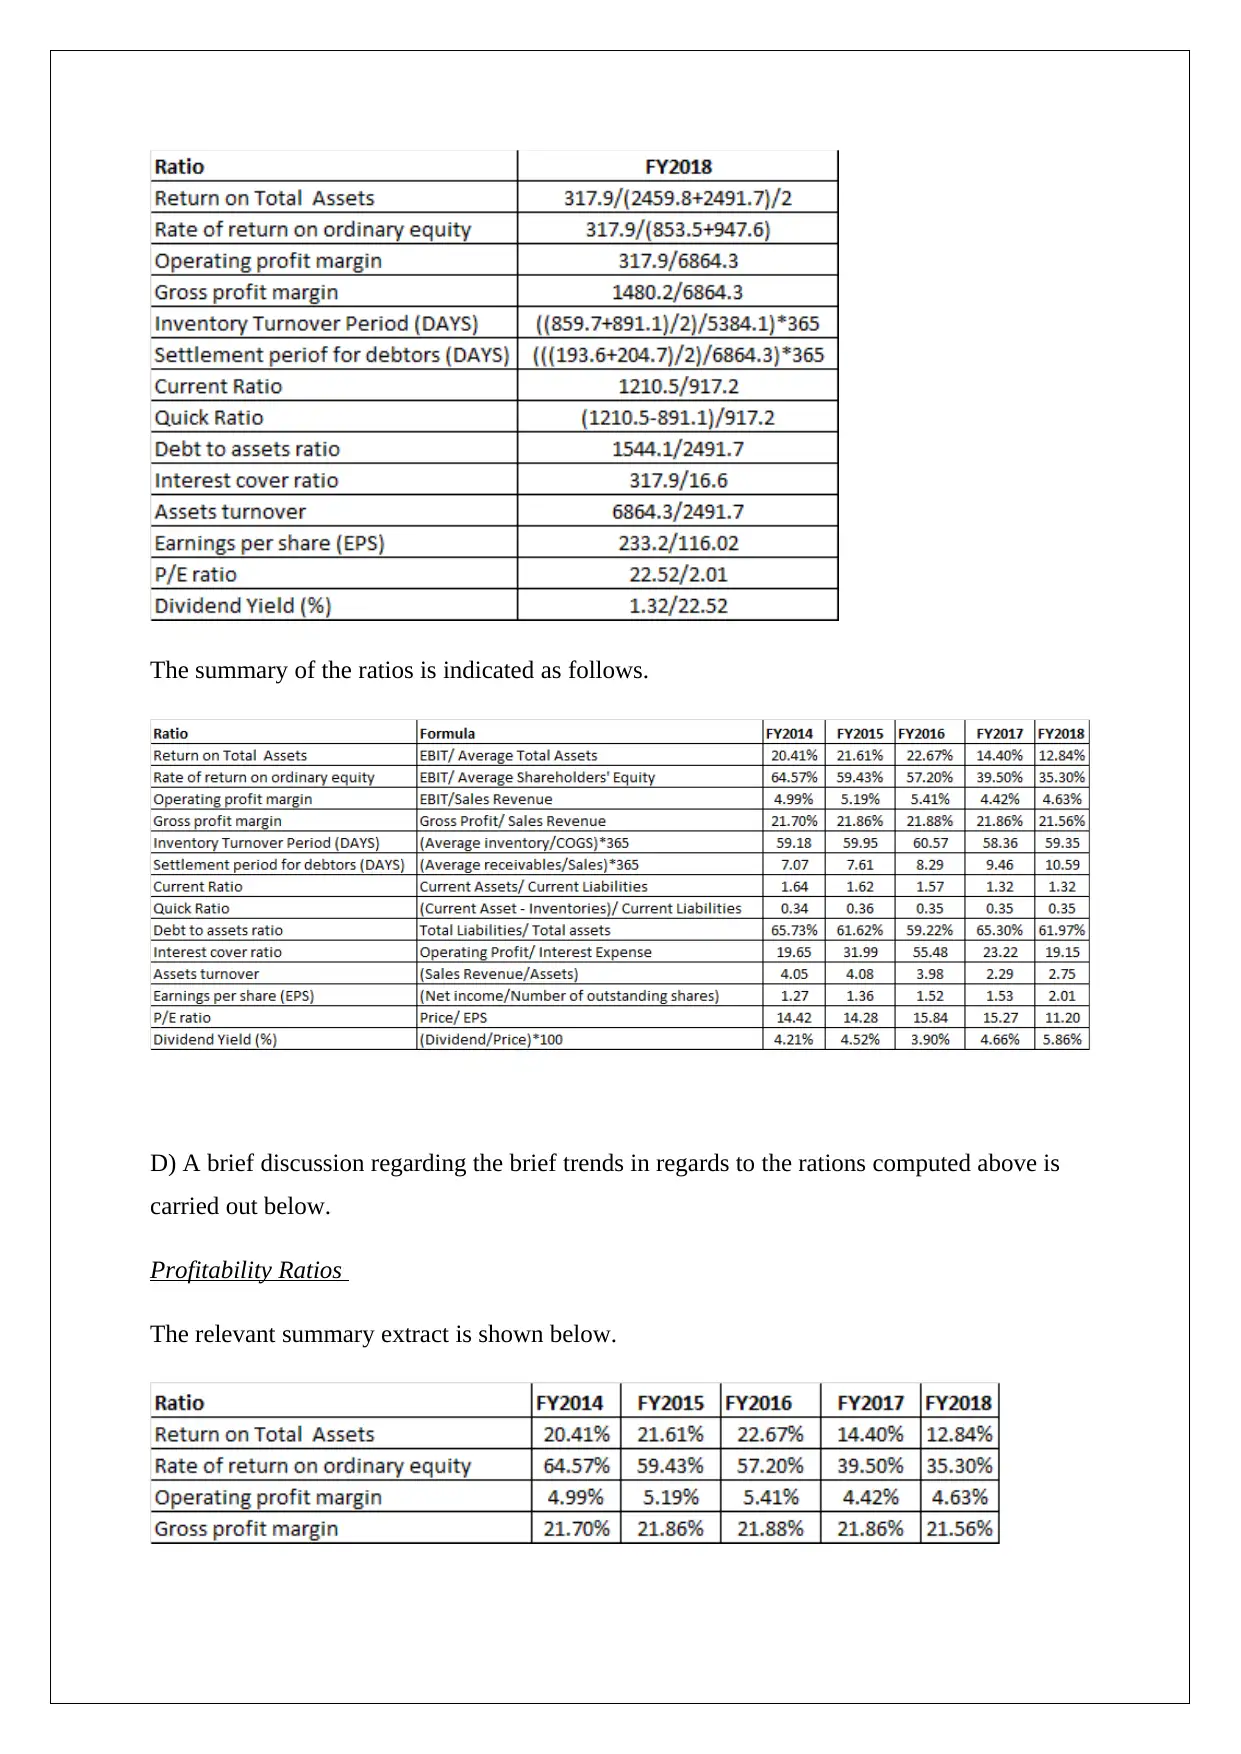
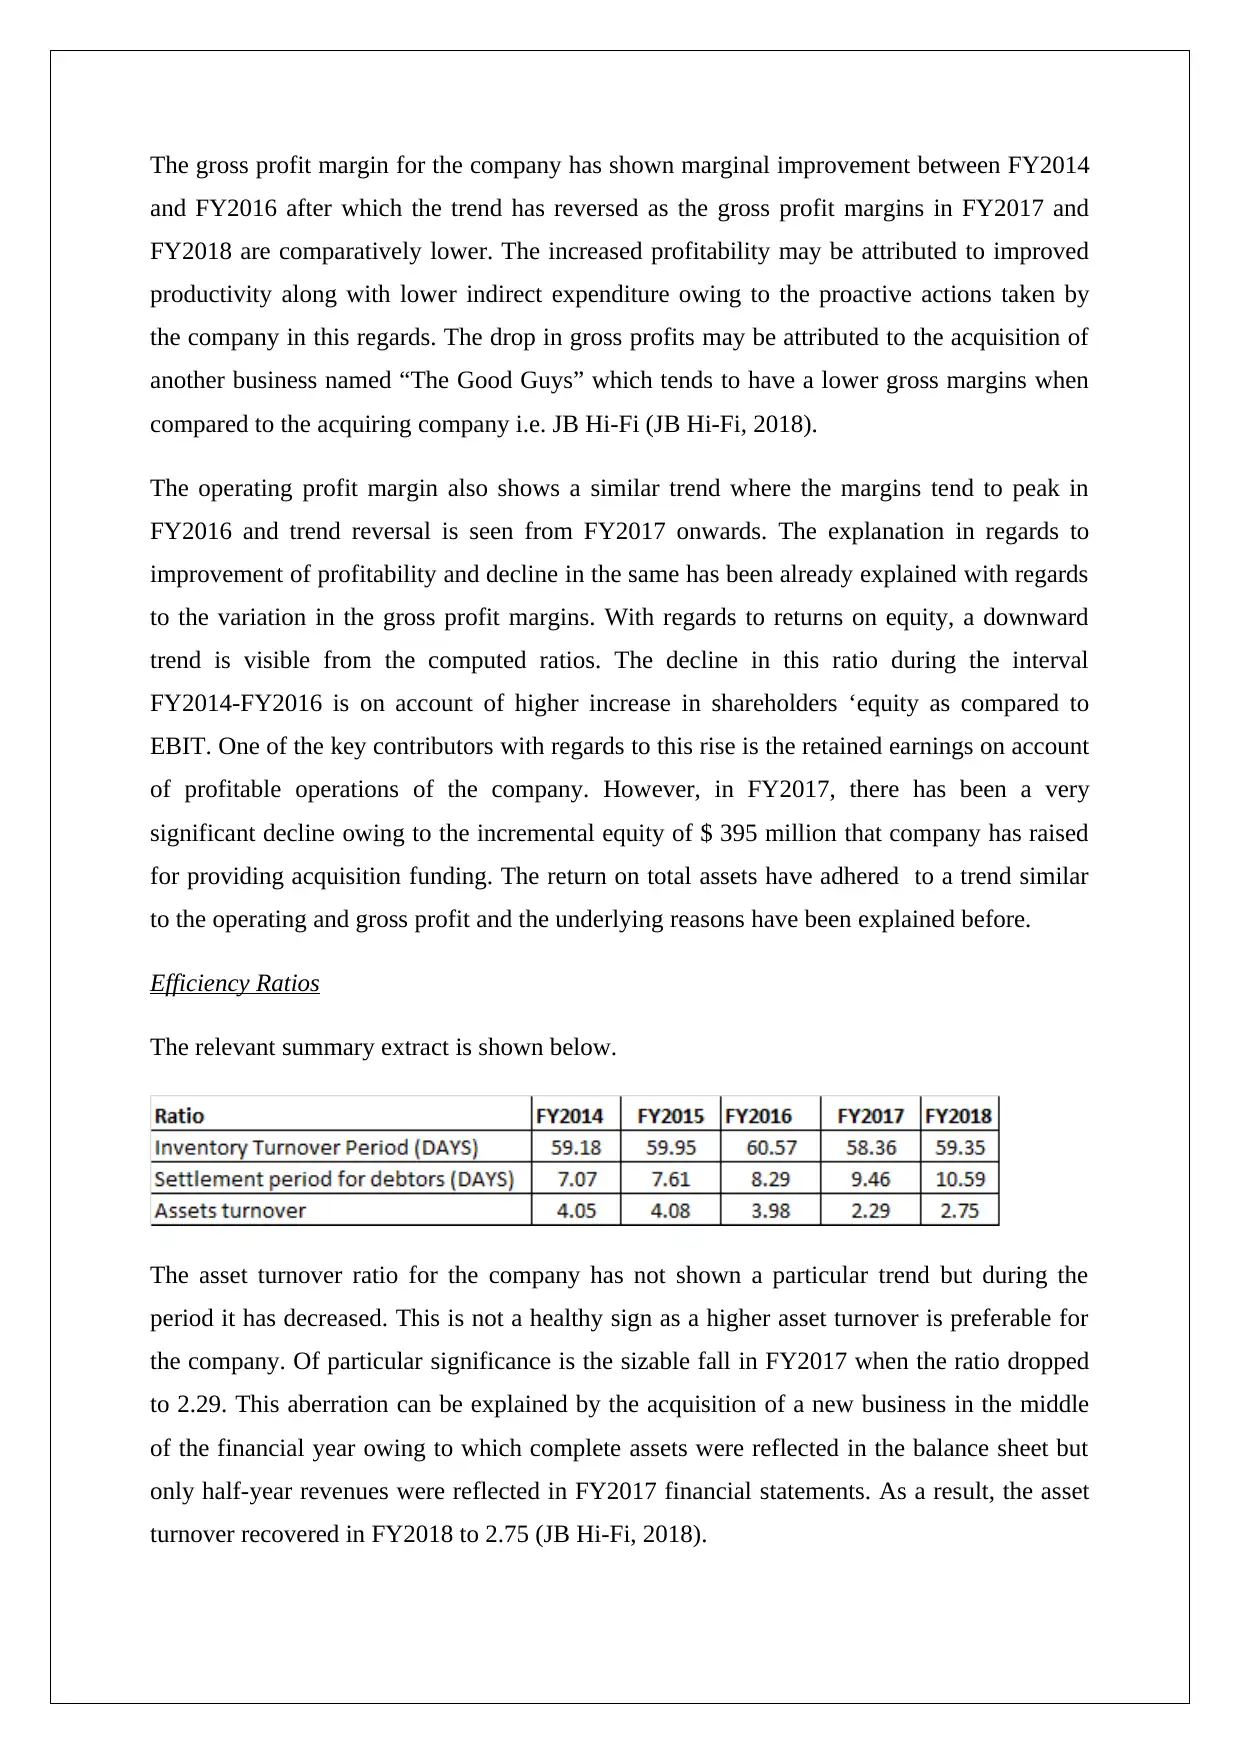
This assignment presents a comprehensive financial analysis of JB Hi-Fi (JBH) from 2014 to 2018, focusing on various financial ratios and cash flow statements. The analysis includes the computation and interpretation of profitability ratios (gross profit margin, operating profit margin, return on equity, and return on total assets), efficiency ratios (asset turnover, debtor settlement period, and inventory turnover), liquidity ratios (quick ratio and current ratio), financial gearing ratios (interest cover and debt to assets), and investment ratios (dividend yield, earnings per share, and P/E ratio). The document discusses the trends observed in these ratios, attributing changes to factors such as acquisitions (The Good Guys), changes in equity, and debt levels. Furthermore, the assignment includes a comparative analysis of the cash flow statements for 2017 and 2018, highlighting the shifts in cash flows from operating, investing, and financing activities, and explaining the underlying causes for these changes, such as customer receipts, payments, and acquisition-related transactions. The analysis is supported by references to JB Hi-Fi's annual reports and financial literature.
tabler-icon-diamond-filled.svg

Contribute Materials

Your contribution can guide someone’s learning journey. Share your documents today.
Document Page
ACCOUNTING FOR MANAGERS
JB Hi-Fi
STUDENT ID:
[Pick the date]
tabler-icon-diamond-filled.svg

Secure Best Marks with AI Grader

Need help grading? Try our AI Grader for instant feedback on your assignments.
Document Page
JB Hi –Fi is the allocated company for this task.
C) The selected ratios specified have been computed for the selected period and the values
are reflected below (JB Hi-Fi, 2014; 2016; 2018).
Document Page
The summary of the ratios is indicated as follows.
D) A brief discussion regarding the brief trends in regards to the rations computed above is
carried out below.
Profitability Ratios
The relevant summary extract is shown below.
Document Page
The gross profit margin for the company has shown marginal improvement between FY2014
and FY2016 after which the trend has reversed as the gross profit margins in FY2017 and
FY2018 are comparatively lower. The increased profitability may be attributed to improved
productivity along with lower indirect expenditure owing to the proactive actions taken by
the company in this regards. The drop in gross profits may be attributed to the acquisition of
another business named “The Good Guys” which tends to have a lower gross margins when
compared to the acquiring company i.e. JB Hi-Fi (JB Hi-Fi, 2018).
The operating profit margin also shows a similar trend where the margins tend to peak in
FY2016 and trend reversal is seen from FY2017 onwards. The explanation in regards to
improvement of profitability and decline in the same has been already explained with regards
to the variation in the gross profit margins. With regards to returns on equity, a downward
trend is visible from the computed ratios. The decline in this ratio during the interval
FY2014-FY2016 is on account of higher increase in shareholders ‘equity as compared to
EBIT. One of the key contributors with regards to this rise is the retained earnings on account
of profitable operations of the company. However, in FY2017, there has been a very
significant decline owing to the incremental equity of $ 395 million that company has raised
for providing acquisition funding. The return on total assets have adhered to a trend similar
to the operating and gross profit and the underlying reasons have been explained before.
Efficiency Ratios
The relevant summary extract is shown below.
The asset turnover ratio for the company has not shown a particular trend but during the
period it has decreased. This is not a healthy sign as a higher asset turnover is preferable for
the company. Of particular significance is the sizable fall in FY2017 when the ratio dropped
to 2.29. This aberration can be explained by the acquisition of a new business in the middle
of the financial year owing to which complete assets were reflected in the balance sheet but
only half-year revenues were reflected in FY2017 financial statements. As a result, the asset
turnover recovered in FY2018 to 2.75 (JB Hi-Fi, 2018).
tabler-icon-diamond-filled.svg

Secure Best Marks with AI Grader

Need help grading? Try our AI Grader for instant feedback on your assignments.
Document Page
The settlement period for debtors has adhered to an increasing trend during the given period
which is not positive for the company. This is because a higher value implies longer delay in
receipt of the cash from credit sales which would result in higher demand for working capital
yielding higher finance costs (Damodaran, 2015). The inventory turnover period for the
company has been rangebound and hence has not shown any significant improvement or
deterioration to merit any detailed discussion.
Liquidity Ratios
The relevant summary extract is shown below.
The quick ratio for the company has not shown any sizable movement during the given
period and hovered in the narrow range of 0.34-0.36. As a result, it can be concluded that the
quick ratio has not improved or deteriorated in the given time period. While the current ratio
may appear on the lower side, but this is not the case considering the nature of business
where inventory is a significant portion of the current assets (Brealey, Myers and Allen,
2012).
The current ratio of the company has deteriorated during the given period. A significant fall
in the current ratio is witnessed in FY2017 which may be linked to the acquisition as the
acquired business may have a very lower current ratio, thus adversely impacting the overall
current ratio of the company. However, a positive aspect is that there is no deterioration in
this regards in FY2018. Going forward, the company needs to be mindful of any fall in this
regards as it would impair the ability of the company to meet the short term obligations (JB
Hi-Fi, 2018).
Financial Gearing Ratios
The relevant summary extract is shown below.
Document Page
There is significant amount of fluctuation with regards to interest cover ratio which peaked
out in FY2016 and is on a downtrend since. The improvement witnessed in interest cover was
owing to lowering finance costs coupled with increasing operating profits. However, in
FY2017, the company had to increase the borrowings significantly so as to fund the
acquisition which led to rising interest cost and subsequent decline in the interest cover.
However, a positive aspect from the perspective of the company is that despite the decline, it
still remains quite healthy and does not pose any concern or worry for the lenders (JB Hi-Fi,
2018).
The debt to assets ratio has shown a positive trend from the beginning of the period till
FY2016. However, there is reversal of trend from FY2017 onwards which is attributed to the
acquisition and the related incremental debt that the company had to assume on the balance
sheet. However, the commitment of the company to reduce financial risk by balance sheet
deleveraging is apparent from FY2018 when there is an improvement in this ratio (JB Hi-Fi,
2018). While at present no issue is posed but the company needs to be careful in the future
not to assume any major debt on the balance sheet.
Investment Ratios
The relevant summary extract is shown below
From an investment perspective, a key positive about the company is visible in the form of a
healthy and stable dividend yield. The earnings of the company has shown a positive trend
during the period under consideration as the EPS has grown at a CAGR of 9.6% which is
quite impressive. However, a key aspect that needs to be mentioned is that a significant
amount of this jump in EPS has been achieved on the wake of the acquisition of the “The
Good Guys”. But simultaneously, the higher equity base in FY2017 must also be considered.
The P/E ratio is reflective of the limited organic growth by the business since there does not
seem to be any re-rating of the stock (Petty et. al., 2015).
Document Page
D) For facilitating the cash flow statement comparison between FY2017 and FY2018, the
cash flows from three key type of activities have been considered separately (JB Hi-Fi, 2018).
Cash flows from operating activities
There has been a rise in the customer receipts of the company on account of operating
activities in FY2018. However, this has been accompanied by a proportionate increase in
payment to employees and suppliers. There has been an increase in the interest payment in
FY2018 owing to the higher debt assumed from acquisition. The tax outflow in FY2018 is
also greater owing to higher profits before tax being generated by company. However,
despite the above factors the operating activities generated higher cash flow in FY2018 in
comparison to FY2017 which is primarily attributed to higher customer receipts (JB Hi-Fi,
2018).
Cash Flows from Investing Activities
The noticeable account in the above extract is the payment made for business acquisition in
FY2017 which corresponds to buying of “The Good Guys” for a consideration of $ 836.6
million (Mitchell, 2016). Additionally, cash outflow has also been incurred for the purchase
of plant and equipment and in this regards, cash outflow in FY2018 has exceeded the
corresponding figure in FY2017 by $ 5.3 million. Negligible cash inflows have been realised
from sale of plant and equipment in both the years (JB Hi-Fi, 2018).
Cash Flows from Financing Activities
tabler-icon-diamond-filled.svg

Paraphrase This Document

Need a fresh take? Get an instant paraphrase of this document with our AI Paraphraser
Document Page
The company issued equity in FY2017 for raising $ 395.9 million which was meant for the
acquisition of the business. Also, debt funding to the extent of $ 450 million was taken for
providing the funding assistance in the acquisition. However, in FY2018, there has been a
repayment in the outstanding debt owing to which it would reduce from FY2017 levels.
Driven by higher EPS, the per share dividend declared in FY2018 has been higher and also
there has been an increase in outstanding shares which is responsible for the higher cash
outflows related to dividends in FY2018 when compared with FY2017 (JB Hi-Fi, 2018).
Document Page
References
Brealey, R. A., Myers, S. C. and Allen, F. (2011) Principles of corporate finance, 10th ed.
New York: McGraw-Hill Publications
Damodaran, A. (2015). Applied corporate finance: A user’s manual 4th ed. New York:
Wiley, John & Sons.
Link: http://people.stern.nyu.edu/adamodar/pdfiles/acf4E/acf4Ebook.pdf
JB Hi-Fi (2014) Annual Report FY2014, [Online] Available at
http://www.annualreports.com/HostedData/AnnualReportArchive/J/ASX_JBH_2014.pdf
[Assessed December 2, 2018]
JB Hi-Fi (2016) Annual Report FY2016, [Online] Available at
http://www.annualreports.com/HostedData/AnnualReportArchive/J/ASX_JBH_2016.pdf
[Assessed December 2, 2018]
JB Hi-Fi (2018) Annual Report FY2018, [Online] Available at
https://investors.jbhifi.com.au/wp-content/uploads/2018/10/Annual-Report-2018-with-
Chairmans-CEOs-Report.pdf [Assessed December 2, 2018]
Mitchell, S. (2016) JB Hi-Fi agrees to buy The Good Guys for $870m, [Online] Available at
https://www.afr.com/business/retail/appliances/jb-hifi-agrees-to-buy-the-good-guys-for-
870m-20160912-grev25 [Assessed December 2, 2018]
Petty, J.W., Titman, S., Keown, A., Martin, J.D., Martin, P., Burrow, M. and Nguyen, H. (2015).
Financial Management, Principles and Applications, 6th ed.. NSW: Pearson Education, French
Forest Australia
chevron_up_icon
1 out of 9
circle_padding
hide_on_mobile
zoom_out_icon
logo.png

Your All-in-One AI-Powered Toolkit for Academic Success.

Available 24*7 on WhatsApp / Email

[object Object]