Financial Analysis Report: JB Hi Fi Ltd vs. Harvey Norman
VerifiedAdded on 2019/12/28
|21
|4839
|427
Report
AI Summary
This report presents a financial analysis of JB Hi Fi Ltd (JBH) from 2012 to 2016, comparing its performance with Harvey Norman Holdings (HVN). The analysis employs ratio analysis (activity, profitability, liquidity, and solvency), Du Pont analysis, and cash flow analysis to assess JBH's financial health and investment viability. The report examines the Australian retail industry's economic framework, focusing on trends and competitive pressures. Key findings include an examination of working capital turnover, receivable turnover, inventory turnover, and asset turnover ratios, alongside profitability metrics like gross profit, net profit, and operating profit ratios. The study also investigates liquidity through current and quick ratios and evaluates long-term debt and solvency using the debt-to-equity ratio. The report concludes with recommendations based on the financial performance and future projections, providing insights into JBH's strategic financial position within the competitive retail landscape.
FINANCIAL ANALYSIS
Paraphrase This Document
Need a fresh take? Get an instant paraphrase of this document with our AI Paraphraser
Table of Contents
1. INTRODUCTION...................................................................................................................................................................................5
1.1 Purpose...............................................................................................................................................................................................5
1.2 Scope..................................................................................................................................................................................................5
1.3 Methodology......................................................................................................................................................................................5
1.4 Assumptions.......................................................................................................................................................................................5
1.5 Limitations.........................................................................................................................................................................................6
2. COMPANY OVERVIEW.......................................................................................................................................................................6
3. ECONOMIC FRAMEWORK.................................................................................................................................................................6
4. FINANCIAL ANALYSIS.......................................................................................................................................................................7
4.1 Ratio analysis.....................................................................................................................................................................................7
4.1.1 Activity analysis..............................................................................................................................................................................7
4.1.1.1 Short-term activity ratios.............................................................................................................................................................7
4.1.1.2 Long-term activity ratios..............................................................................................................................................................8
4.1.2 Profitability analysis.......................................................................................................................................................................8
4.1.3 Liquidity analysis............................................................................................................................................................................9
4.1.4 Long-term debt and solvency........................................................................................................................................................10
4.1.5 Du Pont analysis............................................................................................................................................................................10
5. CASH FLOW ANALYSIS....................................................................................................................................................................11
6. PROSPECTIVE ANALYSIS................................................................................................................................................................11
6.1 Sales and EBIT forecasts.................................................................................................................................................................11
7. CONCLUSION AND RECOMMENDATIONS..................................................................................................................................12
REFERENCES..........................................................................................................................................................................................14
APPENDIX................................................................................................................................................................................................16
⊘ This is a preview!⊘
Do you want full access?
Subscribe today to unlock all pages.
Trusted by 1+ million students worldwide
List of tables
Table 1 Common Size profit and loss account of JBH..............................................................................................................................16
Table 2 Common size balance sheet of JB HI Fi Ltd................................................................................................................................16
Table 3 Ratio analysis of JBH from 2012 to 2016....................................................................................................................................18
Table 4 Ratio analysis of HVN for 2015 and 2016...................................................................................................................................20
Paraphrase This Document
Need a fresh take? Get an instant paraphrase of this document with our AI Paraphraser
1. INTRODUCTION
1.1 Purpose
The main target or thrust of the research is to examine and compare the performance of the JB Hi Fi Ltd over the five
consequetive years from 2012 to 2016. Moreover, comparative analysis also will be made with its close rivalry firm, Harvey Norman
Holdings. With the help of evaluation of financial performance, invest ability of the company will be assessed.
1.2 Scope
The research report covers an in-depth and thorough analysis of the activity ratio, liquidity ratio, solvency ratios, profitability
ratios along with DuPont analysis. Moreover, prospective analysis will be made for the projection of business performance for the
future period. At the same time, ratio analysis of JB HI Fi (JBH) Company will be done in comparison to the main competitor, Harvey
Norman Holdings (HVN).
1.3 Methodology
The report will apply financial tool, ratio analysis for the purpose of Strategic Financial Analysis (SFA) of JBH with the close
competitor HVN. It will presents both the internal as well as external analysis by performing ratio analysis and Du-Pont analysis over
the years and with the rival firm using annual reports, statement of comprehensive income, statement of financial position and
statement of cash flow as well (Beatty and Liao, 2014). Furthermore, the ratios will be used to examine trend over the years so that
prospective analysis can be made for the future period to form convincing opinion on its investment ability. Apart from this, common
size statement will be prepared for the purpose of detailed analysis of the business performance.
1.4 Assumptions
It is assumed that the data which is acquired from the annual reports are true and valid henceforth, ratio computation provided
authentic results for examination of the business performance and its financial position by creditworthiness and solvency evaluation.
1.5 Limitations
Inaccuracy of the information may leads to provided misleading results and tends to take incorrect and enviable decisions.
Besides this, differences in the accounting policies and rules adopted by the JBH and its competitor HVN may also leads to take
inefficient decisions. In-depth evaluation and examination consumes more time and required large resources which is also a drawback
of the study.
2. COMPANY OVERVIEW
JB Hi Fi Ltd is New Zeland and Australian retail who is engaged in the distribution of home consumer goods from its centre
locations and online stores. It has a large goods portfolio comprising CDs, DVDs, Video games, Blu-ray disc, electronic goods &
home appliances and hardware and headquarter is located in Melbourne, Australia. Harvey Norman is the strongest competitor of JB
HI Fi Ltd which is a multinational retailing firm of computers, bedding, communication, furniture and other consumer electronics
goods headquartered in Homebush West, Australia.
3. ECONOMIC FRAMEWORK
Discovering the current economic conditions of Australian retail industry, it is growing at a faster pace. The sector shows a
growth of 3% in the year 2016 although the results shows progressive growth still in comparison to 2015, it is still slower. The reason
behind this is Australians citizens prefer cautious discretionary spending because of less income growth. Online retail shows growth at
steady rate across multiple channels. Digital presence has brought significant change in people preference as now they prefer
⊘ This is a preview!⊘
Do you want full access?
Subscribe today to unlock all pages.
Trusted by 1+ million students worldwide
convenience purchasing through online buying (Australian retail economy, 2016). Retailers have experienced positive growth in their
performance and which is expects to continue favorably in the future. However, market environment shows a intense and tough
competition for which marketers focused on price discounting to strengthen competitiveness and retain their customer base. It
hindered the growth of retail sector at higher rate during 2016.
4. FINANCIAL ANALYSIS
4.1 Ratio analysis
This technique quantitatively express the results of financial performance and the profit and loss perofrmance to examine the
performance of both the companies, JBH and HVN. It is an effective way to determine that how well company is performing in the
current dynamic and competitive retail industry by computing ratios like profitability, activity, liquidity and solvency (Brealey and
et.al., 2012). Besides this, for assessing the investment viability, return on equity will be examined through Du-Pont analysis method
and also forecasting will be done for projection of future.
4.1.1 Activity analysis
This ratios are the tools that enable the entity to determine their efficiency level to convert various assets like inventory and
debtors into cash. The faster the conversion of assets into sales indicates efficient running of the busines or vice-versa.
4.1.1.1 Short-term activity ratios
Working capital turnover ratio measures the efficiecy of utilization of working capital rising ratio is a good indicator of
performance or vice-versa.
In 2012, JBH’s WC turnover ratio was derived to 33.07 times which indicates effective use of the short-term capital available
in the busines, however, thereafter, the ratio tends to be decline and come to 15.42 in 2014 which showcase decline in the WC
Paraphrase This Document
Need a fresh take? Get an instant paraphrase of this document with our AI Paraphraser
utilizing efficiency. In next two years, it shows little bit improvement to 15.44 and 15.46 times, still, it is almost half to that of PY
2012, therefore, it clearly reports that managers have not efficiently and effectively utilized the funds. On a comparative basis, HVN’s
ratio rose from 6.57 to 8.64 times which is good, still comparatively, JBH’s ratio is higher (JB HI Fi’s financial statements, 2016). Not
optimum use of short-term funds so as to generate better sales for revenue maximization is the reason behind decreased WC turnover
ratio which is not good.
4.1.1.2 Long-term activity ratios
Recievable turnover ratios showcase conversion of accounts recievables into sales. JBH’s ratio continuously dropped down
and came from 53.58 to 40.32 which clearly reflects that it requires more time to convert their recievables into the cash so as to gather
prompt reciepts. Here, high availability of credit to the debtors by the sales department and ineffective efficiency of credit collection
department to monitor the outstanding debts along with the time period and due dates may be the reason behind negative results which
is not good (Buchanan, 2014 ). In contrast, looking to competitor’s performance, it goes up from 2.26 to 2.58 times but it is
comparatively very low than JBH indicates poor performance.
Inventory turnover ratios measures efficiency to convert bought inventory items quickly to actual sales. JBH’s ratio gone up
from 5.76 to 6.09 in 2013 and afterwards, shows consistently decline to 5.65 times. It demonstrates that company requires larger time
duration to dispose off its stock in the market.On the other side, competitor, HVN’s ratio gone increased from 3.78 to 3.90 times
which is good, still is lower than JBH present that stock utilization efficiency of JBH is much better.
Assets turnover ratio of JBH rose from 3.81 to 4.04 times and in CY 2016, it dropped down to 3.96 times whilst rival
organization, HVN has ratio of 0.64. It presented that JB Hi Fi’s managers are using their total assets in better way so that they can
maximize their earnings and earn good return on it.
JBH’s Creditors turnover ratio gone improved from 6.76 to 10.22 times which indicates that they are paying promptly to their
suppliers for the material or goods supplied to the establishment (Damodaran, 2016). It directly affects the cash position because of
quick payments to the creditors. In comparison, HVN’s ratio is 1.97 time which indicates that it is paying suppliedrs delayed.
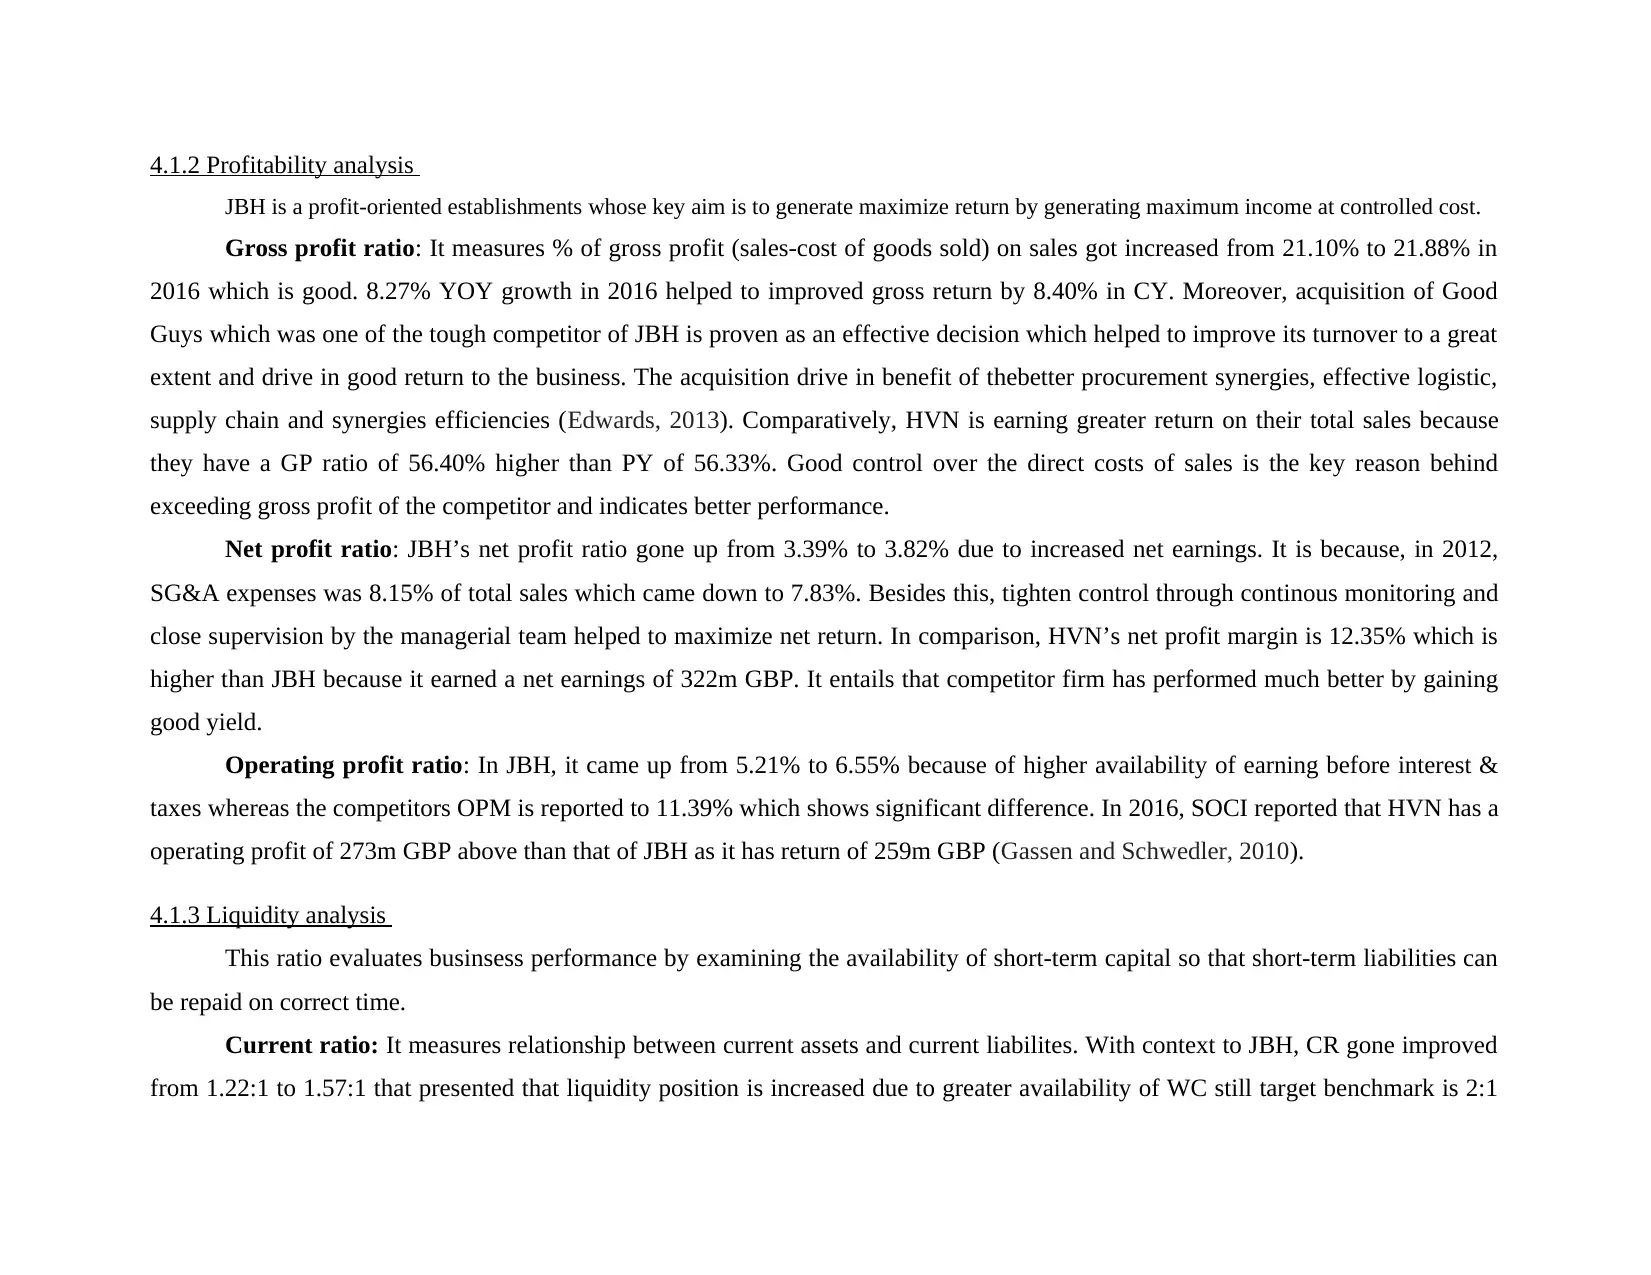
4.1.2 Profitability analysis
JBH is a profit-oriented establishments whose key aim is to generate maximize return by generating maximum income at controlled cost.
Gross profit ratio: It measures % of gross profit (sales-cost of goods sold) on sales got increased from 21.10% to 21.88% in
2016 which is good. 8.27% YOY growth in 2016 helped to improved gross return by 8.40% in CY. Moreover, acquisition of Good
Guys which was one of the tough competitor of JBH is proven as an effective decision which helped to improve its turnover to a great
extent and drive in good return to the business. The acquisition drive in benefit of thebetter procurement synergies, effective logistic,
supply chain and synergies efficiencies (Edwards, 2013). Comparatively, HVN is earning greater return on their total sales because
they have a GP ratio of 56.40% higher than PY of 56.33%. Good control over the direct costs of sales is the key reason behind
exceeding gross profit of the competitor and indicates better performance.
Net profit ratio: JBH’s net profit ratio gone up from 3.39% to 3.82% due to increased net earnings. It is because, in 2012,
SG&A expenses was 8.15% of total sales which came down to 7.83%. Besides this, tighten control through continous monitoring and
close supervision by the managerial team helped to maximize net return. In comparison, HVN’s net profit margin is 12.35% which is
higher than JBH because it earned a net earnings of 322m GBP. It entails that competitor firm has performed much better by gaining
good yield.
Operating profit ratio: In JBH, it came up from 5.21% to 6.55% because of higher availability of earning before interest &
taxes whereas the competitors OPM is reported to 11.39% which shows significant difference. In 2016, SOCI reported that HVN has a
operating profit of 273m GBP above than that of JBH as it has return of 259m GBP (Gassen and Schwedler, 2010).
4.1.3 Liquidity analysis
This ratio evaluates businsess performance by examining the availability of short-term capital so that short-term liabilities can
be repaid on correct time.
Current ratio: It measures relationship between current assets and current liabilites. With context to JBH, CR gone improved
from 1.22:1 to 1.57:1 that presented that liquidity position is increased due to greater availability of WC still target benchmark is 2:1
⊘ This is a preview!⊘
Do you want full access?
Subscribe today to unlock all pages.
Trusted by 1+ million students worldwide
which is still not achieved by the firm. However, HVN has a CR of 1.26:1 below than that of JBH indicates poor creditworthiness
because of unability to repay suppliers and other short-term deferrals on correct time.
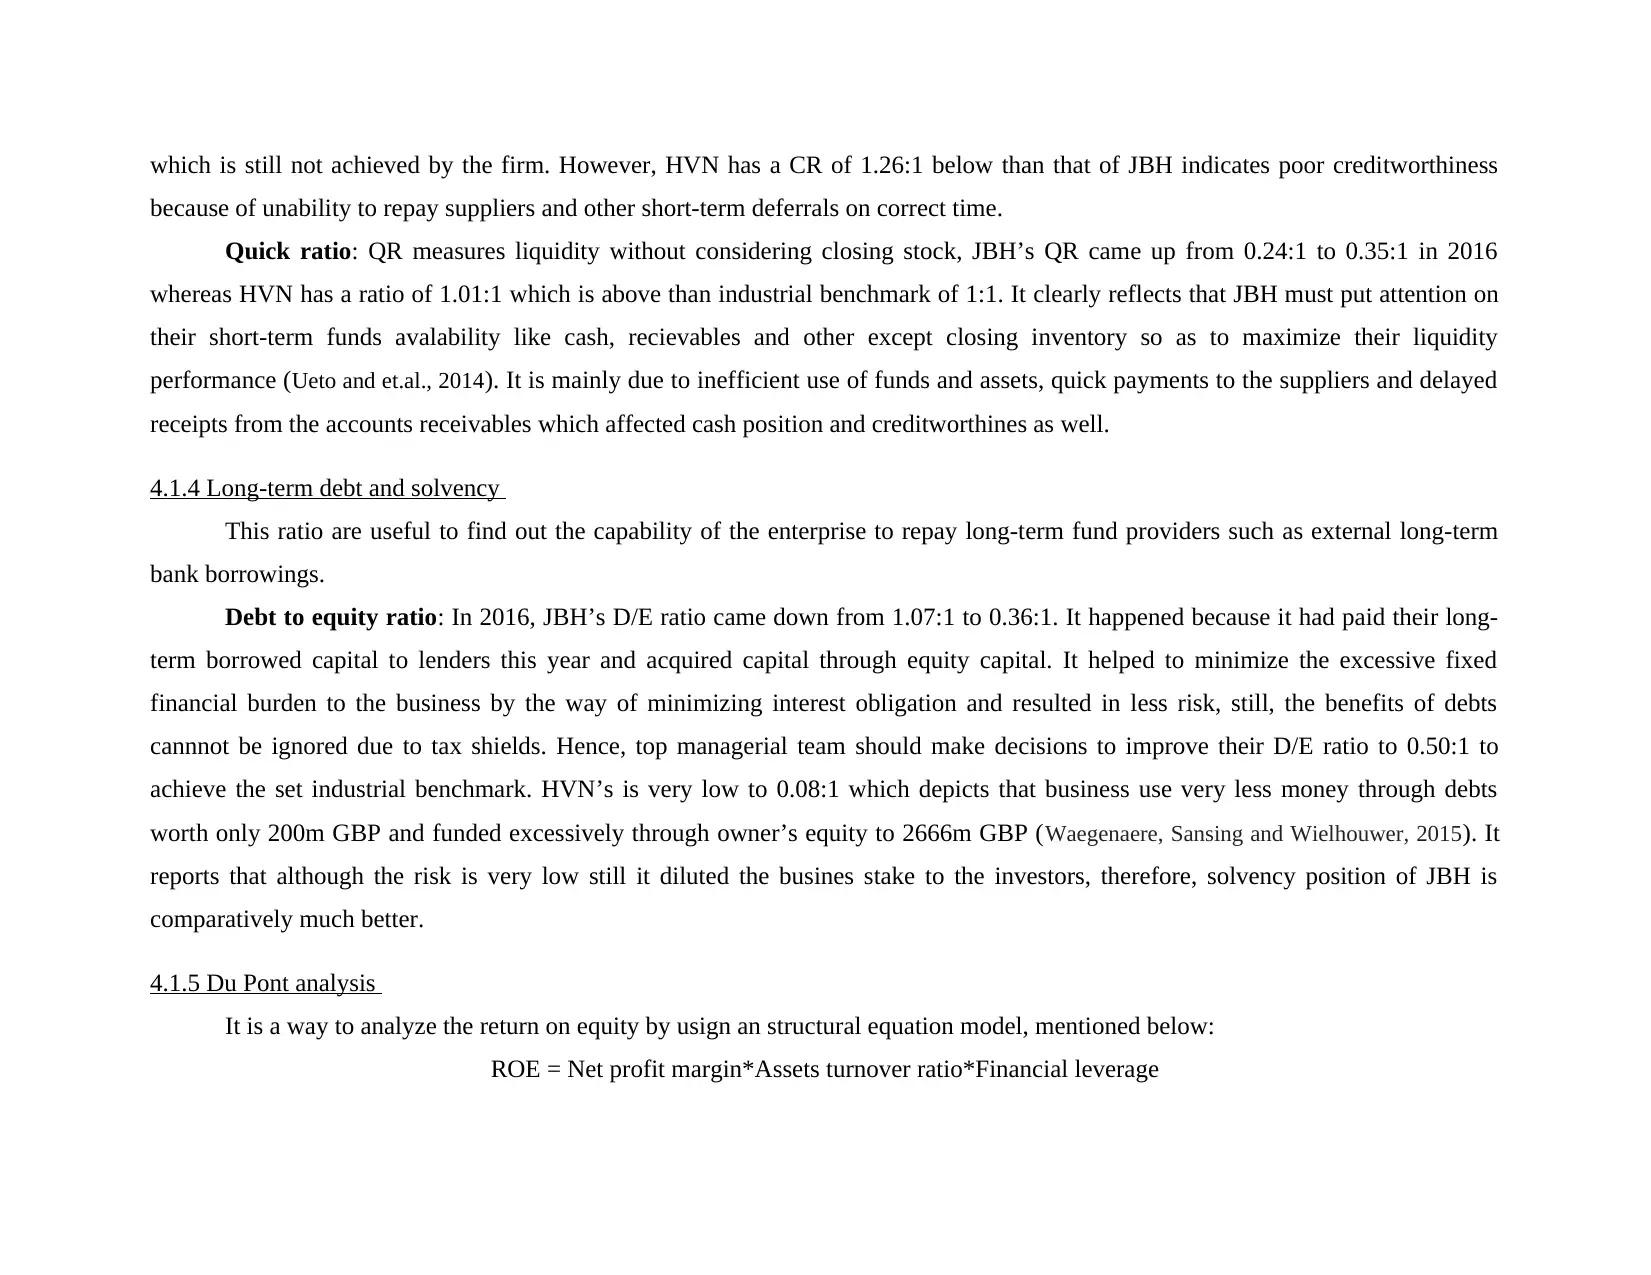
Quick ratio: QR measures liquidity without considering closing stock, JBH’s QR came up from 0.24:1 to 0.35:1 in 2016
whereas HVN has a ratio of 1.01:1 which is above than industrial benchmark of 1:1. It clearly reflects that JBH must put attention on
their short-term funds avalability like cash, recievables and other except closing inventory so as to maximize their liquidity
performance (Ueto and et.al., 2014). It is mainly due to inefficient use of funds and assets, quick payments to the suppliers and delayed
receipts from the accounts receivables which affected cash position and creditworthines as well.
4.1.4 Long-term debt and solvency
This ratio are useful to find out the capability of the enterprise to repay long-term fund providers such as external long-term
bank borrowings.
Debt to equity ratio: In 2016, JBH’s D/E ratio came down from 1.07:1 to 0.36:1. It happened because it had paid their long-
term borrowed capital to lenders this year and acquired capital through equity capital. It helped to minimize the excessive fixed
financial burden to the business by the way of minimizing interest obligation and resulted in less risk, still, the benefits of debts
cannnot be ignored due to tax shields. Hence, top managerial team should make decisions to improve their D/E ratio to 0.50:1 to
achieve the set industrial benchmark. HVN’s is very low to 0.08:1 which depicts that business use very less money through debts
worth only 200m GBP and funded excessively through owner’s equity to 2666m GBP (Waegenaere, Sansing and Wielhouwer, 2015). It
reports that although the risk is very low still it diluted the busines stake to the investors, therefore, solvency position of JBH is
comparatively much better.
4.1.5 Du Pont analysis
It is a way to analyze the return on equity by usign an structural equation model, mentioned below:
ROE = Net profit margin*Assets turnover ratio*Financial leverage
because of unability to repay suppliers and other short-term deferrals on correct time.
Quick ratio: QR measures liquidity without considering closing stock, JBH’s QR came up from 0.24:1 to 0.35:1 in 2016
whereas HVN has a ratio of 1.01:1 which is above than industrial benchmark of 1:1. It clearly reflects that JBH must put attention on
their short-term funds avalability like cash, recievables and other except closing inventory so as to maximize their liquidity
performance (Ueto and et.al., 2014). It is mainly due to inefficient use of funds and assets, quick payments to the suppliers and delayed
receipts from the accounts receivables which affected cash position and creditworthines as well.
4.1.4 Long-term debt and solvency
This ratio are useful to find out the capability of the enterprise to repay long-term fund providers such as external long-term
bank borrowings.
Debt to equity ratio: In 2016, JBH’s D/E ratio came down from 1.07:1 to 0.36:1. It happened because it had paid their long-
term borrowed capital to lenders this year and acquired capital through equity capital. It helped to minimize the excessive fixed
financial burden to the business by the way of minimizing interest obligation and resulted in less risk, still, the benefits of debts
cannnot be ignored due to tax shields. Hence, top managerial team should make decisions to improve their D/E ratio to 0.50:1 to
achieve the set industrial benchmark. HVN’s is very low to 0.08:1 which depicts that business use very less money through debts
worth only 200m GBP and funded excessively through owner’s equity to 2666m GBP (Waegenaere, Sansing and Wielhouwer, 2015). It
reports that although the risk is very low still it diluted the busines stake to the investors, therefore, solvency position of JBH is
comparatively much better.
4.1.5 Du Pont analysis
It is a way to analyze the return on equity by usign an structural equation model, mentioned below:
ROE = Net profit margin*Assets turnover ratio*Financial leverage
Paraphrase This Document
Need a fresh take? Get an instant paraphrase of this document with our AI Paraphraser
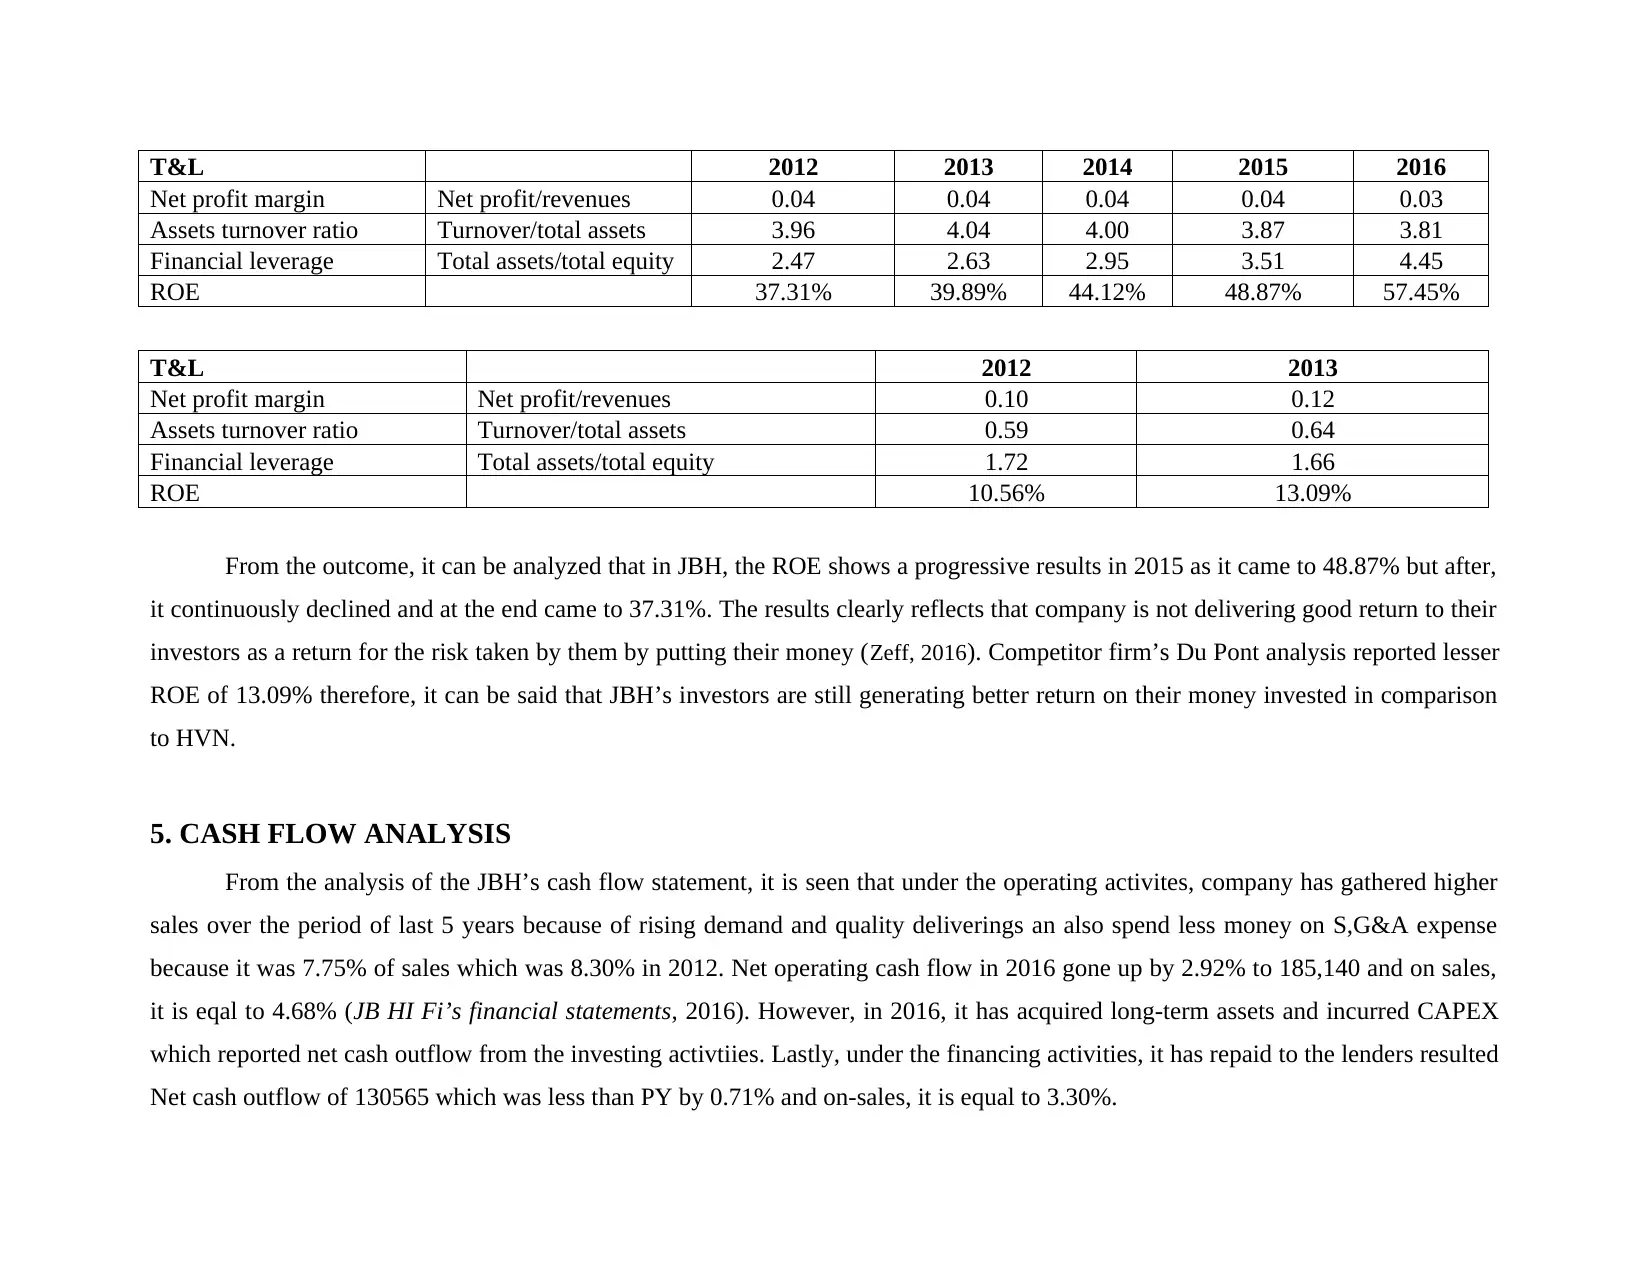
T&L 2012 2013 2014 2015 2016
Net profit margin Net profit/revenues 0.04 0.04 0.04 0.04 0.03
Assets turnover ratio Turnover/total assets 3.96 4.04 4.00 3.87 3.81
Financial leverage Total assets/total equity 2.47 2.63 2.95 3.51 4.45
ROE 37.31% 39.89% 44.12% 48.87% 57.45%
T&L 2012 2013
Net profit margin Net profit/revenues 0.10 0.12
Assets turnover ratio Turnover/total assets 0.59 0.64
Financial leverage Total assets/total equity 1.72 1.66
ROE 10.56% 13.09%
From the outcome, it can be analyzed that in JBH, the ROE shows a progressive results in 2015 as it came to 48.87% but after,
it continuously declined and at the end came to 37.31%. The results clearly reflects that company is not delivering good return to their
investors as a return for the risk taken by them by putting their money (Zeff, 2016). Competitor firm’s Du Pont analysis reported lesser
ROE of 13.09% therefore, it can be said that JBH’s investors are still generating better return on their money invested in comparison
to HVN.
5. CASH FLOW ANALYSIS
From the analysis of the JBH’s cash flow statement, it is seen that under the operating activites, company has gathered higher
sales over the period of last 5 years because of rising demand and quality deliverings an also spend less money on S,G&A expense
because it was 7.75% of sales which was 8.30% in 2012. Net operating cash flow in 2016 gone up by 2.92% to 185,140 and on sales,
it is eqal to 4.68% (JB HI Fi’s financial statements, 2016). However, in 2016, it has acquired long-term assets and incurred CAPEX
which reported net cash outflow from the investing activtiies. Lastly, under the financing activities, it has repaid to the lenders resulted
Net cash outflow of 130565 which was less than PY by 0.71% and on-sales, it is equal to 3.30%.
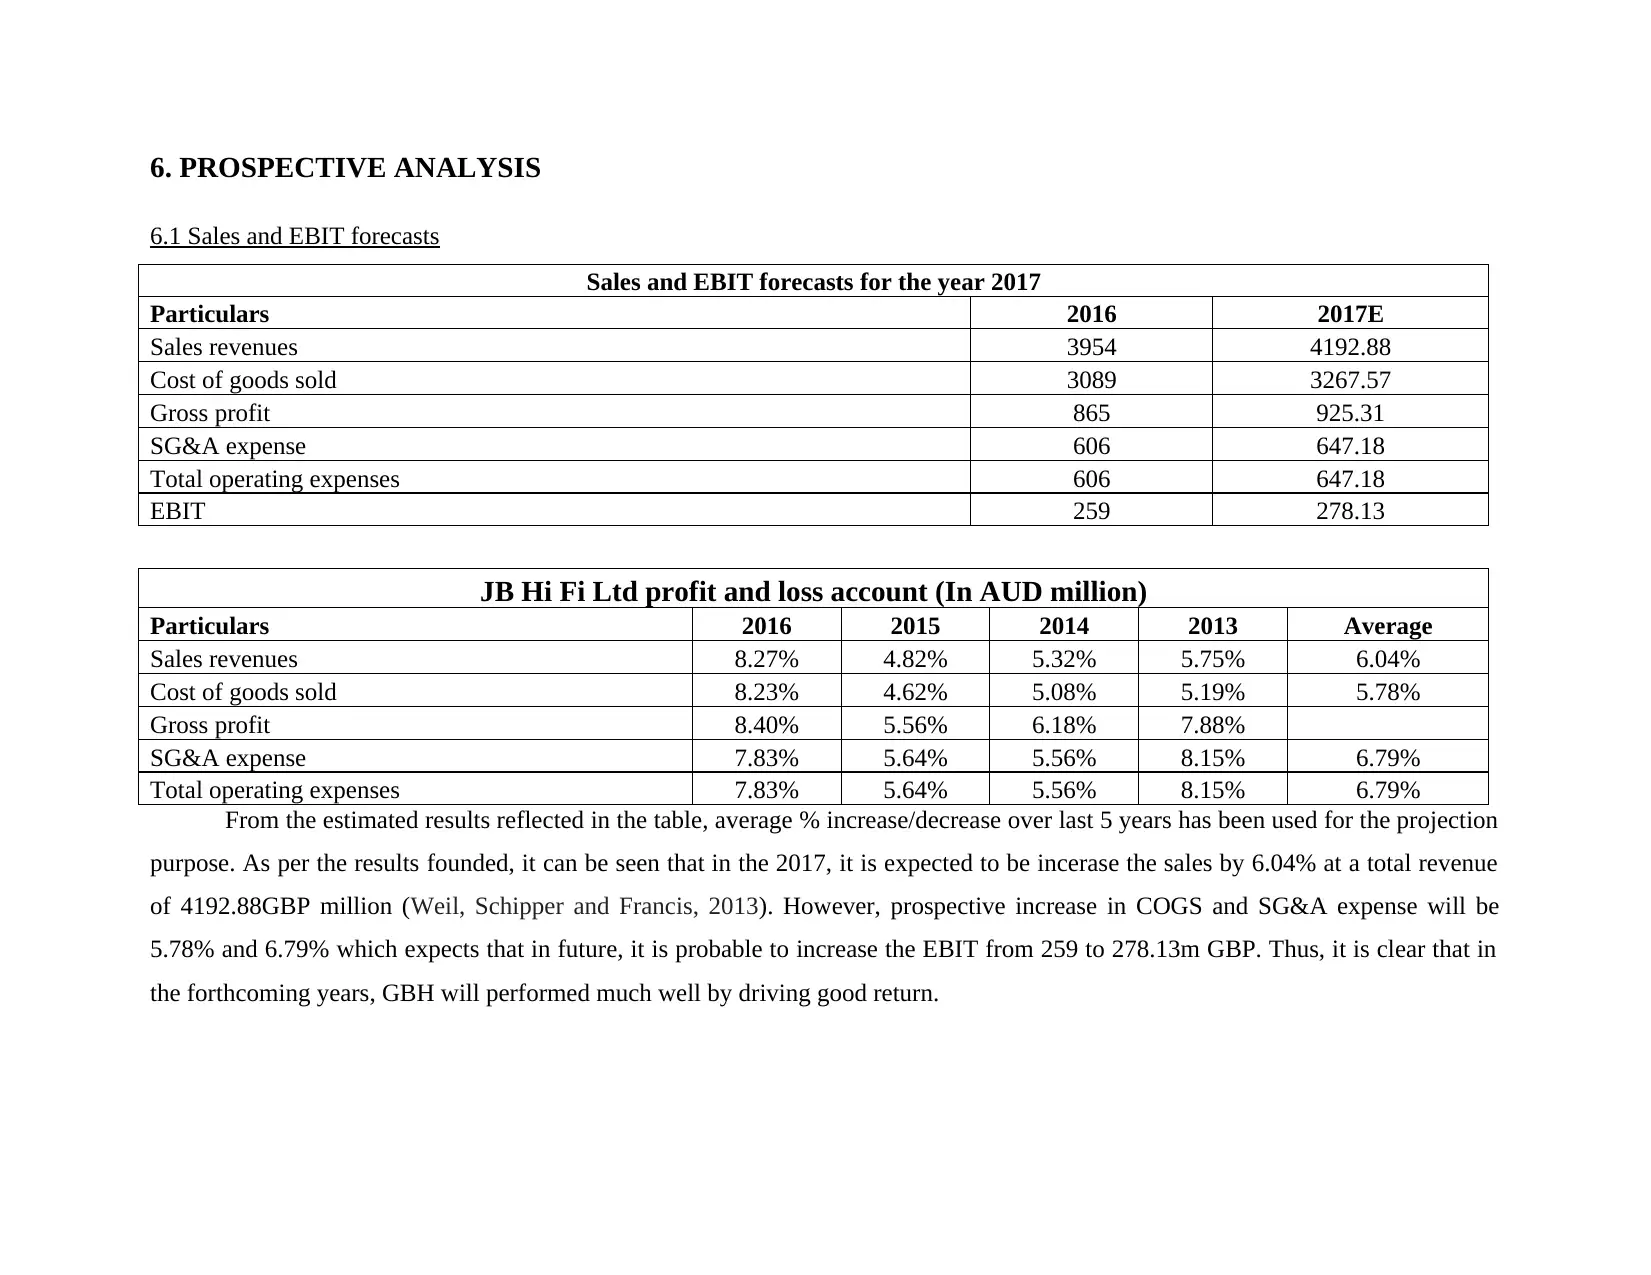
6. PROSPECTIVE ANALYSIS
6.1 Sales and EBIT forecasts
Sales and EBIT forecasts for the year 2017
Particulars 2016 2017E
Sales revenues 3954 4192.88
Cost of goods sold 3089 3267.57
Gross profit 865 925.31
SG&A expense 606 647.18
Total operating expenses 606 647.18
EBIT 259 278.13
JB Hi Fi Ltd profit and loss account (In AUD million)
Particulars 2016 2015 2014 2013 Average
Sales revenues 8.27% 4.82% 5.32% 5.75% 6.04%
Cost of goods sold 8.23% 4.62% 5.08% 5.19% 5.78%
Gross profit 8.40% 5.56% 6.18% 7.88%
SG&A expense 7.83% 5.64% 5.56% 8.15% 6.79%
Total operating expenses 7.83% 5.64% 5.56% 8.15% 6.79%
From the estimated results reflected in the table, average % increase/decrease over last 5 years has been used for the projection
purpose. As per the results founded, it can be seen that in the 2017, it is expected to be incerase the sales by 6.04% at a total revenue
of 4192.88GBP million (Weil, Schipper and Francis, 2013). However, prospective increase in COGS and SG&A expense will be
5.78% and 6.79% which expects that in future, it is probable to increase the EBIT from 259 to 278.13m GBP. Thus, it is clear that in
the forthcoming years, GBH will performed much well by driving good return.
⊘ This is a preview!⊘
Do you want full access?
Subscribe today to unlock all pages.
Trusted by 1+ million students worldwide
1 out of 21
Related Documents


Your All-in-One AI-Powered Toolkit for Academic Success.
+13062052269
info@desklib.com
Available 24*7 on WhatsApp / Email
![[object Object]](/_next/static/media/star-bottom.7253800d.svg)
Unlock your academic potential
Copyright © 2020–2026 A2Z Services. All Rights Reserved. Developed and managed by ZUCOL.